Earning Reports Mixed But Not Terrible


Inside This Week’s Bull Bear Report
- Sell Signal Confirmed By Selling Pressure
- Earning Reports Mixed But Not Terrible
- How We Are Trading It
- Research Report – Conviction (Or A Way To Lose A Lot Of Money)
- Youtube – Before The Bell
- Stock Of The Week
- Daily Commentary Bits
- Market Statistics
- Stock Screens
- Portfolio Trades This Week
Despite Technology Bounce, Sell Signals Are In
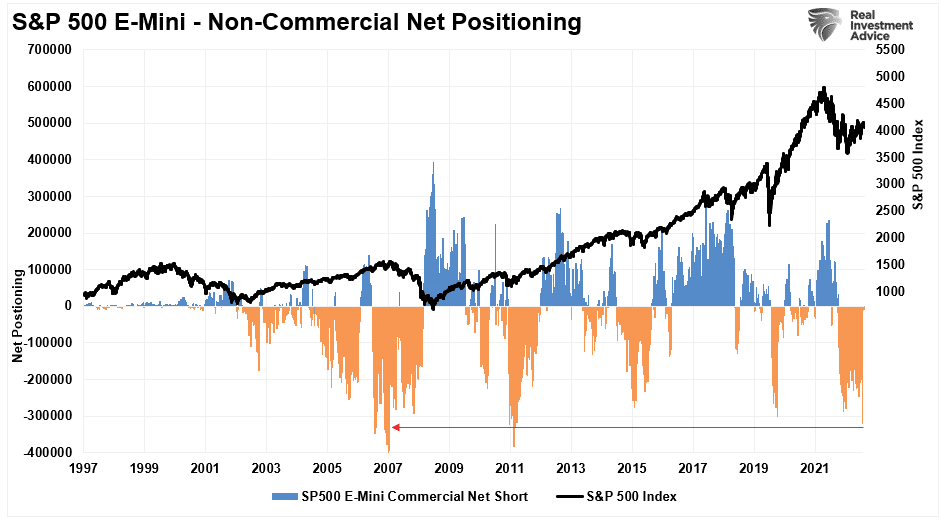
This week, the market mustered a rally as corporate earnings were not as “terrible as expected.” Part of that rally came from short-term oversold conditions and a massive short position in the S&P 500 index.
However, selling early in the week triggered our “sell” signals as expected.
The MACD buy signal remains intact but is very close to triggering a sell signal which could occur next week.
With such a significant short position on the index, rallies can be sharp as investors are forced to cover their positions. Furthermore, it is not uncommon for the market to rally during a consolidation or correction when sell signals are intact. As shown below, we have seen several such rallies during corrective periods since November 2021.
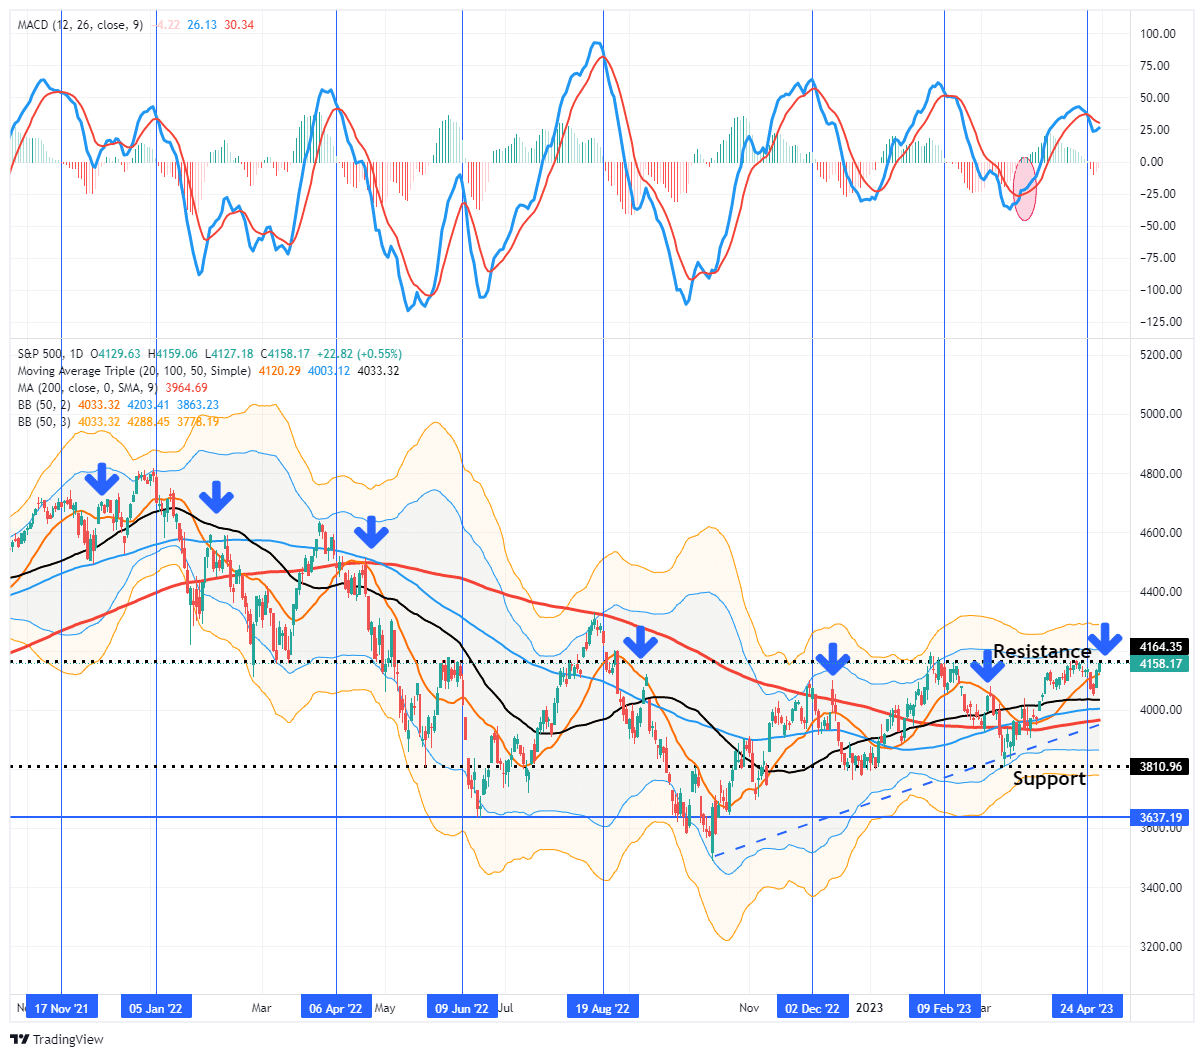
Given that the MACD “sell signal” turned from a lower level than the three previous peaks, we could see a short-term reversal to a buy signal. However, should such occur, there is likely limited upside. Therefore, we suggest using the current rally to reduce risk, rebalance portfolios and raise cash levels moderately is still advisable.
While the markets are rallying on earnings not being as “terrible” as expected, that still isn’t saying much. As we will discuss, the risk to earnings remains with the consumer. Since consumption is where revenues come from, the recent economic data does not wholly support expectations of an earnings resurgence.
Need Help With Your Investing Strategy?
Are you looking for complete financial, insurance, and estate planning? Need a risk-managed portfolio management strategy to grow and protect your savings? Whatever your needs are, we are here to help.

Earnings Reports Mixed But Not Terrible
As this week got underway, the deluge of earnings reports delivered mixed results ranging from the bad to the not-so-bad to the good. However, overall, earnings came in “not so terrible,” providing some hope that October may have marked market lows.
Before we get too excited, it is essential to remember that estimates for Q1 results were lowered dramatically from June 2022 through the end of March. As shown, in May 2022, estimates for Q1 2023 were $225 per share. However, by April 1st, 2023, those estimates fell to $171. In other words, expectations had dropped by $54 per share before the first company even reported earnings.
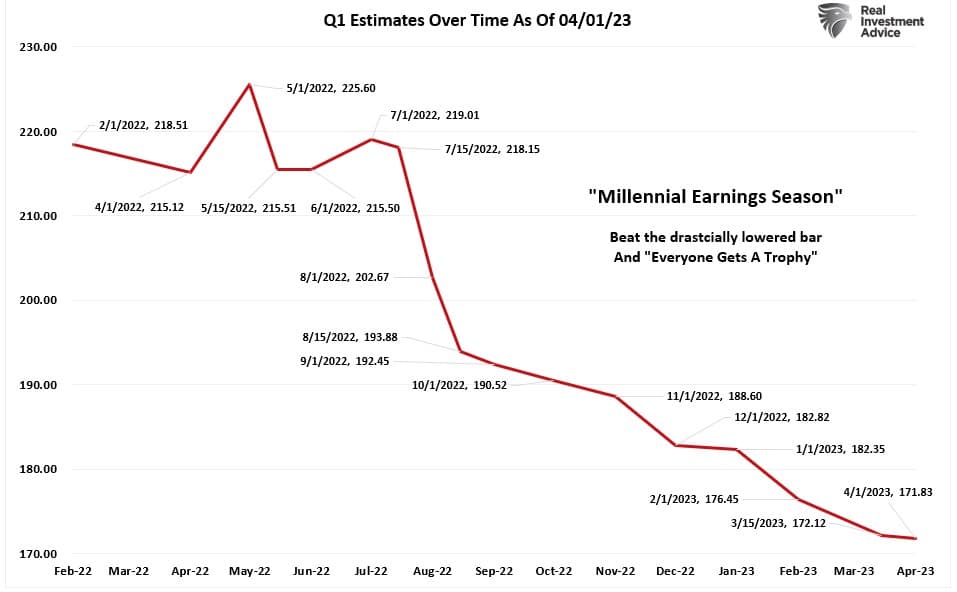
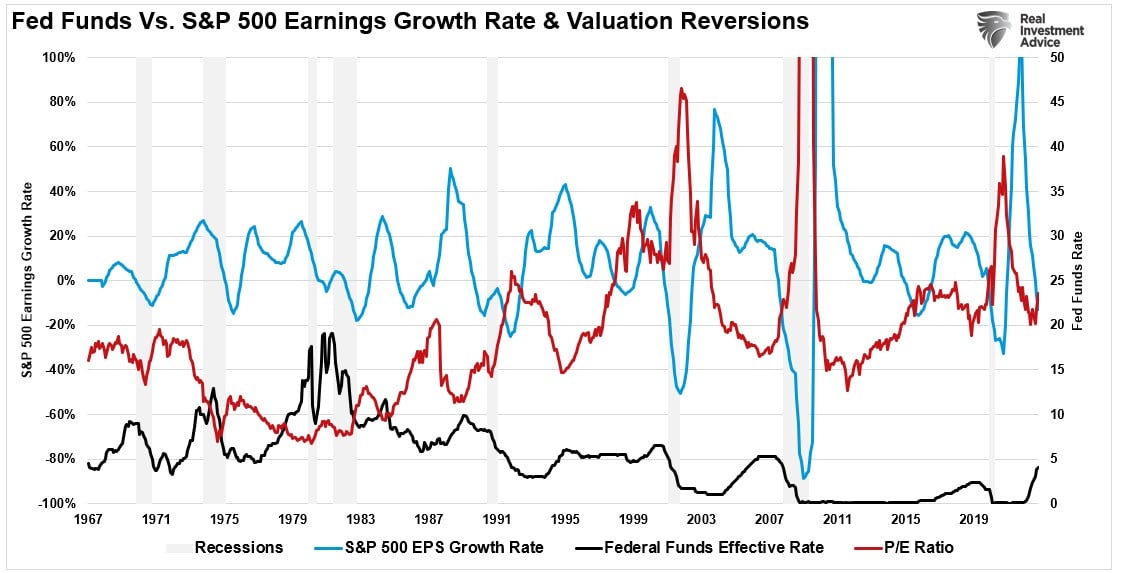
In other words, if we held analysts to their original estimates, the earnings season, so far, is dramatically worse than it seems. Importantly, since we “pay” for earnings when we buy stocks, it is hard to suggest the market has already priced in reduced earnings when looking through the lens of valuations. As shown, the decline in earnings is leading to increased valuations because the market is correcting in price to adjust for lower revenues. However, given the aggressiveness of Fed rate hikes, if the economy does slip into recession, the valuation issue will become problematic as earning and margin pressures increase.
While many hope the economy can avoid a recession, recent reports from economically sensitive companies, like UPS, suggest that risk is rising. As noted by the WSJ:
“United Parcel Service and Packaging Corp’s first-quarter earnings reports carried an ominous warning for e-commerce companies preparing their own quarterly results: Americans are ordering fewer things online. Both UPS and Packaging Corp. of America saw sales drop compared with the same period last year—a move the companies attributed to lower box and package volumes. Packaging Corp. produces boxes and other packaging solutions.”
Furthermore, while the economy grew at roughly 2.5% in the 4th quarter of 2022, that growth rate plunged to 1.1% in Q1. If that decline rate holds, such would suggest an economic recession by Q4 of 2023.
Consumers May Be Hitting The Wall
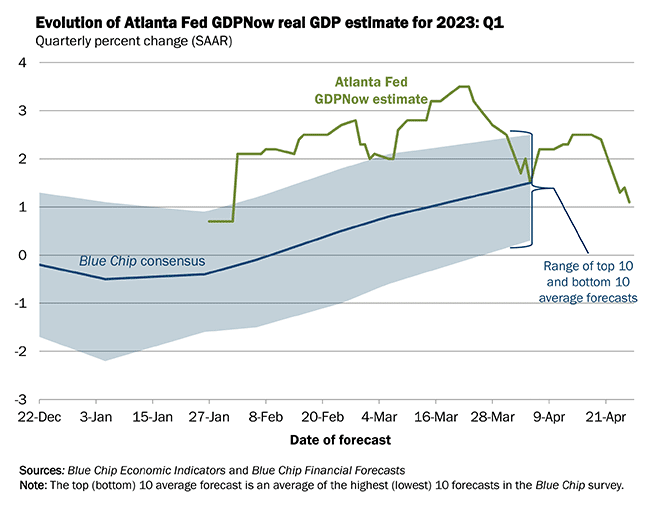
Confirming the earnings report by UPS, the commentary associated with the GDPNow report was equally damning.
“The GDPNow model estimate for real GDP growth (seasonally adjusted annual rate) in the first quarter of 2023 is 1.1 percent on April 26, down from 2.5 percent on April 18. After recent releases, the US Census Bureau and the US National Association of Realtors, the nowcasts of first-quarter real personal consumption expenditures growth and first-quarter real gross private domestic investment growth decreased from 4.2 percent and -5.8 percent, respectively, to 2.7 percent and -8.0 percent. In contrast, the nowcast of the contribution of the change in real net exports to first-quarter real GDP growth increased from 0.26 percentage points to 0.30 percentage points.”
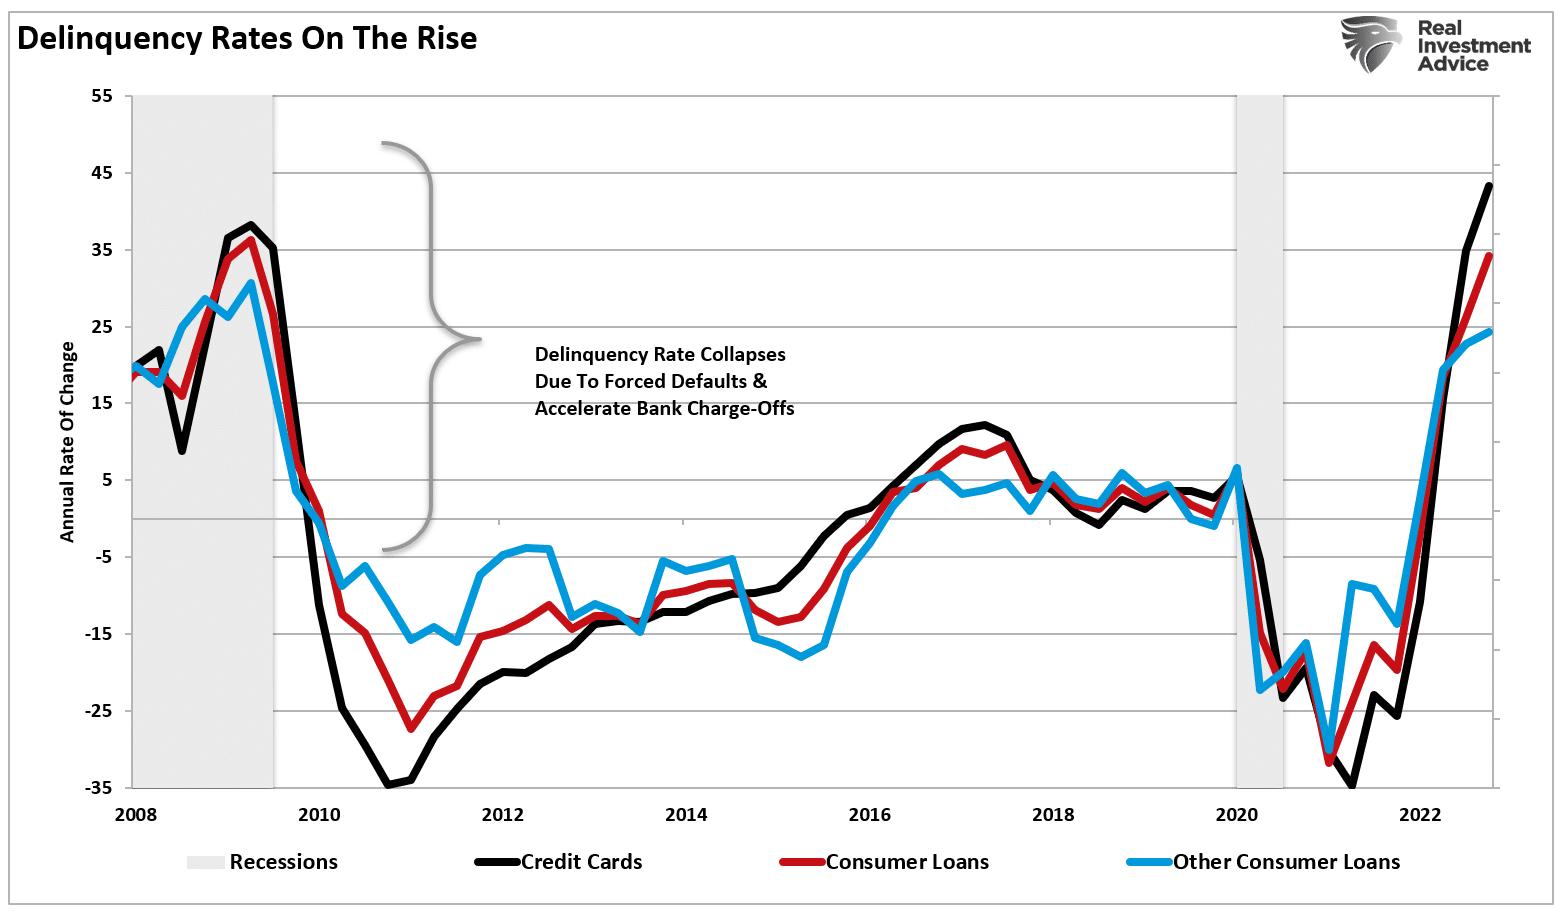
Given that consumer spending makes up roughly 70% of the GDP calculation, that 35% decline in consumer spending is significant. Combine that drop in consumer spending with rising credit card delinquencies, and you can understand our concern about economic growth going forward.
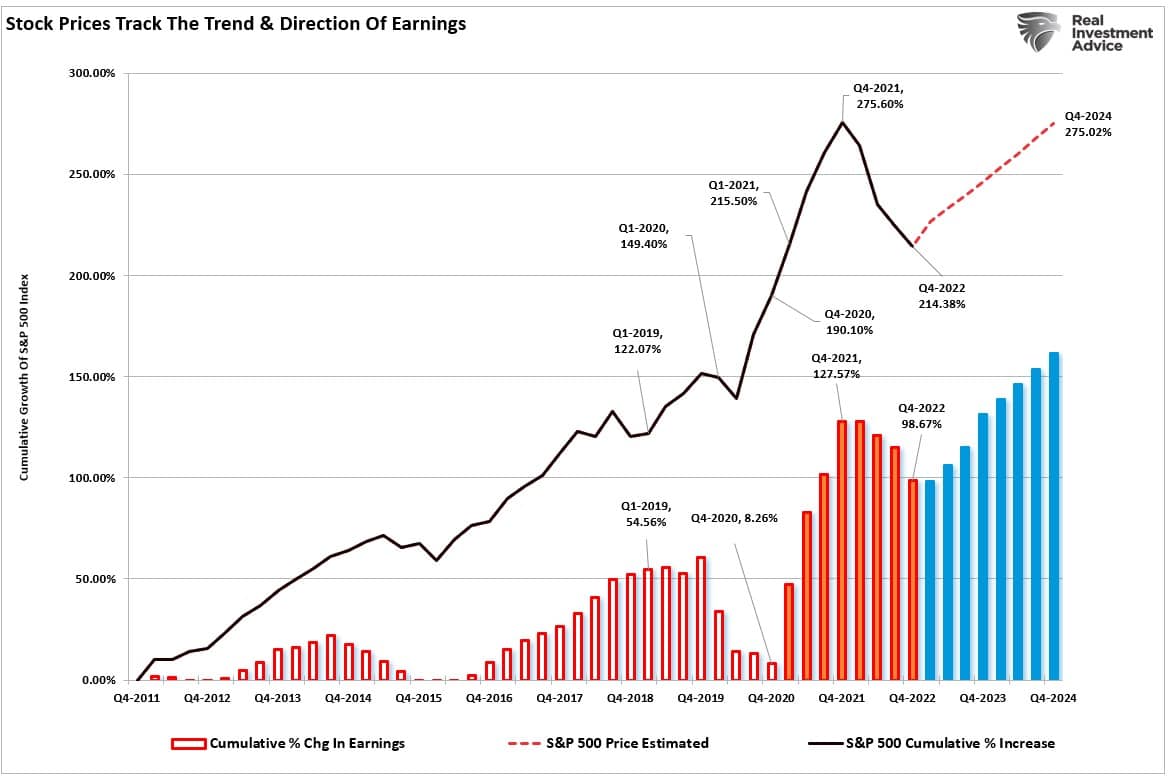
The implications of slower consumer spending, rising delinquencies, and slower economic growth have significant consequences for forward earnings growth. However, mainstream analysts largely ignore those implications predicting a sharp increase in earnings by the end of 2024.
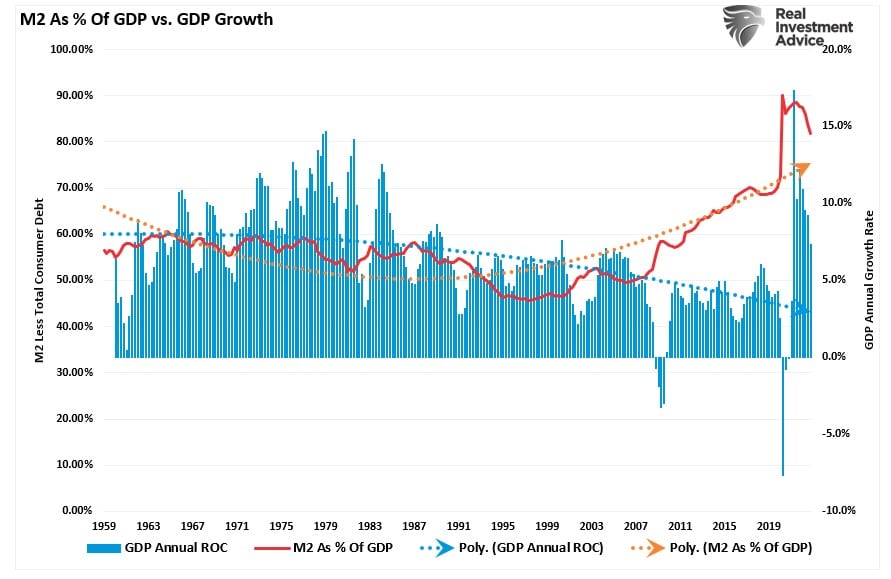
While markets cheer “better than expected” earnings, the forward risk seems outsized. Furthermore, we remain concerned about two factors in particular. The first is the lag effect of monetary tightening and reduced liquidity. The second is the declining money supply in the system (M2) as a percentage of economic growth. Notably, that support that has kept the economy afloat longer than many expected is reversing.
Bad Breadth
While the markets, particularly the Nasdaq, tried to rally this week on the “not as terrible as expected” earnings reports, that rally is a function of investors crowding into a select few stocks to gain exposure. As Bob Farrell once quipped in his most important “10-Rules Of Investing:”
“Markets are strongest when they are broad and weakest when they narrow to a handful of blue-chip names.”
In other words, market “breadth” is critical. When the markets rally on narrow breadth, such indicates limited participation and an increased chance a failure of the rally is above average. Logically, the market cannot continue to rally with just a few large-cap names leading the way. Small- and mid-sized capitalization companies must also be on board to give the rally credibility. A rally that lifts all boats indicates strength and increases the chances of further gains.
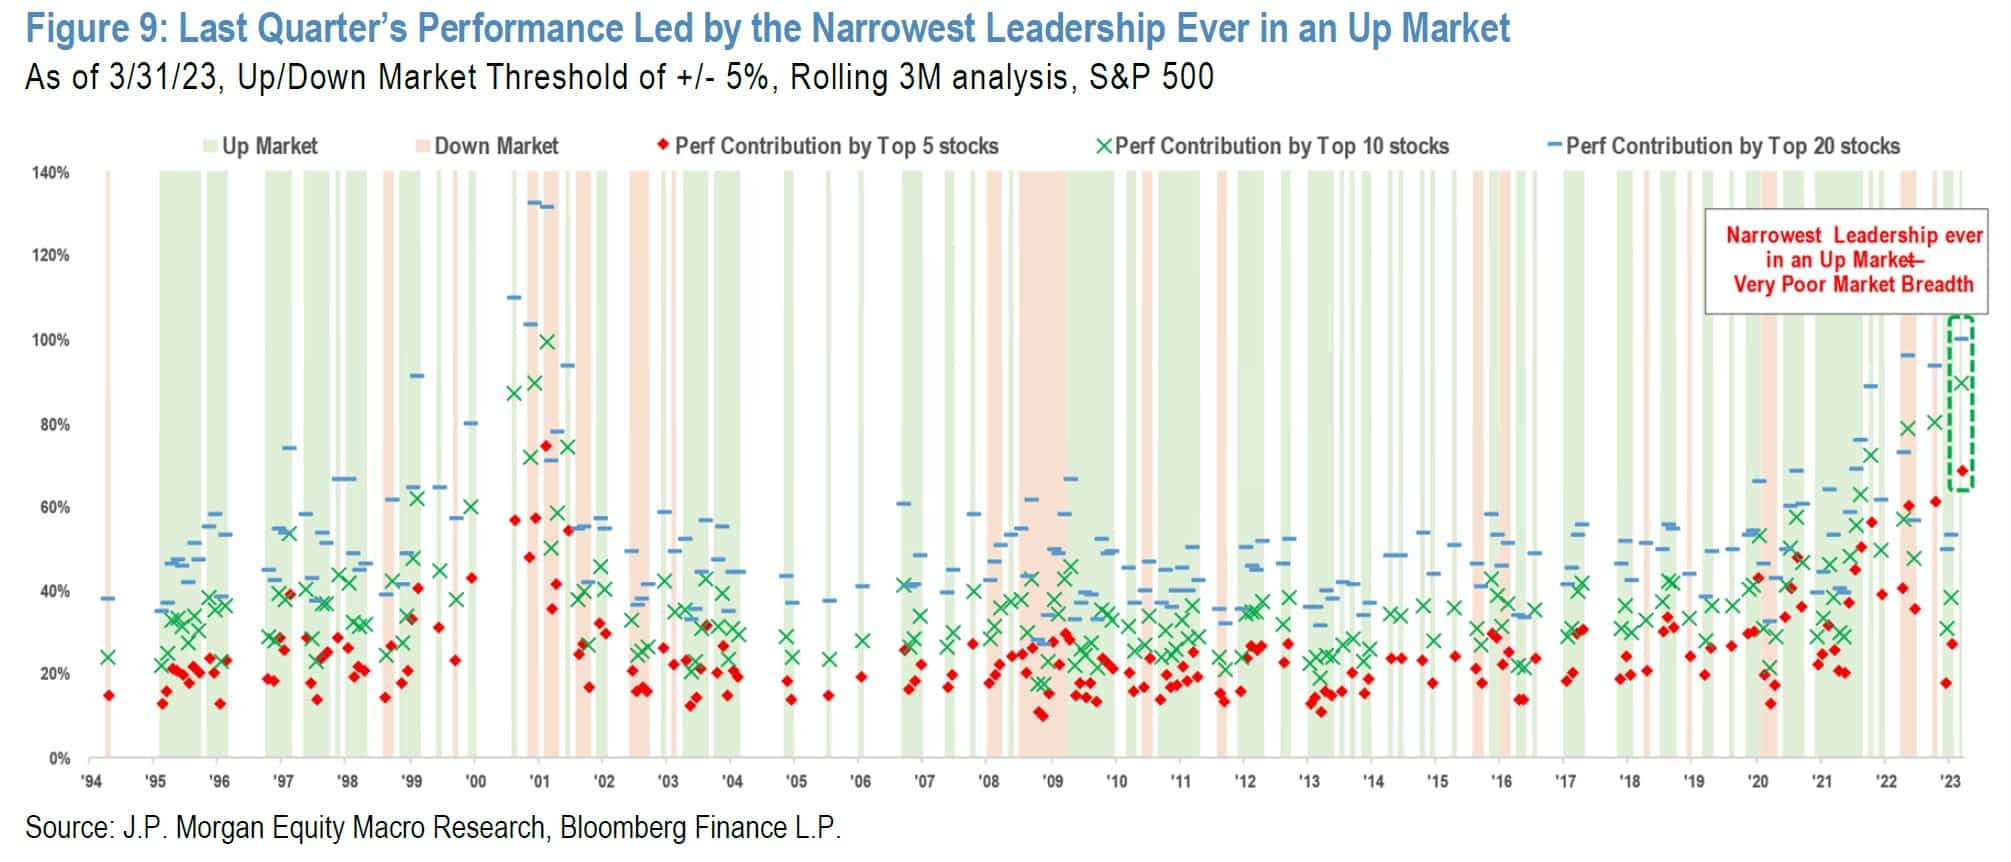
Currently, the breadth is not only narrow, but it is incredibly narrow. As noted by JP Morgan this week:
“S&P 500 index staged an ~8% rally this year. However, the underlying market breadth, by some measures, is the weakest ever, with the narrowest stock leadership in an up market since the 1990s. Further, equity upside has been driven by a combination of very narrow growth leadership. Interest in Generative AI / Large Language Model theme appears to be stretched with market cap creation of $1.4 Trillion and a gain of ~45% YTD. Furthermore, the rotation into safety (defensive factor crowding into Mega-caps, Low Volatility / Quality, and out of Value) is stretched.“
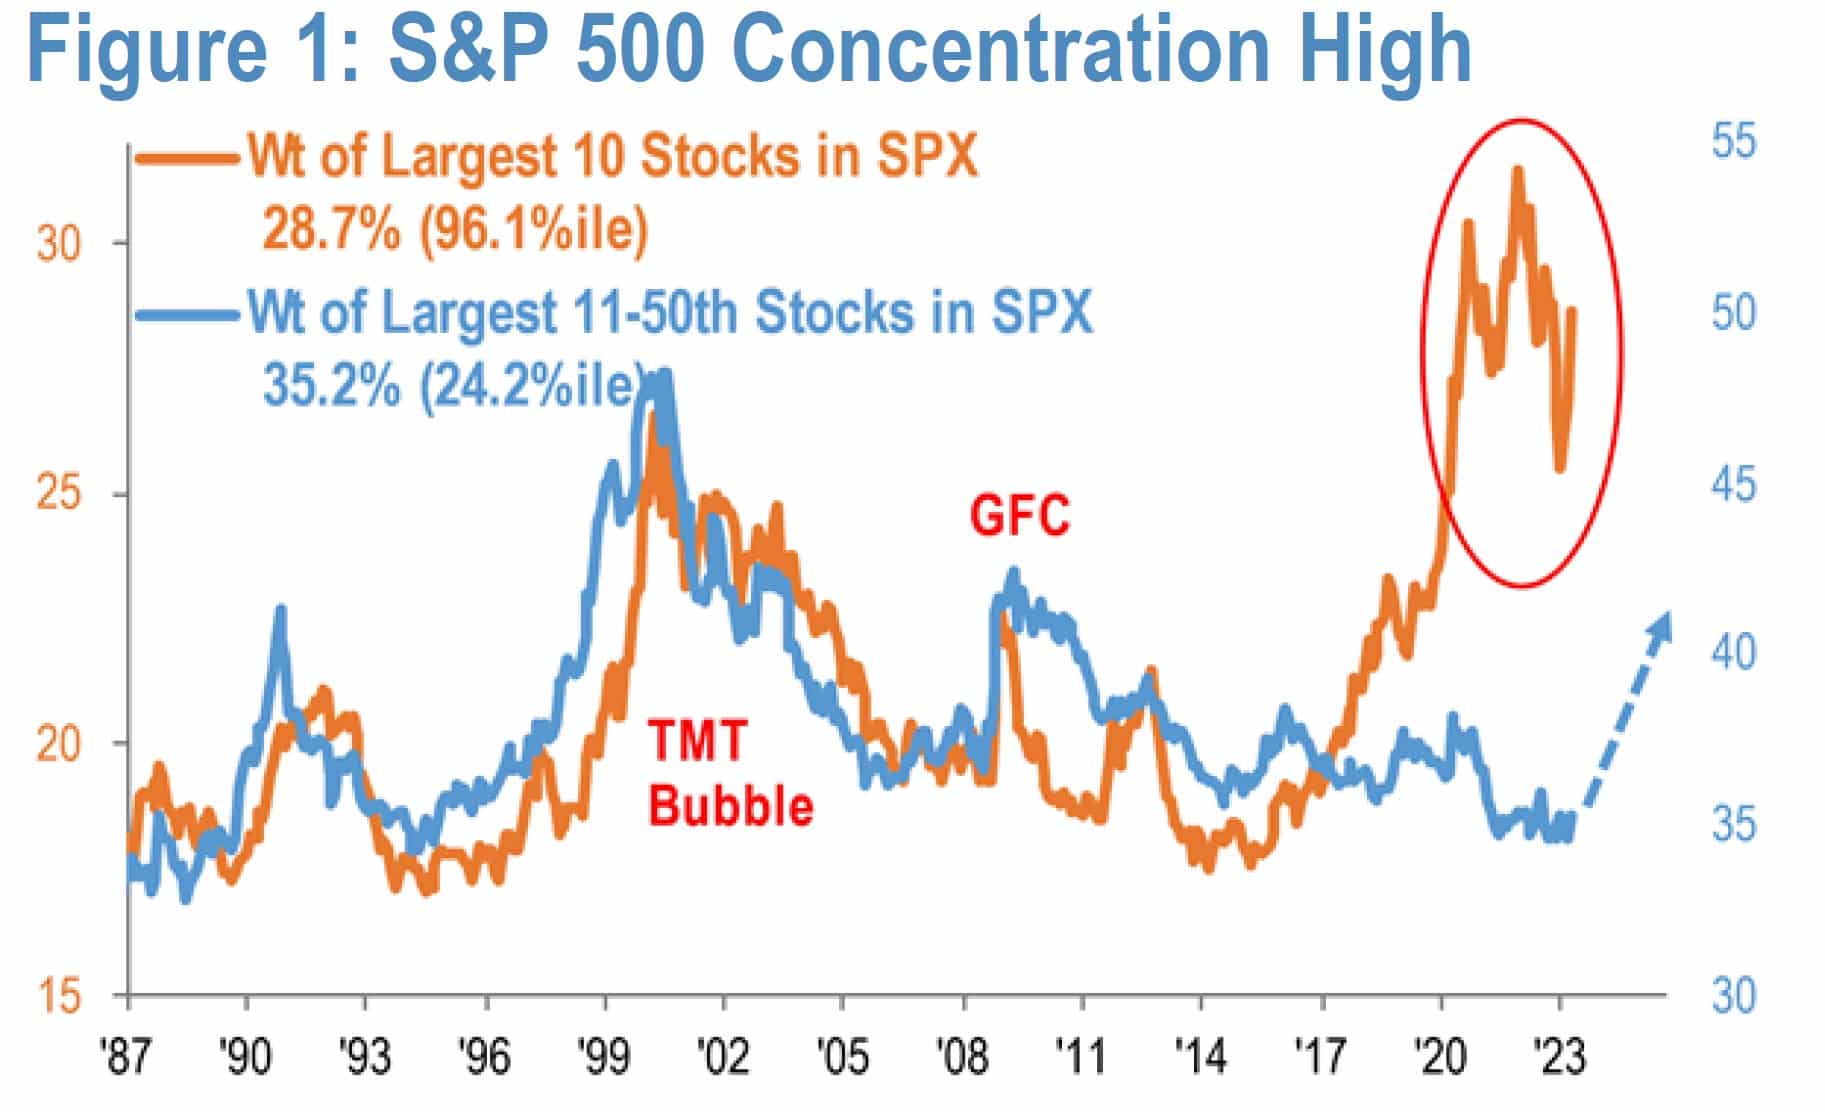
Outside of a brief period of High Beta outperformance on short covering at the start of the year, the factor rotation into Defensives / Low Volatility has been persistent. Our analysis shows this rotation is only ~33% underway compared to the prior end of cycles. More simply, the current degree of crowding implies the risk of recession is far from priced in. While in 2021, a broad market rally led by Cyclical factors (Growth and Value) drove concentration to the highest level seen since the Nifty-fifties, the current market concentration episode is less constructive for the broader market.”
So, what does that mean concerning portfolio positioning?
How We Are Trading It
While the market technicals remain bullish-biased, the defensive rotation and narrowing growth leadership typically indicate a slowing economic cycle or a recessionary onset. In the current episode, the crowding into a handful of Mega-capitalization names is already at extreme levels.
Suppose the analysis above is correct, and the economy is beginning to slow toward a recession. In that case, a rotation from these growth names into lower volatility and quality value-oriented stocks will likely occur. Such also suggests that longer-duration yields will continue to weaken as demand slows.
With our sell signals intact, such suggests that the upside may be somewhat limited. While the markets are betting on a “Fed Pivot,” as we have noted previously, such is not conducive to higher stock prices. To wit:
“Since 1970, there have been nine instances in which the Fed significantly cut the Fed Funds rate. The average maximum drawdown from the start of each rate reduction period to the market trough was 27.25%.“

While the market front-loaded some of that decline last year, it is unlikely, as noted by JP Morgan above, that recessionary pressures are fully priced into the market.
As such, we continue to use bullish rallies to raise some cash and rebalance equity risk heading into the summer months. The Fed is on deck to hike rates next week by 0.25%, and given the latest GDP report, we suspect Powell’s commentary will remain on the more “hawkish” side.
Continue reducing risks and rebalancing allocations for now.
- Tighten up stop-loss levels to current support levels for each position.
- Hedge portfolios against significant market declines.
- Take profits in positions that have been big winners.
- Sell laggards and losers.
- Raise cash and rebalance portfolios to target weightings.
Have a great week.
Research Report

Subscribe To “Before The Bell” For Daily Trading Updates (Formerly 3-Minutes)
We have set up a separate channel JUST for our short daily market updates. Please subscribe to THIS CHANNEL to receive daily notifications before the market opens.
Click Here And Then Click The SUBSCRIBE Button
Subscribe To Our Youtube Channel To Get Notified Of All Our Videos
Stock Of The Week In Review
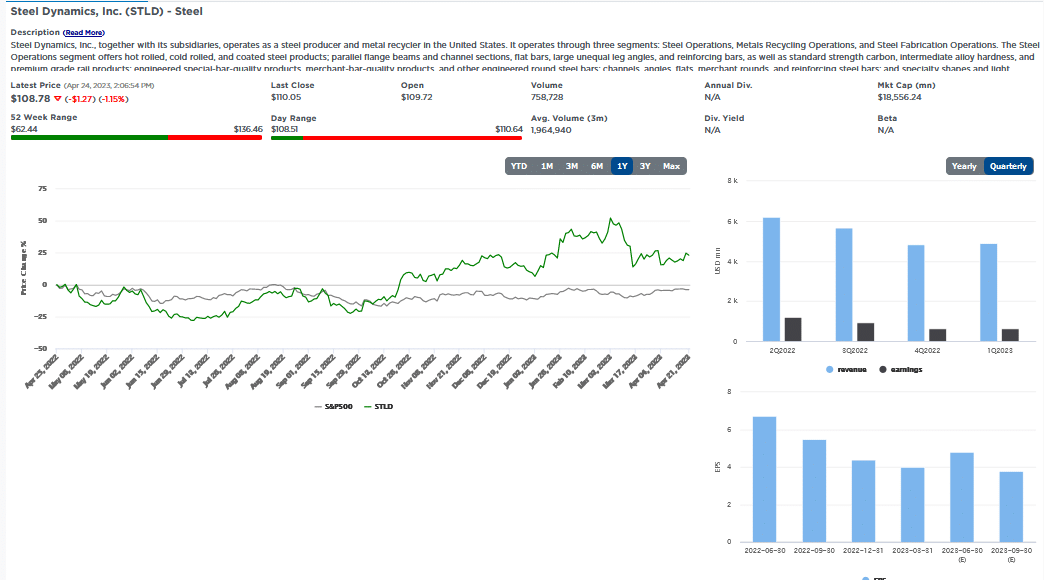
Last August, we shared a scan for cheap stocks in the basic materials sector. At the time, we aimed to find companies with cheap valuations and strong growth prospects that could benefit from higher commodity inflation. Since then, inflation peaked and moderated, led by commodity prices. As such, we thought it would be helpful to rerun the scan.
With lower prices, we had to reduce our EPS growth forecasts and prior growth to 15% from 25%. Lower prices over the last six months negatively affected their current and expected EPS. Despite the reduction, we only found four stocks that met our criteria. Two of which, STLD and WFG, were in the original scan.
Here is a link to the full SimpleVisor Article For Step-By-Step Screening Instructions.
Login to Simplevisor.com to read the full 5-For-Friday report.
Daily Commentary Tidbits
Freight Recession Warnings
“Last week JB Hunt Transportation Services (JBHT) warned that the freight trucking sector was slowing down. JBHT’s President said: “Simply stated, we’re in a freight recession.” UPS echoed their sentiment on Tuesday. First-quarter revenue for UPS fell short of expectations and 6% below last year’s level. Further, they guided forward revenue projections lower. Carol Tome, CEO, stated, “In the first quarter, deceleration in U.S. retail sales resulted in lower volume than we anticipated, and we faced ongoing demand weakness in Asia. Given current macro conditions, we expect volume to remain under pressure.” Per the WSJ, the most significant volume declines were in domestic next-day air shipments (-10.7%) and deferred services (-24.5%).
Results and statements from UPS and JBHT point to weakening demand for shipping services due to slowing economic activity. Freight activity tends to be a leading, not lagging, economic indicator. Today’s earnings release from Amazon should shed more light on shipping and the state of the consumer. Unfortunately, we must wait a few weeks for retail leaders Walmart and Target to report on earnings. Consumers have been racking up considerable credit card debt and drawing down their savings over the last year. UPS and JBHT warnings of a freight recession should be followed closely as we may be in the early innings of a consumer slowdown.”

(Subscribe To The Daily Market Commentary For A FREE Pre-Market Email)
Bull Bear Report Market Statistics & Screens

SimpleVisor Top & Bottom Performers By Sector

S&P 500 Weekly Tear Sheet

Relative Performance Analysis
As noted last week:
Much of the overbought conditions failed to resolve completely, suggesting we could see some additional weakness next week.
Such was the case at the beginning of the week, but Thursday and Friday’s advance pushed the index back into more extreme overbought territory. With the Fed on deck next week, there is a reasonable chance of a reversion that could wipe out a chunk of this past week’s gain. We still suggest using the current advance to reduce portfolio risk and raise cash levels modestly.
Technical Composite
The technical overbought/sold gauge comprises several price indicators (RSI, Williams %R, etc.), measured using “weekly” closing price data. Readings above “80” are considered overbought, and below “20” are oversold. Markets peak when those readings are 80 or above, suggesting prudent profit-taking and risk management. The best buying opportunities exist when those readings are 20 or below.
The current reading is 76.68 out of a possible 100.

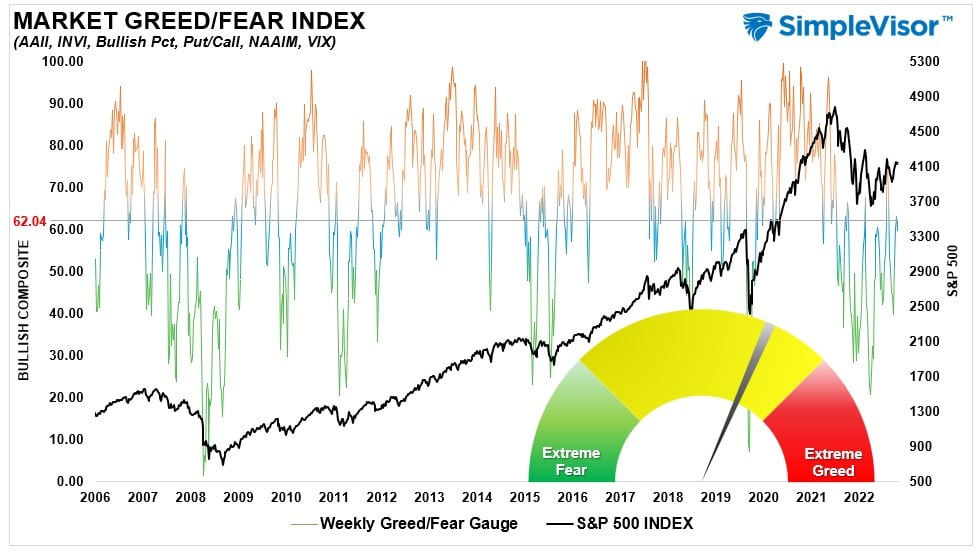
Portfolio Positioning “Fear / Greed” Gauge
The “Fear/Greed” Gauge is how individual and professional investors are “positioning” themselves in the market based on their equity exposure. From a contrarian position, the higher the allocation to equities, the more likely the market is closer to a correction than not. The gauge uses weekly closing data.
NOTE: The Fear/Greed Index measures risk from 0 to 100. It is a rarity that it reaches levels above 90. The current reading is 62.04 out of a possible 100.
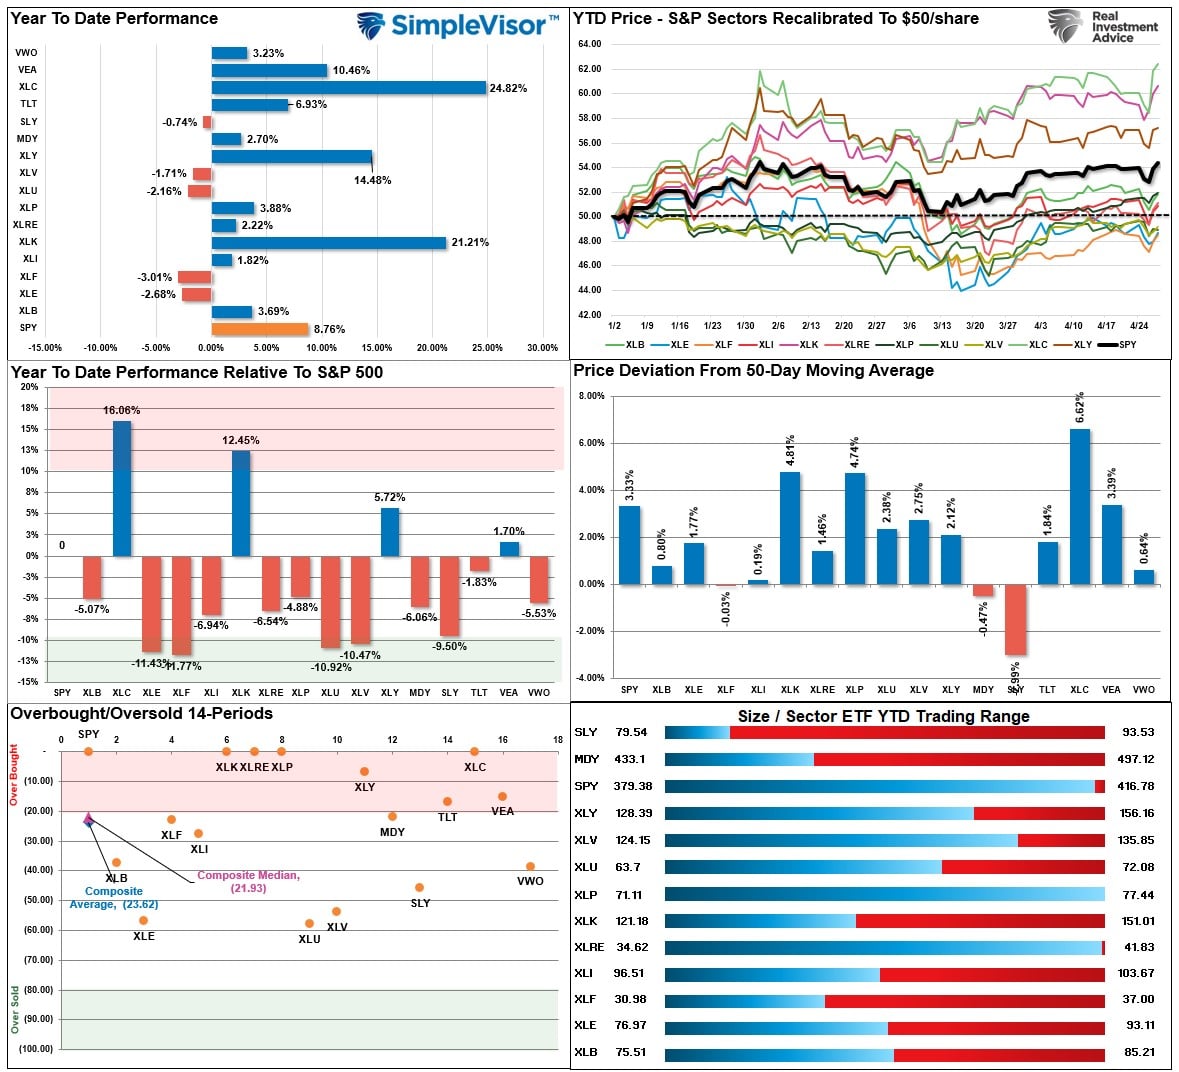
Sector Model Analysis & Risk Ranges
How To Read This Table
- The table compares the relative performance of each sector and market to the S&P 500 index.
- “M” XVER” “Moving Average Cross Over) is determined by the short-term weekly moving average crossing positively or negatively with the long-term weekly moving average.
- The risk range is a function of the month-end closing price and the “beta” of the sector or market. (Ranges reset on the 1st of each month)
- The table shows the price deviation above and below the weekly moving averages.
The Staples and Gold Miners rally has gotten to more extreme overbought conditions suggesting some profit-taking. Technology and Communications, with the rally on Thursday and Friday, will likely begin to struggle as the deviation from long-term moving averages is becoming more extreme. With most markets and sectors on bullish moving average crossovers, the most likely path for asset prices is higher over the near term. Maintain equity exposures, but watch for further rotations from grossly overbought areas into oversold.

Weekly SimpleVisor Stock Screens
We provide three stock screens each week from SimpleVisor.
This week we are searching for the Top 20:
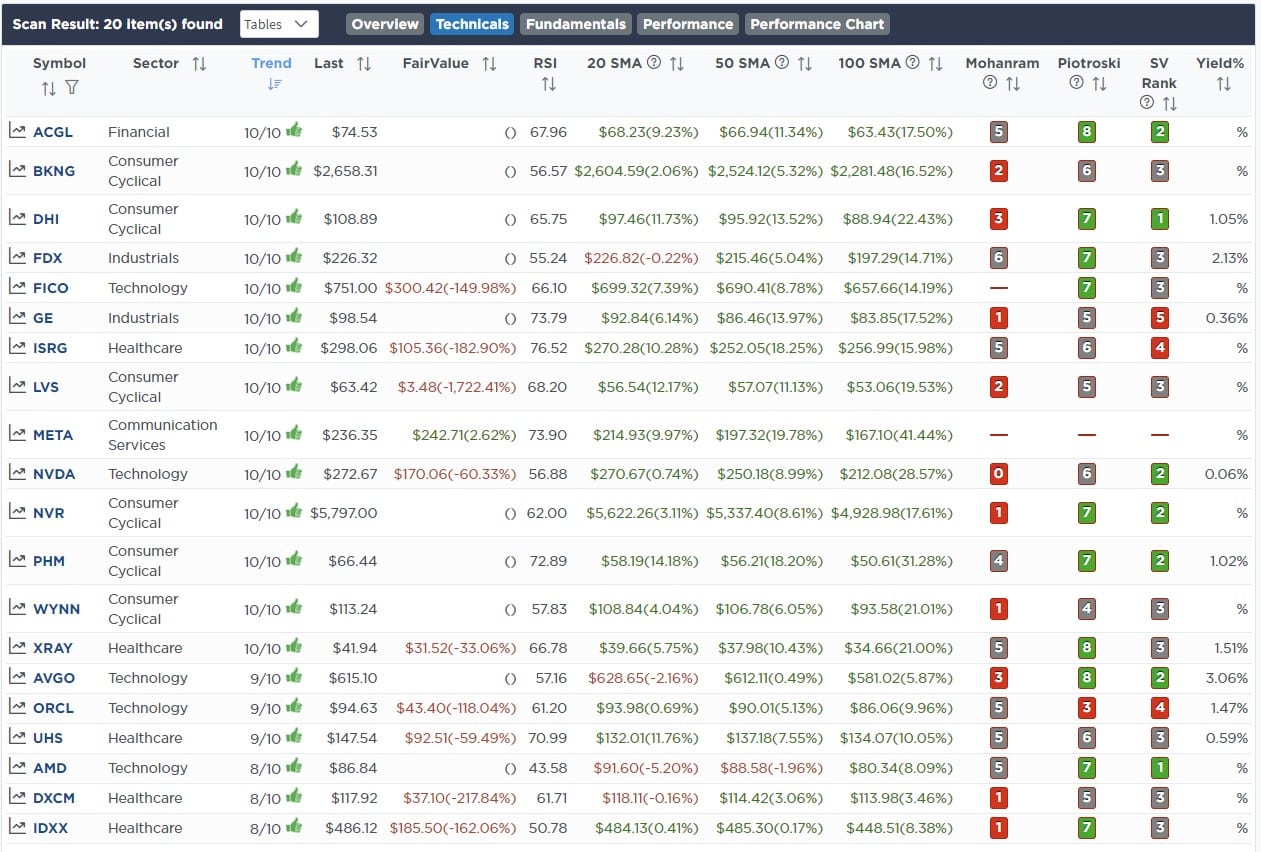
- Relative Strength Stocks
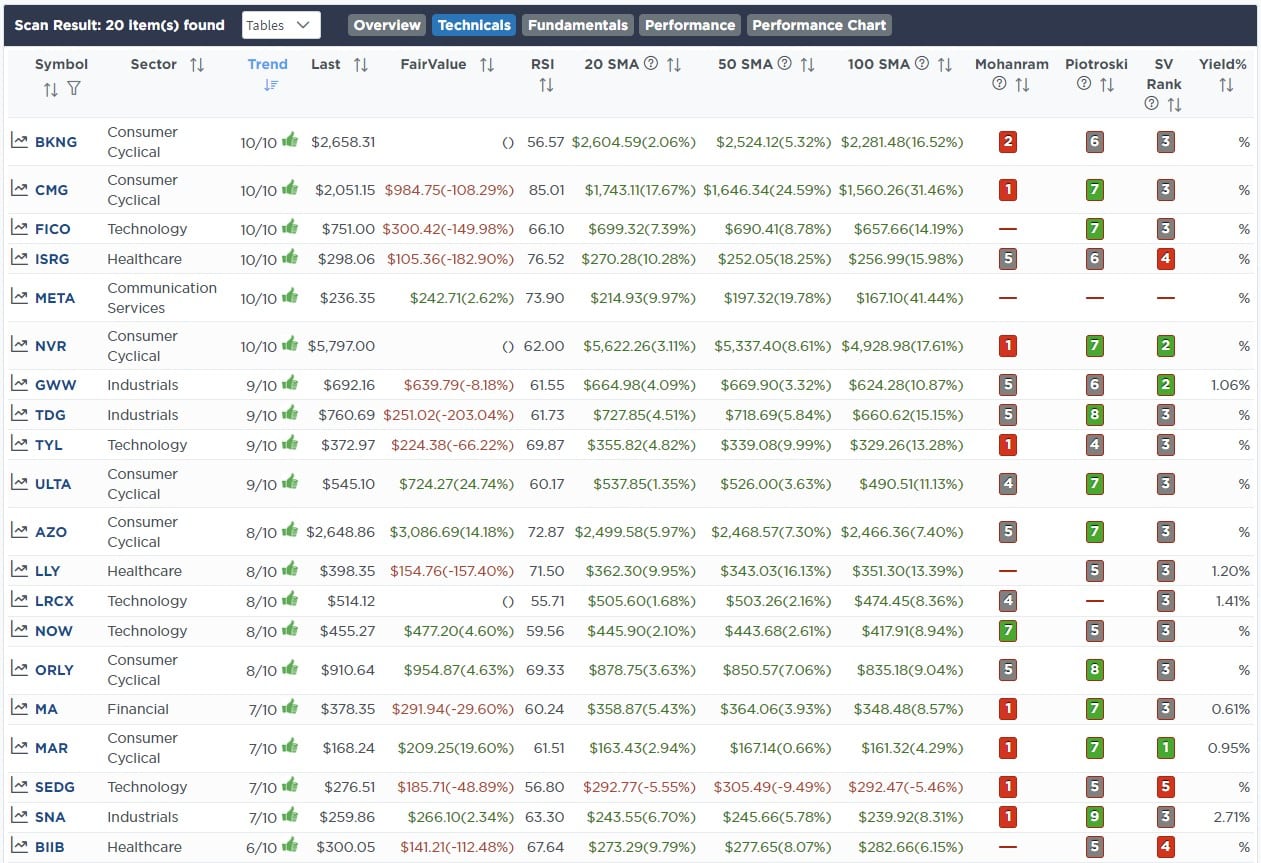
- Momentum Stocks
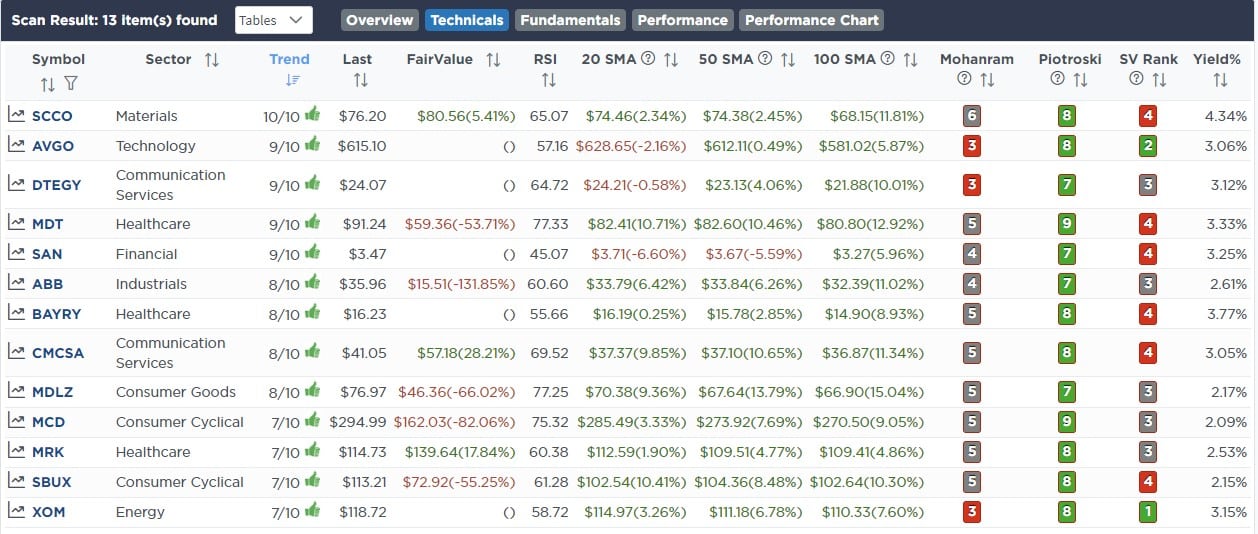
- Technically Strong Stocks With Dividends
(Click Images To Enlarge)
RSI Screen
Momentum Screen
Technically Strong With Dividends
SimpleVisor Portfolio Changes
We post all of our portfolio changes as they occur at SimpleVisor:
No Trades This Week

Lance Roberts, CIO
Have a great week!


