Correction Makes Speculators Even More Speculative 09-11-20


In this issue of “Correction Makes Speculators Even More Speculative.”
- The Correction We Warned About
- Speculators Get Even More Speculative
- Longer-Term Market Still Very Overbought
- Portfolio Positioning Update
- MacroView: A Permanent Shift To Valuations
- Sector & Market Analysis
- 401k Plan Manager
Follow Us On: Twitter, Facebook, Linked-In, Sound Cloud, Seeking Alpha

Catch Up On What You Missed Last Week

Special Video
Much of today’s commentary is also in the interview I did on Thursday with our friends over at Peak Prosperity. We discuss the market, portfolio management, risk controls, and why there is potentially still more downside risk to stocks in both the short- and intermediate-term.
The Correction We Warned About
A couple of weeks ago, in “Winter Approaches,” we discussed the potential of the correction this past week.
“None of this data means the market is about to crash. What it does mean, is that a correction of 5-10% has become increasingly likely over the next few weeks to two months.
While a 5-10% correction may not seem like much, it will feel much worse due to the high level of complacency by investors currently.”
When markets are pushing extremes, it seems like it is a “no-lose” scenario for investors. It is at those moments when “selling high” becomes opportunistic, but is incredibly hard to do for the “Fear Of Missing Out (FOMO)”
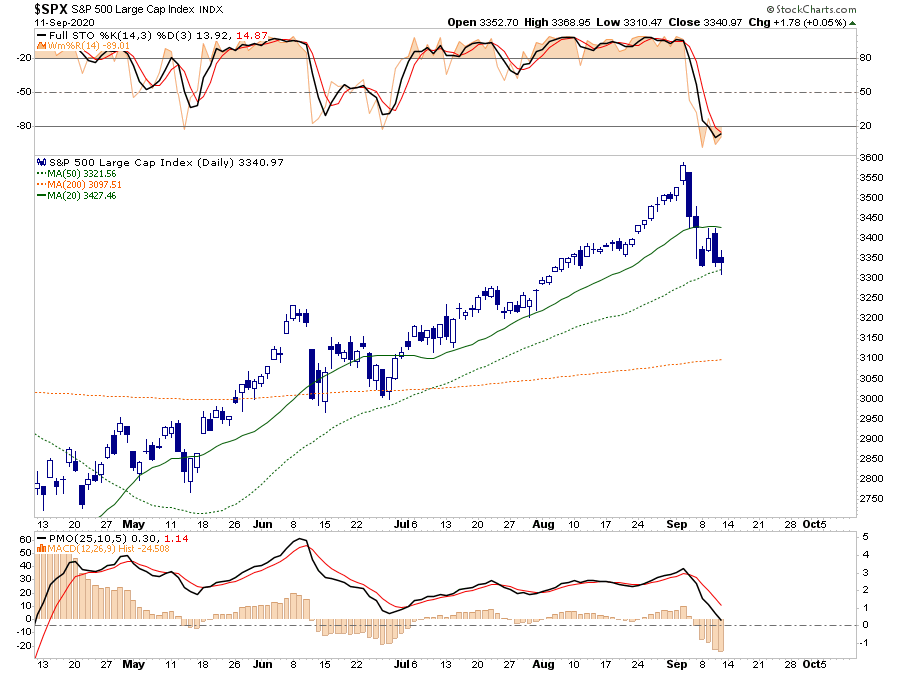
As shown in the chart below, we had suggested a correction back to previous market highs was likely but could extend to the 50-dma. So far, the correction has played out much as we anticipated.
However, while we expect a rally next week, due to the short-term oversold condition of the market, there is a downside risk to the 200-dma, which is another 5% lower from current levels. Such would entail a near 14% decline from the peak, which is well within the historical norms of corrections during any given year.

For now, the market remains trapped.

Trapped Between Resistance And Support
Thursday morning, I posted our 3-minutes video discussing the market’s failure at the 20-dma resistance.
(We publish “3-Minutes” Monday-Thursday. Click here to subscribe to our YouTube channel for email notification of all of our video postings and live-streams.)
https://www.youtube.com/watch?v=jODnfNLSt28
The chart below shows much of the same picture as above, but with a few more overlays. You can see the failure of the market at the 20-dma and the support at the 50-dma. What is essential are the upper and lower indicators.
- Both of the upper indicators are currently registering short-term oversold conditions, suggestive of at least a reflexive bounce next week.
- Conversely, both of the lower “sell signals” have been triggered, and as noted in the video, it suggests there is additional selling pressure on stocks currently.
As we note below in our “portfolio positioning” section, this suggests that over the next couple of weeks, investors should use rallies to reduce risk.
Speculators Get Even More Speculative
Another reason for our short-term concern is that you would typically expect a market decline to pull some of the “greed” out of the market. Such was not the case this time, and the drop did little to dent the “enthusiasm” of speculative options traders betting on a one-way ticket to wealth.
“Over the last three trading sessions, more than 1m Tesla calls traded a day, 50% above average over the last 20 days. Close to 2.5m Apple calls traded on average each day during the selloff, roughly double what’s been typical in the last 20 days.” – Bloomberg
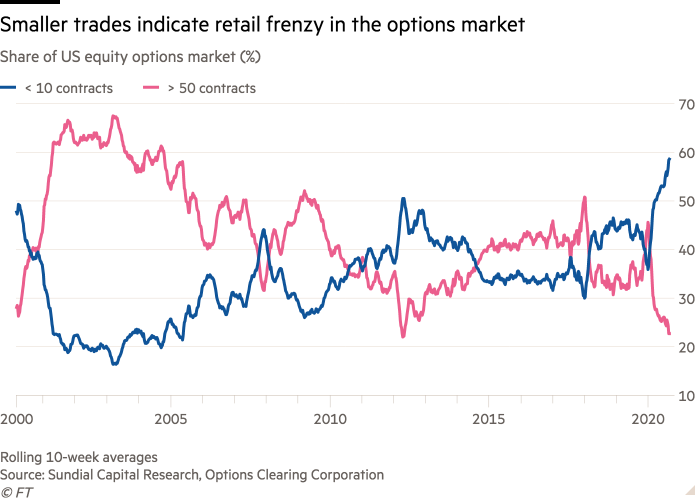
The chart below is the 10-day moving average of the “put/call” ratio. While the market peaked, speculators got even more “speculative” on “buying the dip.” Such is akin to doubling down in Las Vegas, it may work for a while, but eventually, the “house always wins.”

Let me be clear. In the very short-term, there is a high probability of a market bounce. That bounce should most likely be sold into as the longer-term dynamics remain overbought, extended, and deviated from norms.

Long-Term Market Remains Extremely Overbought
Such was a point I discussed with our RIAPRO Subscribers (30-day Risk-Free Trial) last week.
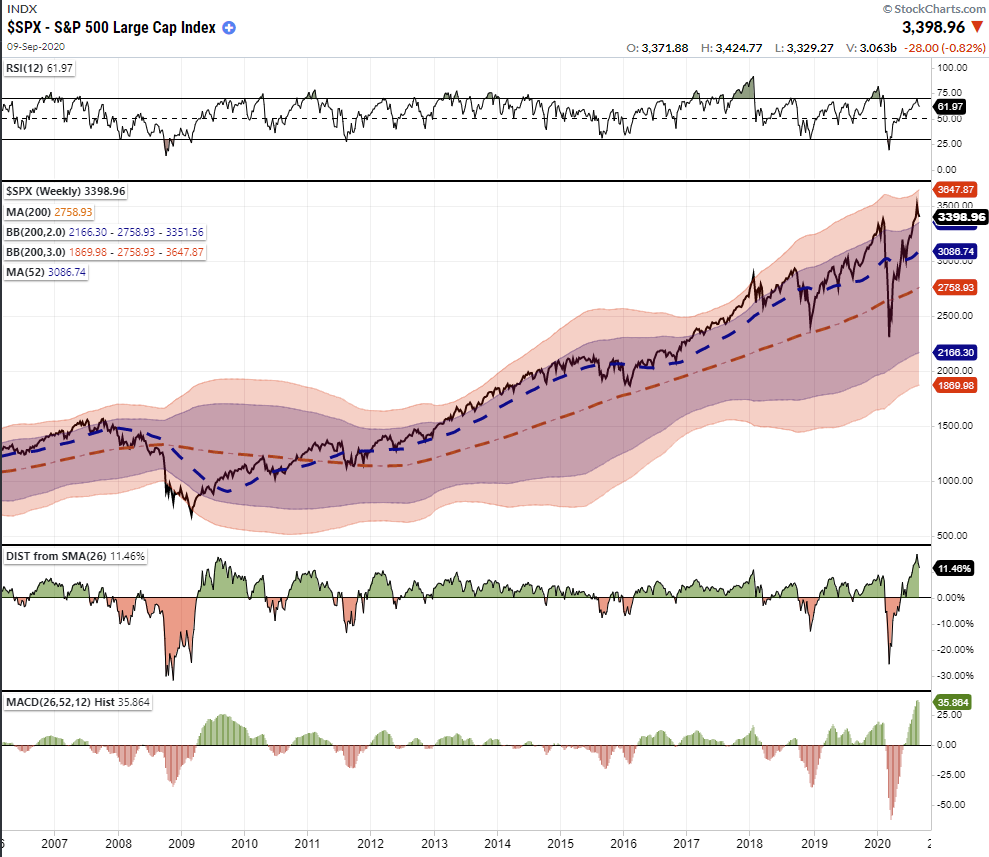
- On a weekly basis, the market backdrop remains much more bearish.
- The market is very extended, overbought, and deviated on an intermediate-term basis.
- The correction barely moved the needle of a market trading 3-standard deviations above the long-term moving average.
- Read “A Tale Of Two Bull Markets” for more explanation and detail on this and other relevant charts.
- Remain patient. The odds are high that more downside risk remains if the economy begins to show signs of weakening again.
With the potential for a disruptive political election, weakening economic data, and a failure to garner more stimulus for households, the risks to earnings and growth have increased.
On a longer-term basis, the technical backdrop is also problematic.
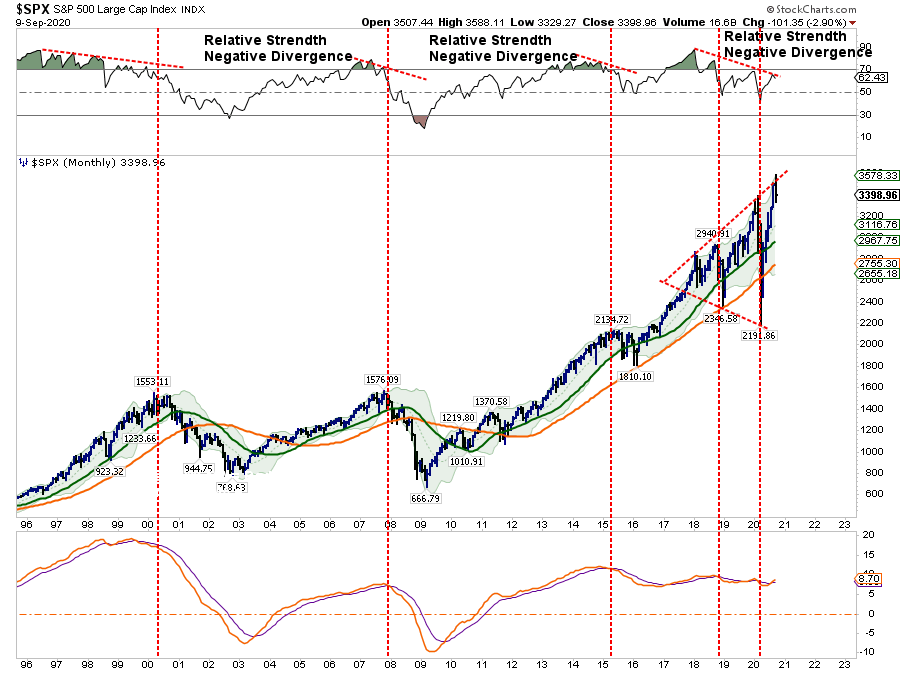
Monthly
- First, from an investment standpoint, look at the last two bull market advances compared to the current Central Bank fueled surge. The present extension failed at the top of the rising upper-trend line forming a “megaphone” pattern.
- This pattern is more indicative of a market topping process, rather than a continuation pattern.
- Secondly, the market is trading MORE THAN 2-standard deviations above the long-term mean, which was ideal for a more considerable corrective decline.
- The good news, however, is that a monthly BUY signal did get triggered with the liquidity fueled advance. Usually, these signals are slow to turn. However, in recent years these signals are becoming more frequent due to the increased volatility.
Importantly, MONTHLY data is ONLY valid at the end of the month. Therefore, these indicators are VERY SLOW to turn but do provide relevant analysis on price trends. However, this is why we use both Daily and Weekly charts to manage portfolio risk.
Portfolio Positioning
Over the last few week’s we have repeatedly discussed reducing risk, hedging, and rebalancing portfolios as we suspected this decline was a real possibility. As noted in “Tending The Garden:”
“Taking these actions has TWO specific benefits depending on what happens in the market next.
- If the market corrects, these actions clear out the “weeds” and allow for protection of capital against a subsequent decline.
- If the market continues to rally, then the portfolio has been cleaned up and new positions can be added to participate in the next leg of the advance.
No one knows for sure where markets are headed in the next week, much less the next month, quarter, year, or five years. What we do know is not managing ‘risk’ to hedge against a decline is more detrimental to the achievement of long-term investment goals.”
With the actions we have taken over the last few weeks, we now have some cash to deploy into assets that provide us our next opportunity.
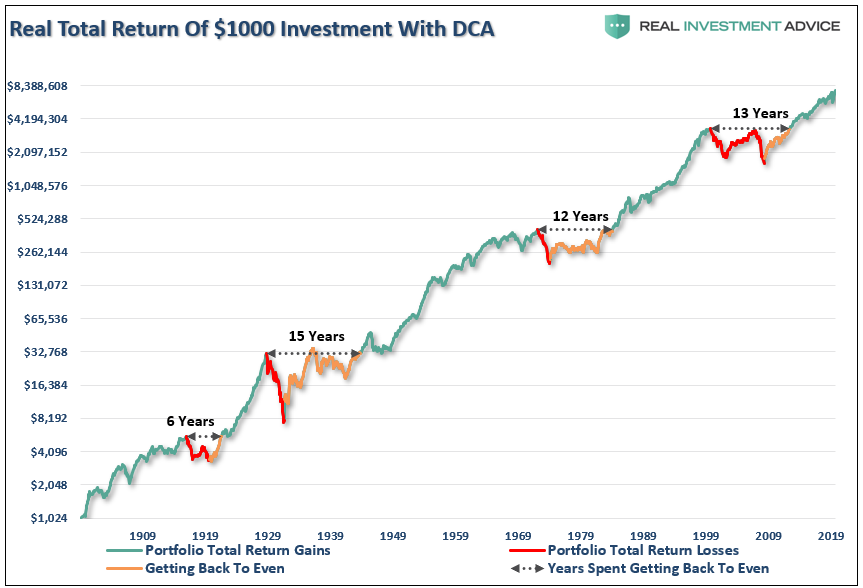
Getting Back To Even
Such is the primary problem with “buy and hold” investing.
Riding markets up and down is okay to a point, but eventually, the market will decline and provide a real opportunity to buy assets at discounted prices. Unfortunately, since a “buy and hold” strategy never raised any cash, there is nothing to buy discounted assets with. Yes, eventually, the market will recover its losses, and portfolios will return to even. However, you can never recover the time lost. (You also don’t have 100+ years to invest.)
Such is why the primary rule of every great investor throughout history is to “buy low and sell high.” While it seems simple, it is incredibly hard to do, particularly when emotions overtake logic.
Currently, the “speculative frenzy” has engulfed the markets and the media. Such can last a lot longer than most expect, but it will eventually end.
Sometimes, the best investment strategy is knowing when to stop. Remember, no rule states you can’t play again tomorrow after a hot meal and a good night’s sleep.

The MacroView
If you need help or have questions, we are always glad to help. Just email me.
See You Next Week
By Lance Roberts, CIO
Market & Sector Analysis
Data Analysis Of The Market & Sectors For Traders
Discover All You Are Missing At RIAPRO.NET
This is what our RIAPRO.NET subscribers are reading right now! Risk-Free For 30-Day Trial.
- Sector & Market Analysis
- Technical Gauge
- Sector Rotation Analysis (Risk/Reward Ranges)
- Portfolio Positioning
- Sector & Market Recommendations
- Client Portfolio Updates
- Live 401k Plan Manager

THE REAL 401k PLAN MANAGER
A Conservative Strategy For Long-Term Investors

If you need help after reading the alert, do not hesitate to contact me.
Model performance is a two-asset model of stocks and bonds relative to the weighting changes made each week in the newsletter. Such is strictly for informational and educational purposes only, and one should not rely on it for any reason. Past performance is not a guarantee of future results. Use at your own risk and peril.

401k Plan Manager Live Model
As an RIA PRO subscriber (You get your first 30-days free), you have access to our live 401k plan manager.
Compare your current 401k allocation to our recommendation for your company-specific plan as well as our on 401k model allocation.
You can also track performance, estimate future values based on your savings and expected returns, and dig down into your sector and market allocations.
If you would like to offer our service to your employees at a deeply discounted corporate rate, please contact me.


