
Inside This Week’s Bull Bear Report
- Bumpy Start To New Year
- Fighting The Fed
- How We Are Trading It
- Research Report – The Fed’s 7% Solution
- Youtube – Weekly Market Review With Adam Taggart
- Stock Of The Week
- Daily Commentary Bits
- Market Statistics
- Stock Screens
- Portfolio Trades This Week
The Pain Trade Is Higher
Interestingly, despite the Fed continuing to send warnings, “Fighting the Fed” has become the bull’s new mantra. From one economic report to the next, bullish investors continue to look for any reason to buy stocks in hopes the Fed will pivot soon. Such was the case this past week as the markets rallied again, heading into the much-anticipated inflation report.
However, before we dig further into that topic, a review of this week’s market action reveals some decidedly bullish developments but also some risks.
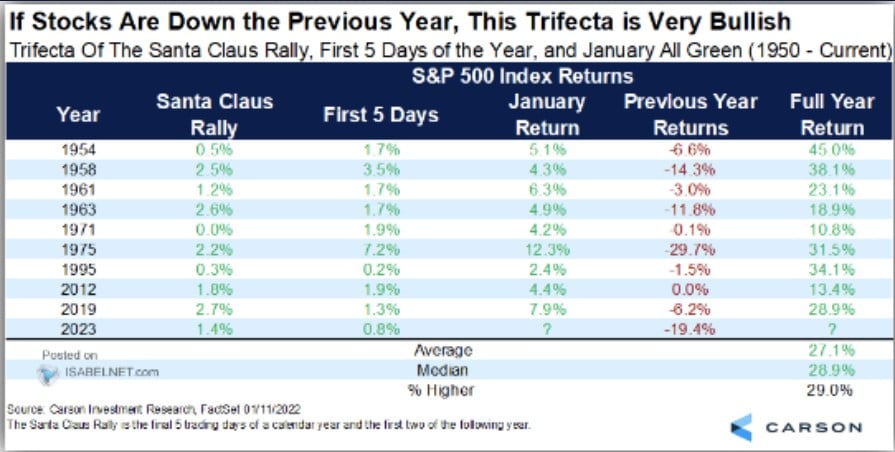
From the bullish side of the ledger, the outlook for 2023 has statistical support for a positive outcome. After having a negative year in 2022, the markets were visited by “Santa Claus,” although very late, and the first 5-days of January turned out to be a positive return. As the table below shows, there are only a few periods in history where this has occurred, and each yielded positive returns in the following year.
Furthermore, there is also a bullish pattern developing in the S&P 500. The market has recently established a higher low and potentially formed a “right shoulder” of an “inverse head-and-shoulders” technical pattern.
“An inverse head and shoulders, also called a “head and shoulders bottom”, is similar to the standard head and shoulders pattern, but inverted: with the head and shoulders top used to predict reversals in downtrends.
This pattern is identified when the price action of a security meets the following characteristics: the price falls to a trough and then rises; the price falls below the former trough and then rises again; finally, the price falls again but not as far as the second trough. Once the final trough is made, the price heads upward, toward the resistance found near the top of the previous troughs.” – Investopedia
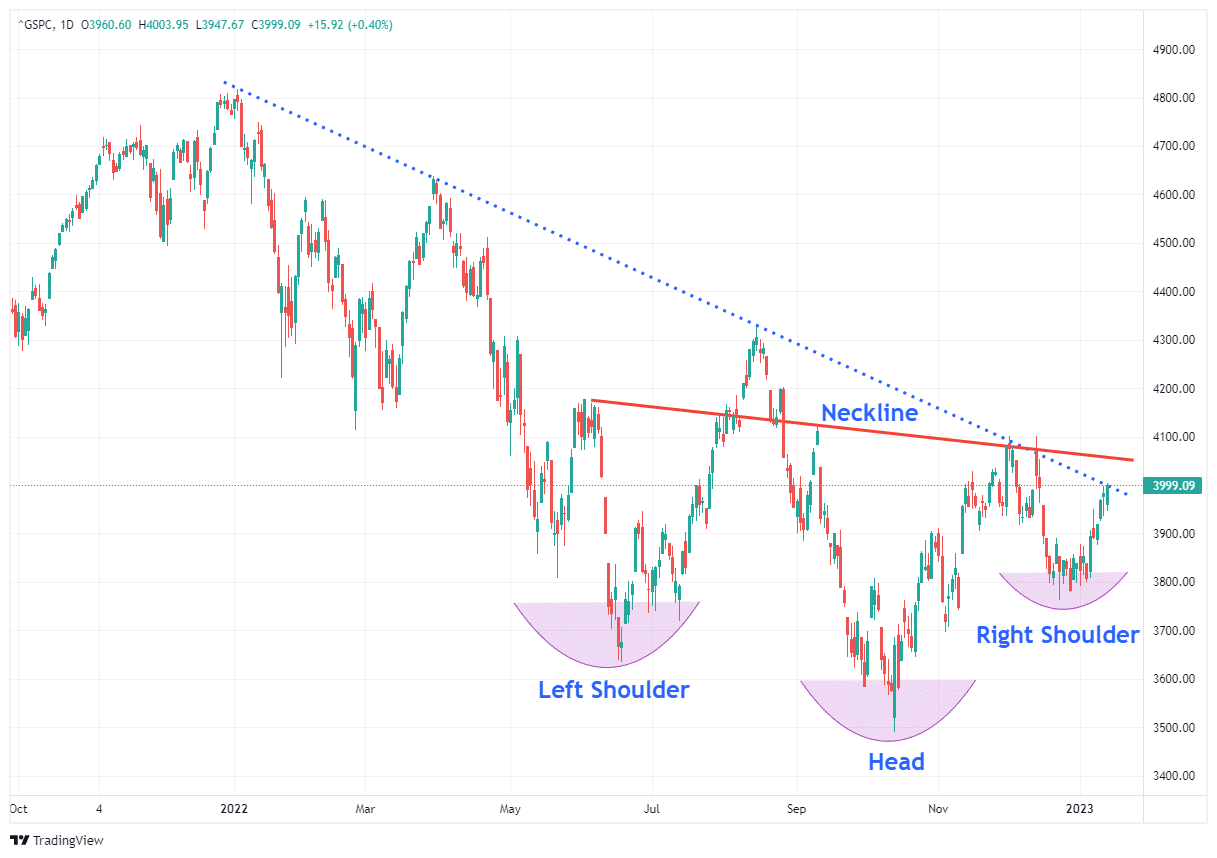
Bullish Technicals
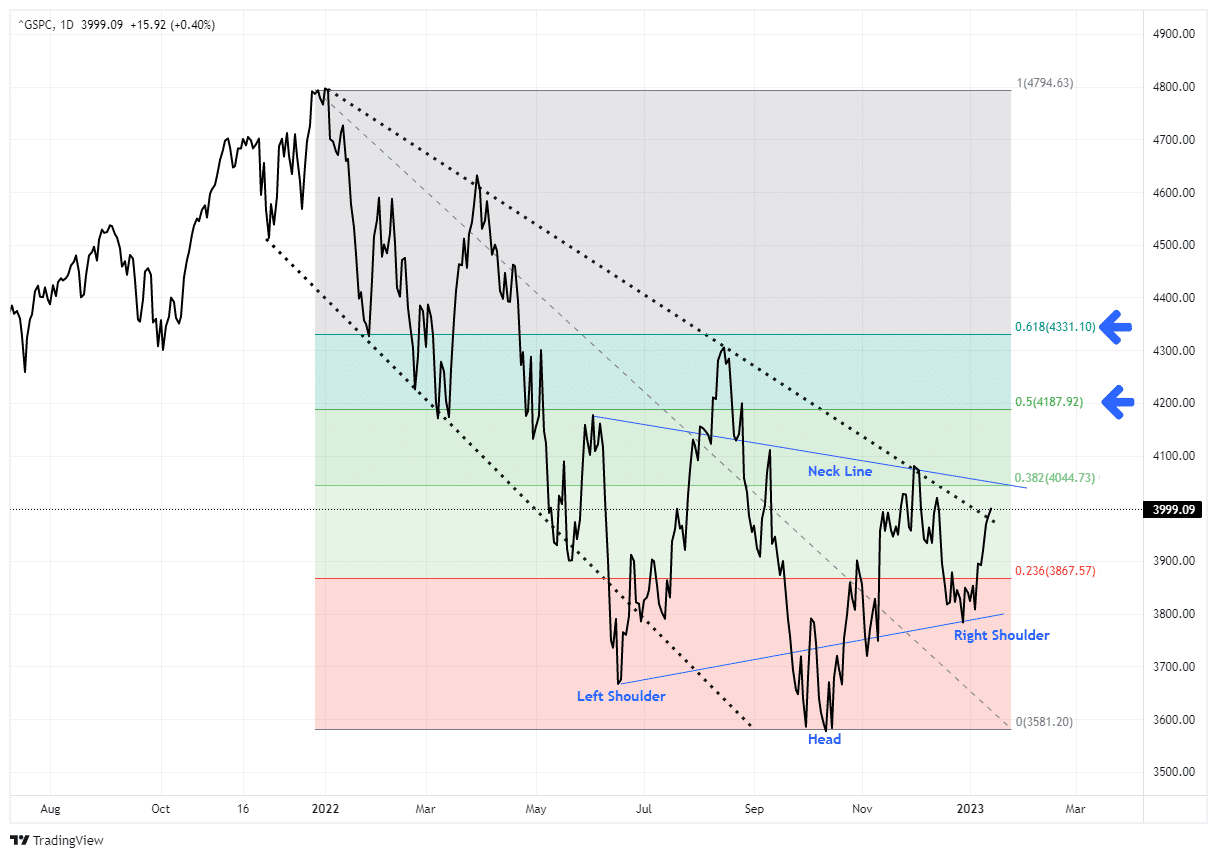
With the market approaching the downtrend line from last year’s peak, and as shown below, a higher low and tightening consolidation suggests a higher move is possible. While the market is short-term overbought, the MACD buy signal continues to suggest the “pain trade” is higher for now.

Importantly, this is just an improving technical picture for the market short-term. The breakouts have not happened yet, and may not. However, given the technical improvement, a break above the downtrend and the 200-DMA will set targets between 4200 (50% retracement) and 4360 (61.8% retracement) of last year’s decline.
While the current “pain trade” appears to be higher, there are still many risks to the market. Such is especially the case as we head into earnings season and the next Fed meeting. Therefore, it is important to remain cautious until the markets declare themselves. We remain overweight in cash, and our bond duration remains short of our benchmark index. However, we will adjust our holdings accordingly if these technical patterns mature.
The challenge we have with the market “Fighting the Fed” is that historically such has not worked out well.
Need Help With Your Investing Strategy?
Are you looking for complete financial, insurance, and estate planning? Need a risk-managed portfolio management strategy to grow and protect your savings? Whatever your needs are, we are here to help.

The Bull’s New Mantra Of “Fighting The Fed”
“’Don’t Fight The Fed.’ That mantra has remained a ‘call to arms’ of the financial markets and media ‘bullish tribes’ over the last decade.
With zero interest rate policy and the most aggressive monetary campaign in history, investors elevated the financial markets to heights rarely seen in human history. Yet, despite record valuations, pandemics, warnings, and inflationary pressures, the ‘animal spirit’ fostered by an undeniable ‘faith in the Federal Reserve’ remains alive and well.
Over the last decade, the primary bullish argument for owning stocks is that low-interest rates support high valuations.
The assumption is that the present value of future cash flows from equities rises, and so should their valuation. Assuming all else is equal, a falling discount rate does suggest a higher valuation. That is basic math and supported the manta of NOT “fighting the Fed.”
However, that discount rate has risen sharply in the last year, And, in an interesting twist, the bulls have started “fighting the Fed,” hoping for a “pivot” in monetary policy. The argument now is that valuations have corrected enough, and the economy is heading towards a “soft landing,” suggesting the “earnings” decline is near its end. In fact, the number of articles discussing a “soft landing” has recently surged.

Here is an example.
“David Kelly, chief global strategist at JPMorgan Asset Management, is betting that inflation will continue to ease in 2023, helping the US economy to narrowly escape a recession. Ed Yardeni, the longtime stock strategist and founder of his namesake research firm, is putting the odds of a soft landing at 60% based on strong economic data, resilient consumers and signs of tumbling price pressures.” – Bloomberg
The problem for the bulls is simple:
“You can’t have it both ways.”
The Fed’s Problem
As we discussed last week, there is a conflict with the bulls fighting the Fed.
“Higher asset prices represent looser, not tighter, monetary policy. Rising asset prices boost consumer confidence and act to ease the very financial conditions the Fed is trying to tighten. While financial conditions have tightened recently between higher interest rates and surging inflation, they remain low. Such is hardly the environment desired by the Fed to quell inflation.”
The latest FOMC minutes reiterated that point.
“Participants noted that, because monetary policy worked importantly through financial markets, an unwarranted easing in financial conditions, especially if driven by a misperception by the public of the Committee’s reaction function, would complicate the Committee’s effort to restore price stability.”
The chart below shows the financial conditions index, which is doing the opposite of what the Fed wants. The FOMC wants a “controlled burn” of asset prices lower, not higher. I would suspect that at some point, market participants will realize that the FOMC is serious about its mission.

While the bulls are fighting the Fed currently, the risk of something breaking continues to increase. In the short term, the economy and the markets (due to the current momentum) can DEFY the laws of financial gravity. However, as interest rates increase, they act as a “brake” on economic activity. Such is because higher rates NEGATIVELY impact a highly levered economy.
The chart below of the spread between the Fed Funds rate and the 10-year Treasury rate shows the risk. The analysis is a “yield curve” inversion. When the Fed funds rate is above the 10-year yield, such has preceded a bear market, recession, and/or a financial event. Currently, that spread, or inversion, is the highest since 1980.

Does this mean a crisis or some event MUST happen? No.
However, historically, such has not been the case.
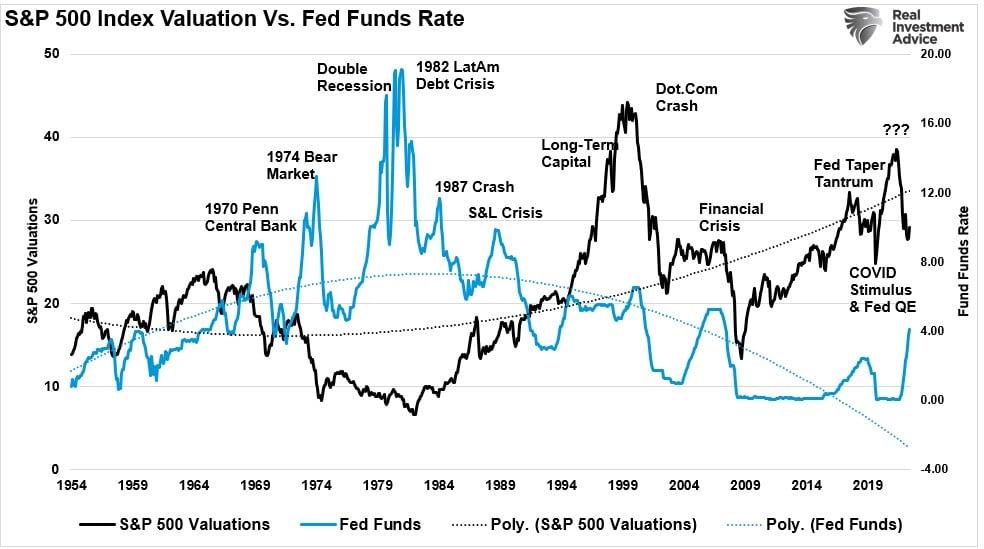
Valuations Remain An Issue
When the Fed previously tightened monetary policy into a high valuation environment, there was a higher degree of price reversion. For example, beginning in 1960, with valuations over 20x earnings, the Fed started a long-term rate-hiking campaign that resulted in three bear markets, two recessions, and a debt crisis. The following three times when the Fed hiked rates with valuations above 20x, outcomes ranged from bear markets to some credit crisis needing bailouts.
While “fighting the Fed” may seem a bit illogical, given the previous evidence of poor outcomes, it is nonetheless a possibility the bulls could be right this time.
However, given that bull markets loosen financial conditions, working against the Fed’s goals, I would not be surprised by hawkish comments from Jerome Powell at the February FOMC meeting. Such would be reminiscent of Powell’s speech following the Jackson Hole Summit last September and remarks from the December FOMC meeting.
Both of those periods ended with decent market corrections.
No Reason To Cut Rates
“We do not want to overtighten because we think cutting rates is not something we want to do soon, but if financial conditions ease because markets price in such cuts, a peak policy rate of 5.25% may NOT be sufficient to put inflation on a path to return to 2% over time.” – Richard Clarida
The bulls are “fighting the Fed,” hoping for a return to monetary easing. In other words, they want a policy reversal to monetary accommodation through lower interest rates and a return to Quantitative Easing. Mr. Clarida’s comment is not what the bulls want to hear. It is also the message that Jerome Powell has repeatedly tried to deliver this year each time the market rallied in hopes of a “pivot.”
The “soft landing” scenario is problematic for the bulls. If the economy does have a “soft landing,” then the Fed will hold interest rates at the terminal level and continue reducing its balance sheet. Such is because if the economy successfully absorbs tighter monetary policy, inflation is falling to target levels, and the stock market is rising, there is NO REASON to cut rates or engage in Quantitative Easing.
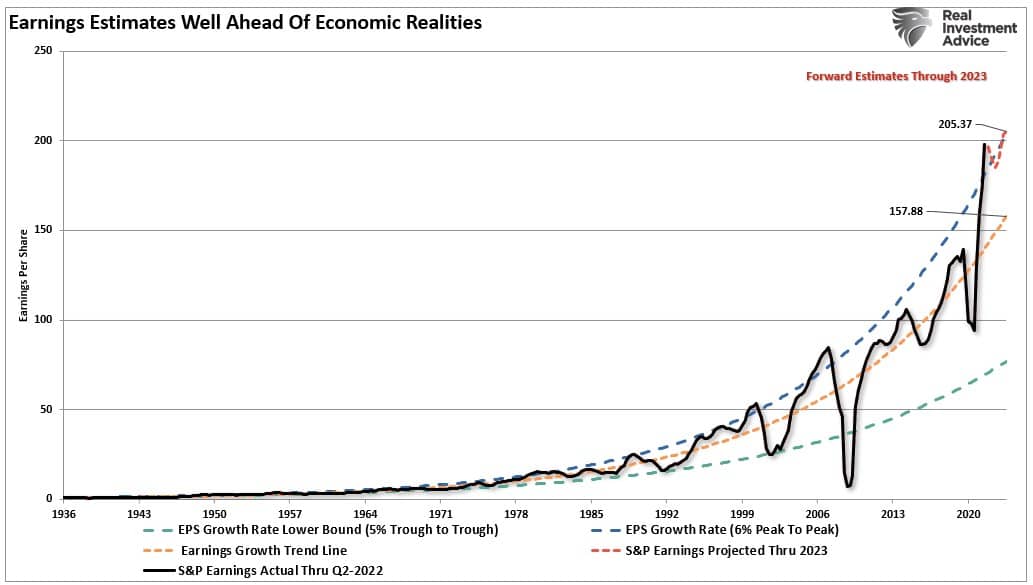
Should such turn out to be the case, it would still seem that earnings, and profit margins, will continue to get pressured between high borrowing costs and inflation, still suggesting downside risk to asset prices. Such is the problem with current earnings estimates, which remain deviated above their long-term 6% annualized growth trend.
Instead, the Fed would most likely welcome such an outcome of a “controlled burn” lower in asset prices, a reversion of valuations, and a stable but slow economy. Such would allow the Fed ample operating room to reset its monetary policy tools for the next economic downturn. Therefore, the ONLY reason the Fed will pivot concerning the monetary policy to an easing regime is if something breaks economically or financially.
As we will discuss next, we are adding exposure to portfolios due to the bullish technical underpinnings. However, we remain cautious as the Fed will likely not pivot soon.
Not Getting The Bull Bear Report Each Week In Your Mailbox? Subscribe Here For Free.
How We Are Trading It
As noted last week:
“As the New Year begins, we enter the year with a substantially underweight equity position, a bond sleeve that is primarily short-duration, and a very heavy overweighting of cash. The problem with this allocation is that we will underperform if the market rallies substantially. Therefore, we plan to remain nimble and utilize our liquidity to trade markets from more extreme overbought or oversold positions.”
We did add some equity exposure this past week by adding back some of our energy positions we sold near recent peaks and a trading position in the S&P 500 equal weight index. (Read the Daily Commentary Bits below for the rationale.) We are also contemplating an increase in the duration of our bond portfolio following the most recent CPI report. The spread now between Treasury bonds, and the 3-month rate of inflation has now become extremely attractive. As we noted previously, there is a rising probability that bonds will outperform stocks in 2023. Such will result from disinflation becoming a deflationary (read: recessionary) environment.
“The most likely outcome of the Fed’s most aggressive monetary campaign in history is a recession. Such would lead to an immediate policy reversal. Crucially, the Fed controls the short end of the curve, but the economy and inflation control the long end. Therefore, as the recession takes hold, interest rates will decline on the long end of the curve. However, such will lead to a deeper reversion in yields until something “breaks.“ Only then will the Federal Reserve begin to cut rates.”
From an allocation standpoint, we remain underweight in stocks and bonds and overweight cash and short-term Treasuries. (The ETF allocation comprises short-duration Treasury bonds and floating rate Treasuries, with a lesser allocation to long-dated Treasuries. You can view our models in real-time at SimpleVisor.com)
While this market rally could have some legs, we suspect it is not THE return of the bull market yet. As such, continue working to rebalance portfolios for now.
- Tighten up stop-loss levels to current support levels for each position.
- Hedge portfolios against significant market declines.
- Take profits in positions that have been big winners
- Sell laggards and losers.
- Raise cash and rebalance portfolios to target weightings.
See you next week.
Research Report

Subscribe To “Before The Bell” For Daily Trading Updates (Formerly 3-Minutes)
We have set up a separate channel JUST for our short daily market updates. Be sure and subscribe to THIS CHANNEL to receive daily notifications before the market opens.
Click Here And Then Click The SUBSCRIBE Button
Subscribe To Our Youtube Channel To Get Notified Of All Our Videos
Stock Of The Week In Review
A theme we have been focusing on for 2023 revolves around high-dividend stocks trading at attractive valuations. This theme outperformed the broad market last year as investors sought safety to ride out the volatility spurred by the Fed’s fight against inflation. We expect the outperformance to continue into 2023 as the lag effect of prior rate hikes catches up with the economy.
In an environment ripe for an economic slowdown and where raising funds in capital markets is costly, cash flows become a critical investment factor. Earnings (EPS) reported by companies typically differ from actual cash flows due to accrual-based accounting standards. Most investors tend to focus on earnings; however, cash flows determine the amount of capital available to be reinvested or returned to investors. Such is why we screen on Free Cash Flow Yield in this screen in lieu of more typical valuation ratios.
Here is a link to the full SimpleVisor Article For Step-By-Step Screening Instructions.
Here is one of the companies we screened.
Verizon Communications (VZ)

Login to Simplevisor.com to read the full 5-For-Friday report.
Daily Commentary Bits
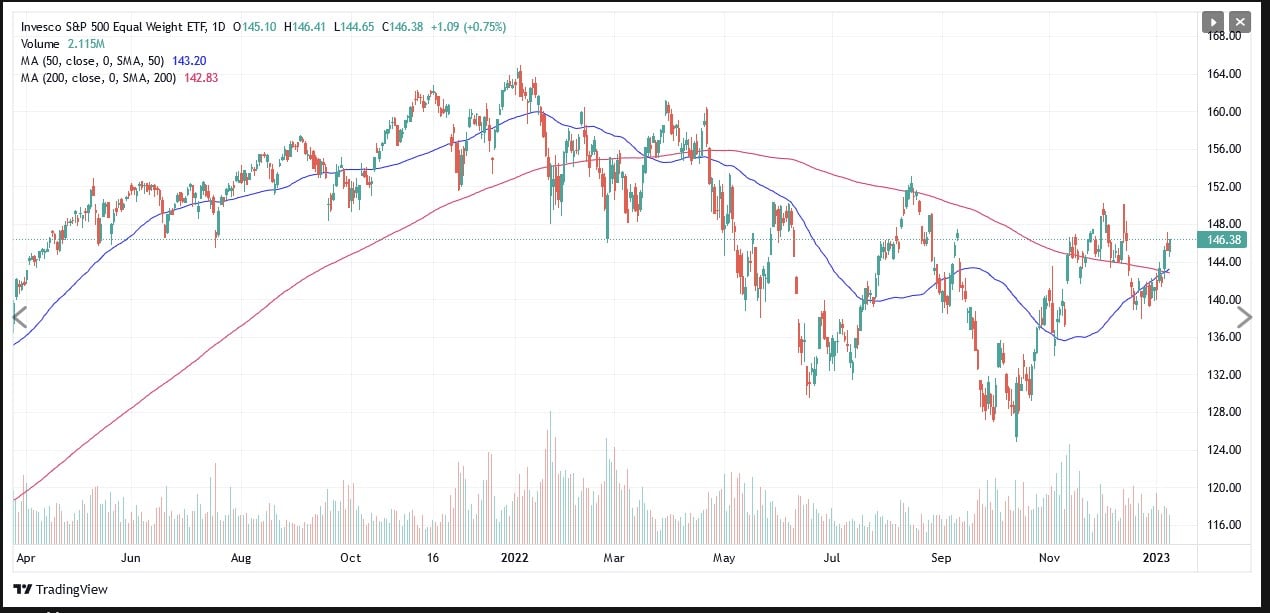
A Golden Cross Promises More Upside
A golden cross occurs when a shorter moving average crosses above a longer moving average. Conversely, a death cross occurs when a shorter moving average falls below a longer moving average. The graph below shows the equal-weighted S&P 500 just experienced a golden cross with the key 50 and 200-day moving averages crossing. The equal-weighted index is not a primary, well-followed index. However, its recent golden cross is a positive sign that the broader market’s breadth is improving. In contrast, the 200- day moving average on the S&P 500 is still 100 points above its 50-day moving average. The S&P 500 must continue to rally for a while to see a golden cross.
Since 1970, the S&P 500 has been returning about 15% gains on average in less than a year after a golden cross’ occurrence. However, golden crosses can result in a false breakout and quickly turn into a death cross. Therefore, one should consider the golden cross pattern but use it alongside other technical indicators for the best results. Additionally, the golden cross may indeed portend a good rally in the coming month or two, but as we saw on three occasions in 2022, double-digit rallies were followed by lower lows.
Click Here To Read The Latest Daily Market Commentary (Subscribe For Pre-Market Email)
Bull Bear Report Market Statistics & Screens

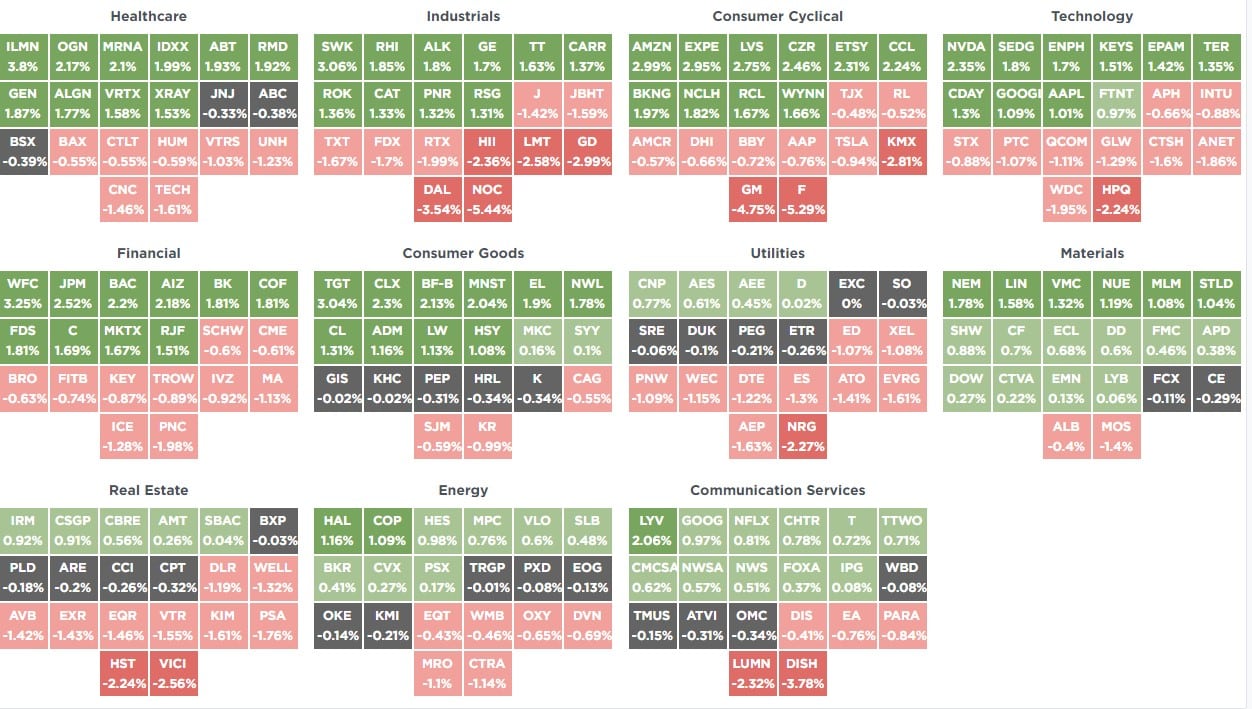
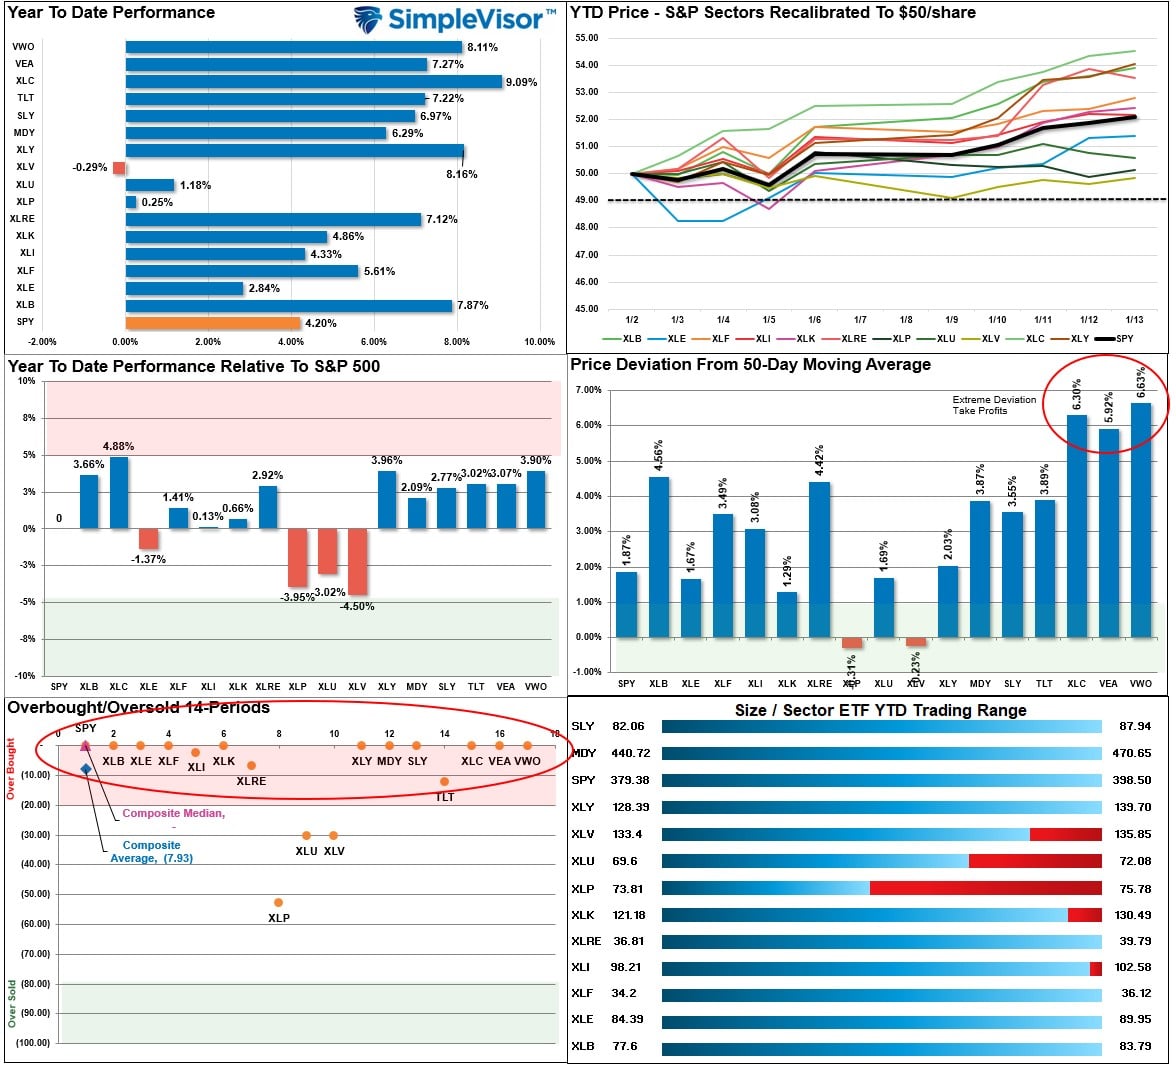
SimpleVisor Top & Bottom Performers By Sector
S&P 500 Tear Sheet

Relative Performance Analysis
The rally continued this past week as investors have again started chasing the “pivot” from the Fed. As noted, Communications, International, and Emerging Markets are significantly deviated from their 50-DMA and are due for a pullback. Look for a rotation to some of the underperforming sectors short-term. Furthermore, the market is exceptionally overbought short-term so expect some profit-taking next week and a bit more sloppy trading action. With earnings kicking off this week, and the Fed coming up, who will likely talk down the market, be cautious about taking on too much exposure now.
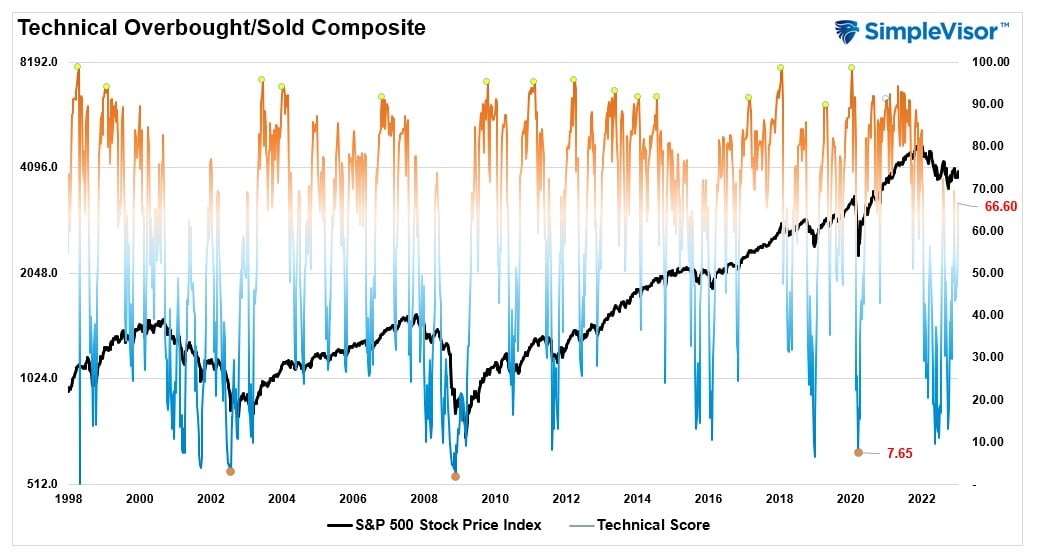
Technical Composite
The technical overbought/sold gauge comprises several price indicators (RSI, Williams %R, etc.), measured using “weekly” closing price data. Readings above “80” are considered overbought, and below “20” are oversold. Markets tend to peak when those readings are at 80 or above, which suggests profit-taking and risk management are prudent. The best buying opportunities exist when those readings are 20 or below.
The current reading is 66.6 out of a possible 100 and rising. Remain long equities for now.
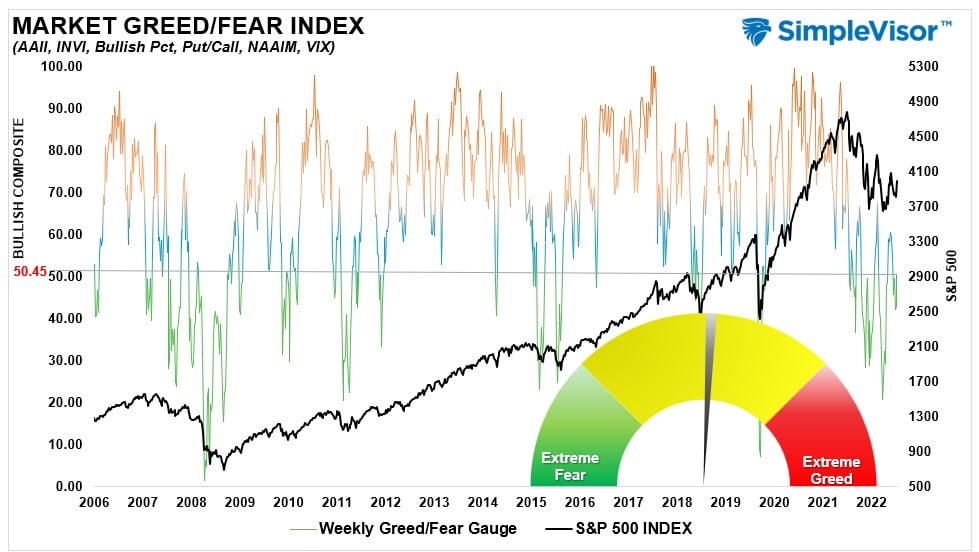
Portfolio Positioning “Fear / Greed” Gauge
The “Fear/Greed” Gauge is how individual and professional investors are “positioning” themselves in the market based on their equity exposure. From a contrarian position, the higher the allocation to equities, the more likely the market is closer to a correction than not. The gauge uses weekly closing data.
NOTE: The Fear/Greed Index measures risk from 0 to 100. It is a rarity that it reaches levels above 90. The current reading is 50.45 out of a possible 100.
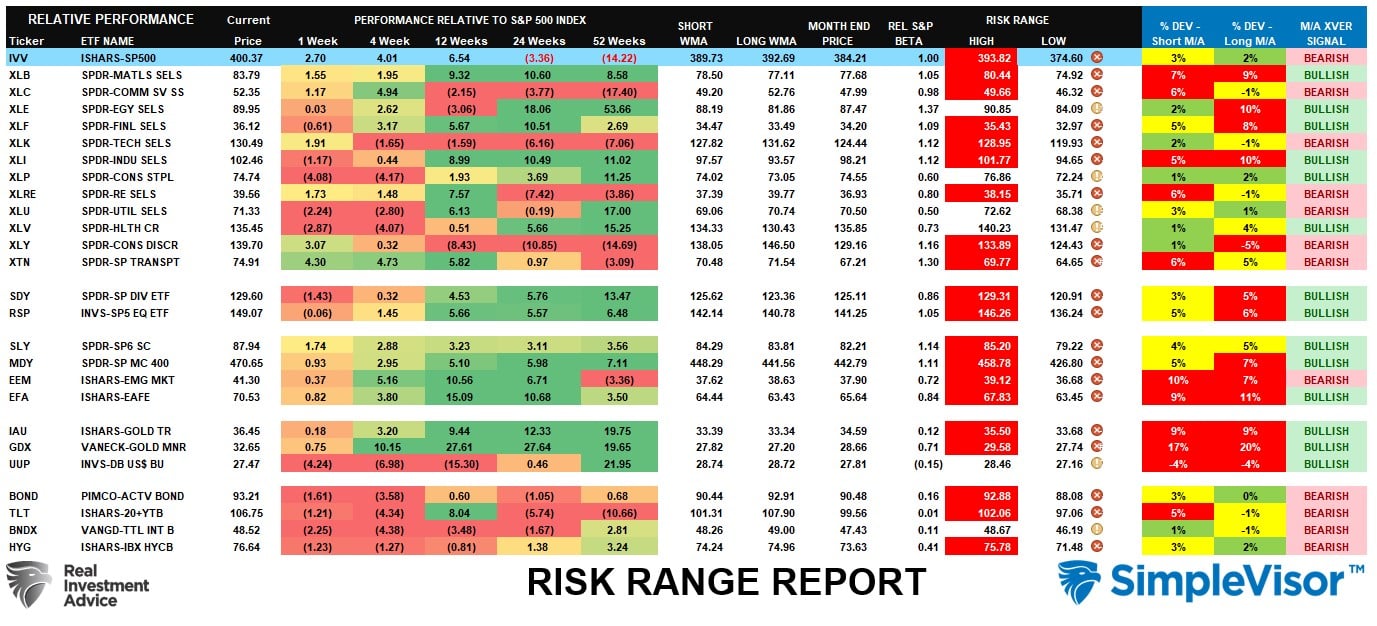
Sector Model Analysis & Risk Ranges
How To Read This Table
- The table compares the relative performance of each sector and market to the S&P 500 index.
- “M” XVER” “Moving Average Cross Over) is determined by the short-term weekly moving average crossing positively or negatively with the long-term weekly moving average.
- The risk range is a function of the month-end closing price and the “beta” of the sector or market. (Ranges reset on the 1st of each month)
- The table shows the price deviation above and below the weekly moving averages.
As noted last week, “the market kicked off the New Year with a rally, and the “first 5 days” suggest the bulls are in charge for now.” That winning streak continued this past week. However, almost every sector and market is now well outside their monthly historical trading ranges. Look for some profit-taking next week as earnings season kicks off. However, the good news is that the bear market of 2022 is likely behind us as a majority of sectors and markets have flipped their weekly moving average crosses back into bullish territory. The “pain trade” this year will likely be higher.
Weekly SimpleVisor Stock Screens
Each week we will provide three different stock screens generated from SimpleVisor: (RIAPro.net subscribers use your current credentials to log in.)
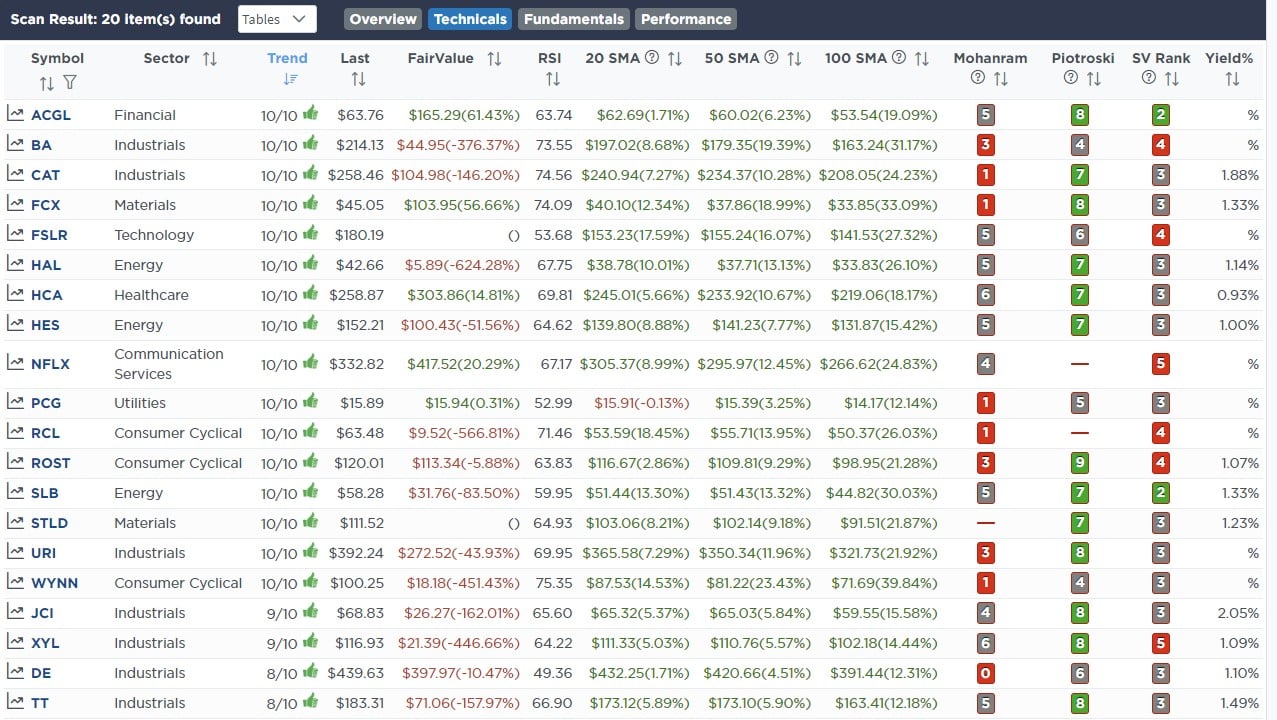
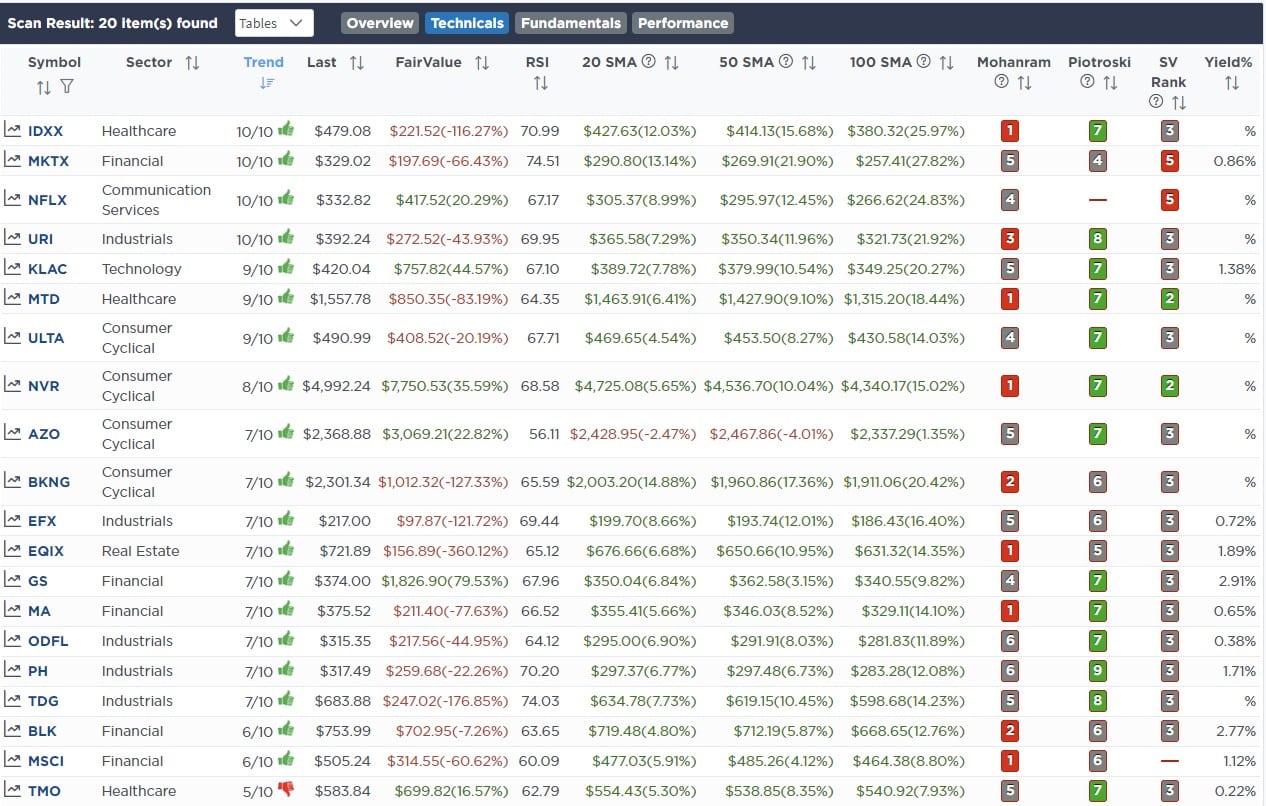
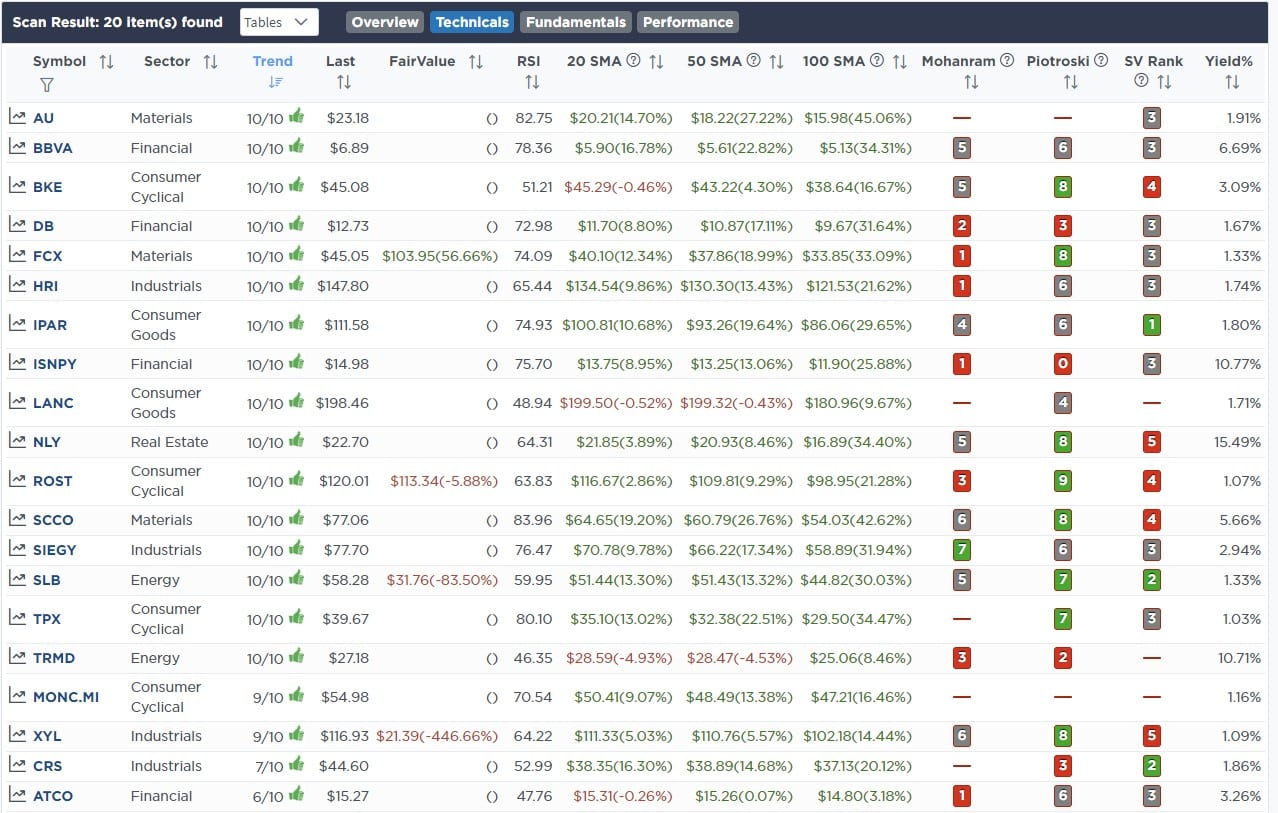
This week we are scanning for the Top 20:
- Relative Strength Stocks
- Momentum Stocks
- Highest Rated Stocks With Dividends
These screens generate portfolio ideas and serve as the starting point for further research.
(Click Images To Enlarge)
RSI Screen
Momentum Screen
Highest Rated Stocks With Dividends
SimpleVisor Portfolio Changes
We post all of our portfolio changes as they occur at SimpleVisor:
January 9th
We are starting to rebalance our account models for the New Year. We are bringing Public Storage up to model weight in the equity model. In the ETF model, we are rebalancing our Lithium ETF (LIT) to model weight and adding to the S&P 500 Value ETF (VYM).
With the market improving to start the new year, we will look to add equity exposure after Jerome Powell’s speech tomorrow.
Equity Model
- Bring PSA to 1.5% of the total portfolio value.
ETF Model
- Increase LIT to 2% of the total portfolio weight.
- Add to VYM and increase the weight to 4% of the total portfolio.
January 10th
Last year we sold all of our energy stocks near the peak as they were extremely overbought a deviated from underlying moving averages. We were waiting on a correction to begin rebuilding those positions, which we started today. We are adding 1% of Devon Energy (DVN) to the Equity Model and 1% of the SPDR Energy ETF (XLE) to the ETF Model. We will look for additional weaknesses to increase those positions with a stop at recent lows.
Equity Model
- Initiate a 1% position in the portfolio of Devon Energy (DVN)
ETF Model
- Add 1% of the portfolio to the SPDR Energy Sector ETF (XLE)
January 11th
“This morning we added 5% of the equal-weighted S&P 500 (RSP) to both models. We remain well below our benchmark weighting, and technicals are turning more favorable for a near-term market rally. Further, RSP just had a golden cross (50dma>200dma). We will write this up in tomorrow’s commentary. We also added 1% of Goldman Sachs (GS) to the equity model ahead of upcoming earnings.”
Equity Model:
- Initiate a 5% trading position of S&P 500 Equal Weight ETF (RSP) to the portfolio
- Add 1% to Goldman Sachs (GS), bringing position weight to 2%.
- Sell 2% of the 1-3 Month Treasury Bill ETF (BIL) to raise cash for purchases.
ETF Model
- Initiate a 5% trading position of S&P 500 Equal Weight ETF (RSP) to the portfolio
- Sell 2% of the 1-3 Month Treasury Bill ETF (BIL) to raise cash for purchases.

Lance Roberts, CIO
Have a great week!

