Market Regains Footing On Hopes Of More Stimulus 10-09-20


In this issue of “Market Regains Footing On Hopes Of More Stimulus.”
- Hopes For More Stimulus
- Market Regains Its Footing
- Policies Over Politics
- Portfolio Positioning Update
- MacroView: The Second Derivative Of More Stimulus
- Sector & Market Analysis
- 401k Plan Manager
Follow Us On: Twitter, Facebook, Linked-In, Sound Cloud, Seeking Alpha
The Pre-Election Event
“Policies, Not Politics.”
Join Richard Rosso, CFP, and Danny Ratliff, CFP, for an in-depth look at both party’s platforms and how upcoming changes could affect your retirement, social security, medicare, and how you invest. From taxes to the markets, they will provide the answers you are looking for.
- When: Saturday, October 24th, 2020
- Time: 8-9am
- Where: An exclusive GoTo Webinar Event (Register Now)

Catch Up On What You Missed Last Week 

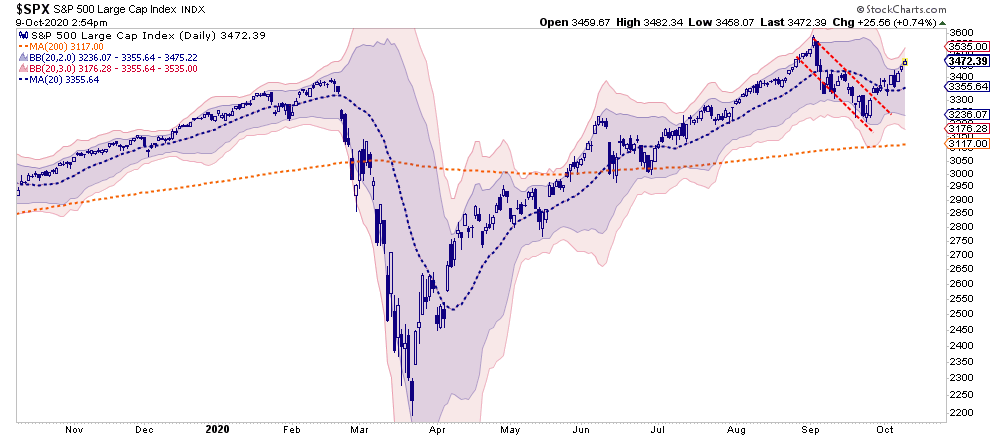
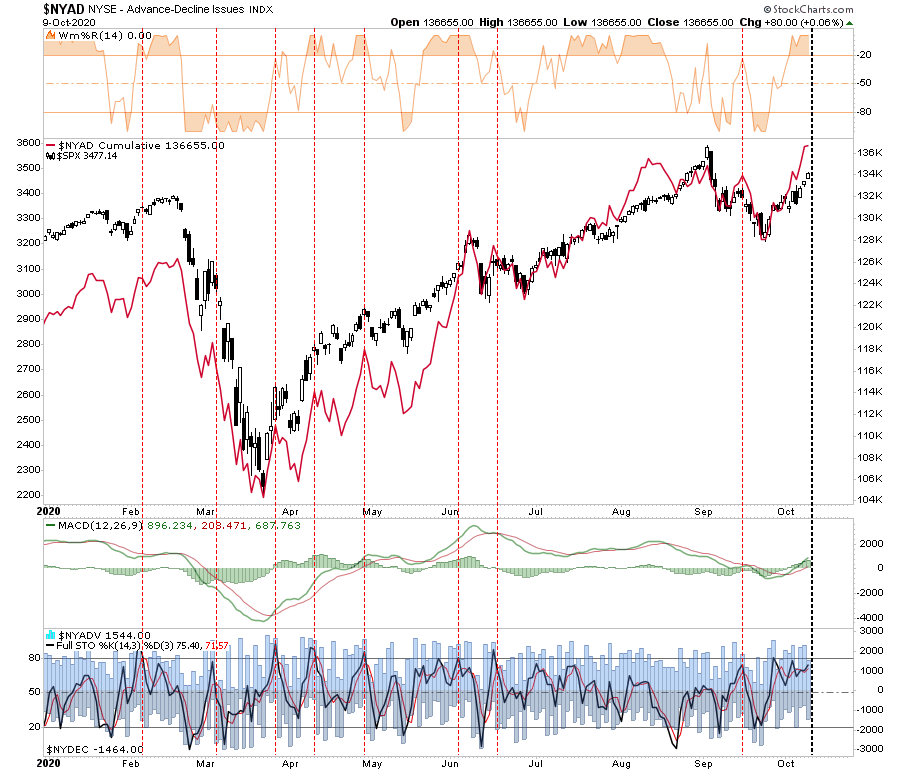
Market Regains Its Footing
“Live by the sword, die by the sword.” – Matthew 26, 26:52
Such was the lesson quickly retaught to President Trump when we decided to halt stimulus talks on Tuesday, sending the market careening into the red. By Wednesday, Trump quickly reversed and has been talking up more stimulus all week.
Covid Relief Negotiations are moving along. Go Big!
— Donald J. Trump (@realDonaldTrump) October 9, 2020
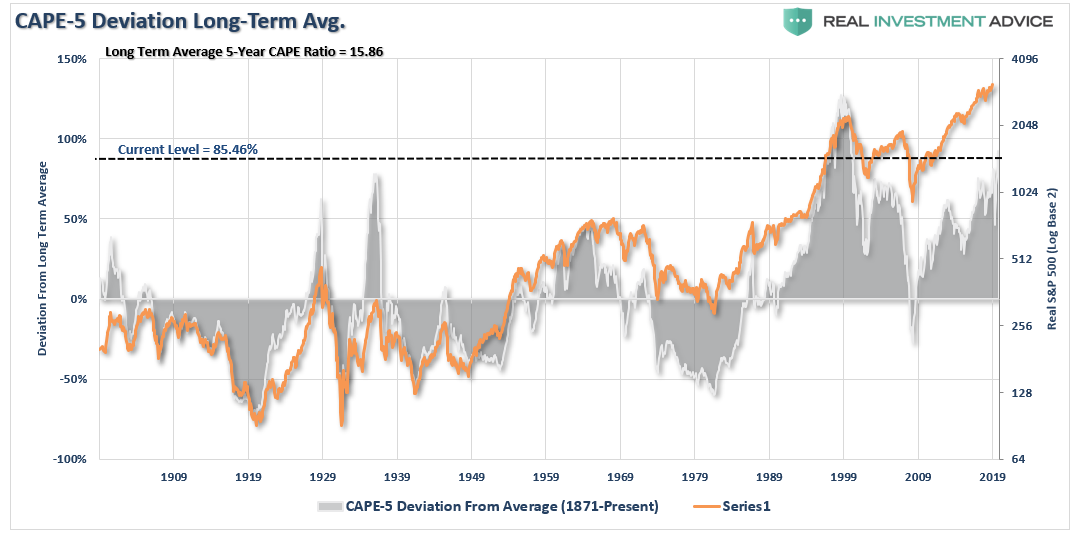
The inherent problem of tying your Presidency to the stock market is that it’s all fine until it isn’t. The market crash in December of 2018, and again in March 2020, should have been a wakeup call. Unfortunately, it wasn’t, and now valuations, deviations for long-term means, and speculation have increased risk significantly.
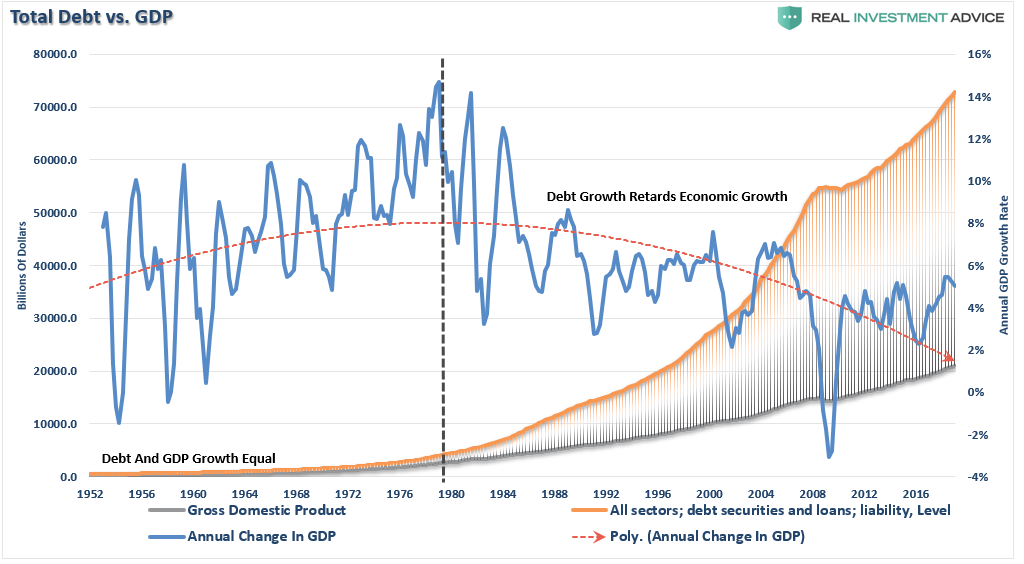
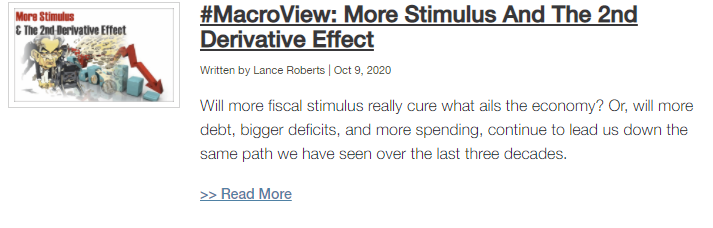
Also, while more stimulus may be a great short-term “fix” for the economy, and ultimately the market when the Federal Reserve monetized the debt issuance, as discussed in this week’s #MacroView:
“More debt doesn’t lead to stronger rates of economic growth or prosperity. Since 1980, the overall increase in debt has surged to levels that currently usurp the entirety of economic growth. With economic growth rates now at the lowest levels on record, the change in debt continues to divert more tax dollars away from productive investments into the service of debt and social welfare.”
Nonetheless, the market rallied on what is for now “hope” of more stimulus. There is still no deal on Capitol Hill, and the parties are still far apart primarily on funding for states and municipalities.
Market Regains Its Footing
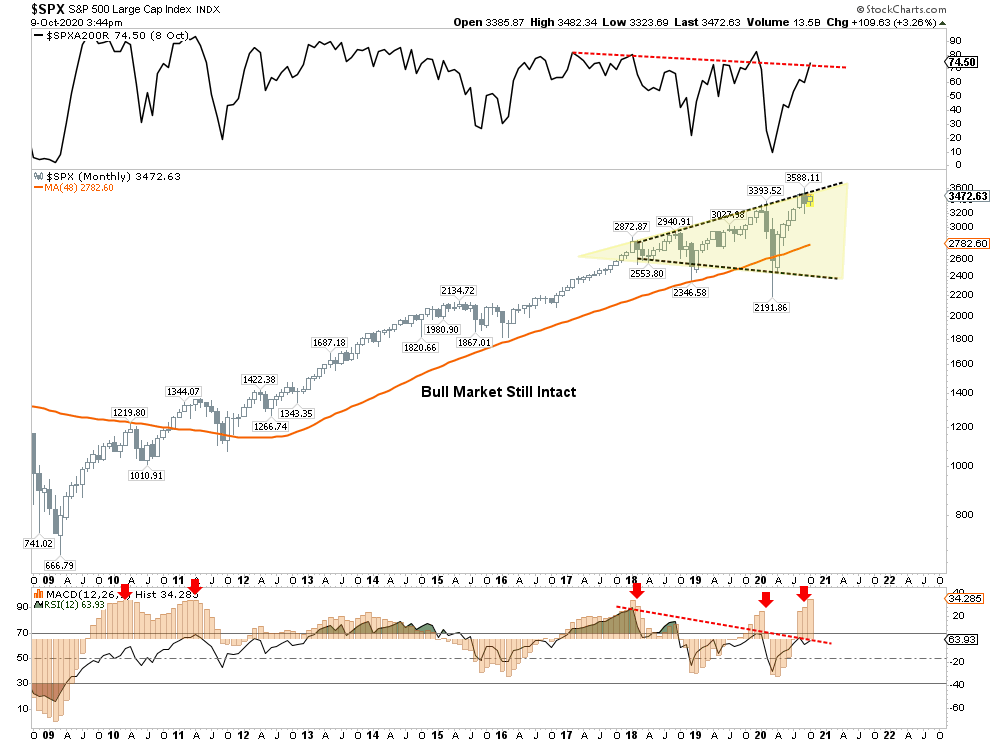
As I penned last week, we were expecting a rally this week.
“Notably, while the rally that we have witnessed from the recent lows has eaten up a fair bit of the previous oversold condition, the MACD “buy signal” was triggered on Friday. Such suggests that we could see some additional buying next week.”
The market did indeed rally out of the gate on Monday but was cut short on Tuesday by Trump’s tweet shutting down stimulus talks. However, his quick retraction put the market back on more solid footing short-term.
Again, the Federal Reserve needs “more stimulus” to monetize the underlying debt issuance for investors. Such is how, ultimately, liquidity gets into the markets. With markets only about 3% away from all-time highs, there is really nothing to stop it from getting there unless stimulus talks break down once again.
Speculation Ramps Up
Retail investors have also ramped up speculative bets again, pushing the Put/Call ratio back towards previous highs. There is still room before getting back to previous levels, which suggests a run to all-time highs is possible.
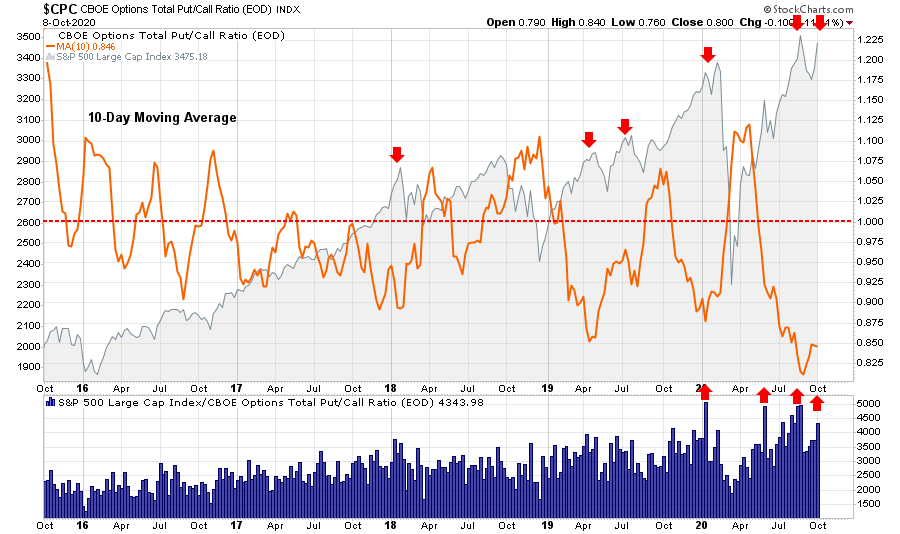
However, while a retest of highs is certainly possible, the truncated rally so far has consumed much of the previous oversold condition. Such may limited upside returns in the short-term to some degree.

Furthermore, the cumulative Advance/Decline line is also at levels which has typically denoted short-term market peaks.
However, for now, the markets surge into the election has a history of picking the next President.
“The performance of the S&P 500 in the three months before an election has predicted 87% of elections since 1928 and 100% since 1984. When returns were positive, the incumbent party wins. If the index suffered losses in the three-month window, the incumbent loses.”
For now, the market is favoring the re-election of President Trump.
However, from an investment standpoint, we must focus on “policies” and not “politics.”

Presidential Return Recap
Over the last two weeks, we have discussed much of what happens to the stock market before post-Presidential elections. As a quick recap:
“Will policies matter? The short answer is, “Yes.” However, not in the short-term. Presidential platforms are primarily ‘advertising’ to get your vote. As such, a politician will promise many things that, in hindsight, rarely get accomplished.
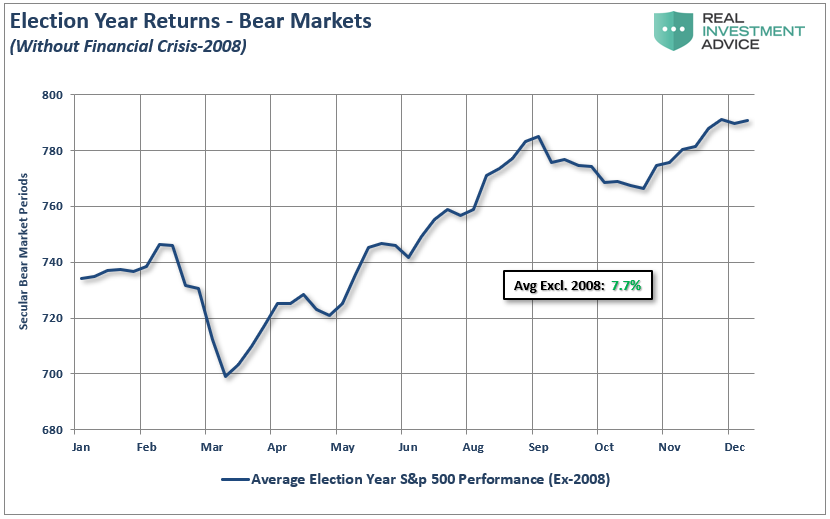
Therefore, while there currently much debate about whose policies will be better for the stock market, historically and statistically speaking, it doesn’t matter much. A look back at all election years since 1960 shows an average increase in the market of nearly 7.7% annually (exluding the 2008 ‘financial crisis.'” – Selloff Overdone
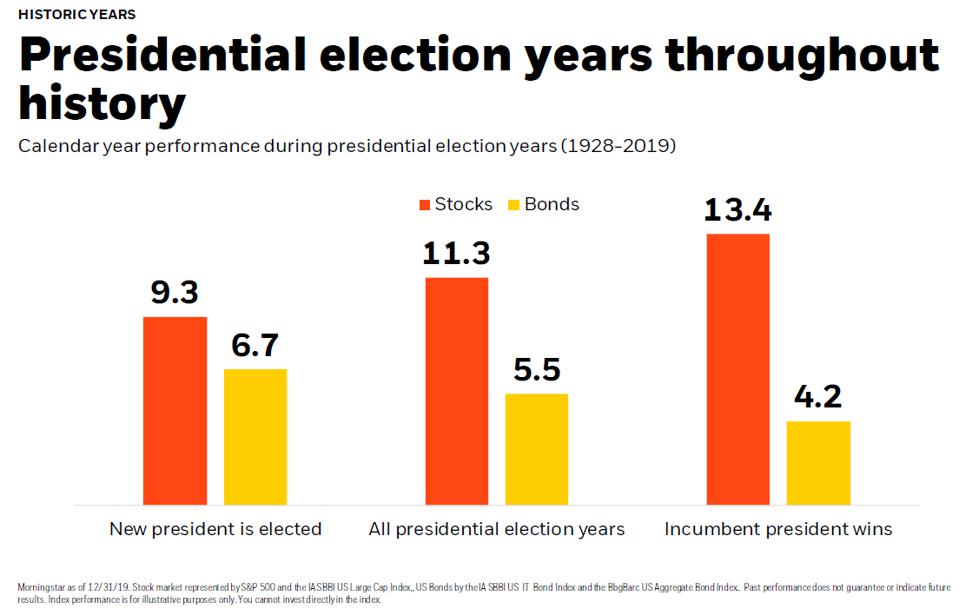
“However, it is worth noting that while returns are positive regardless of who is elected, it should be of no surprise the markets performed better during a year when voters re-elect the incumbent. The market hates uncertainty. In this case, Biden presents many unknowns: the potential for increased regulations, higher taxes, and other shifts the market perceives as anti-business.” – Is The Market Bounce Over?
Furthermore, this analysis only gets us through the end of the year.
What will matter as we head into 2021 will be the policies, not the politics.
Whoever Wins Loses
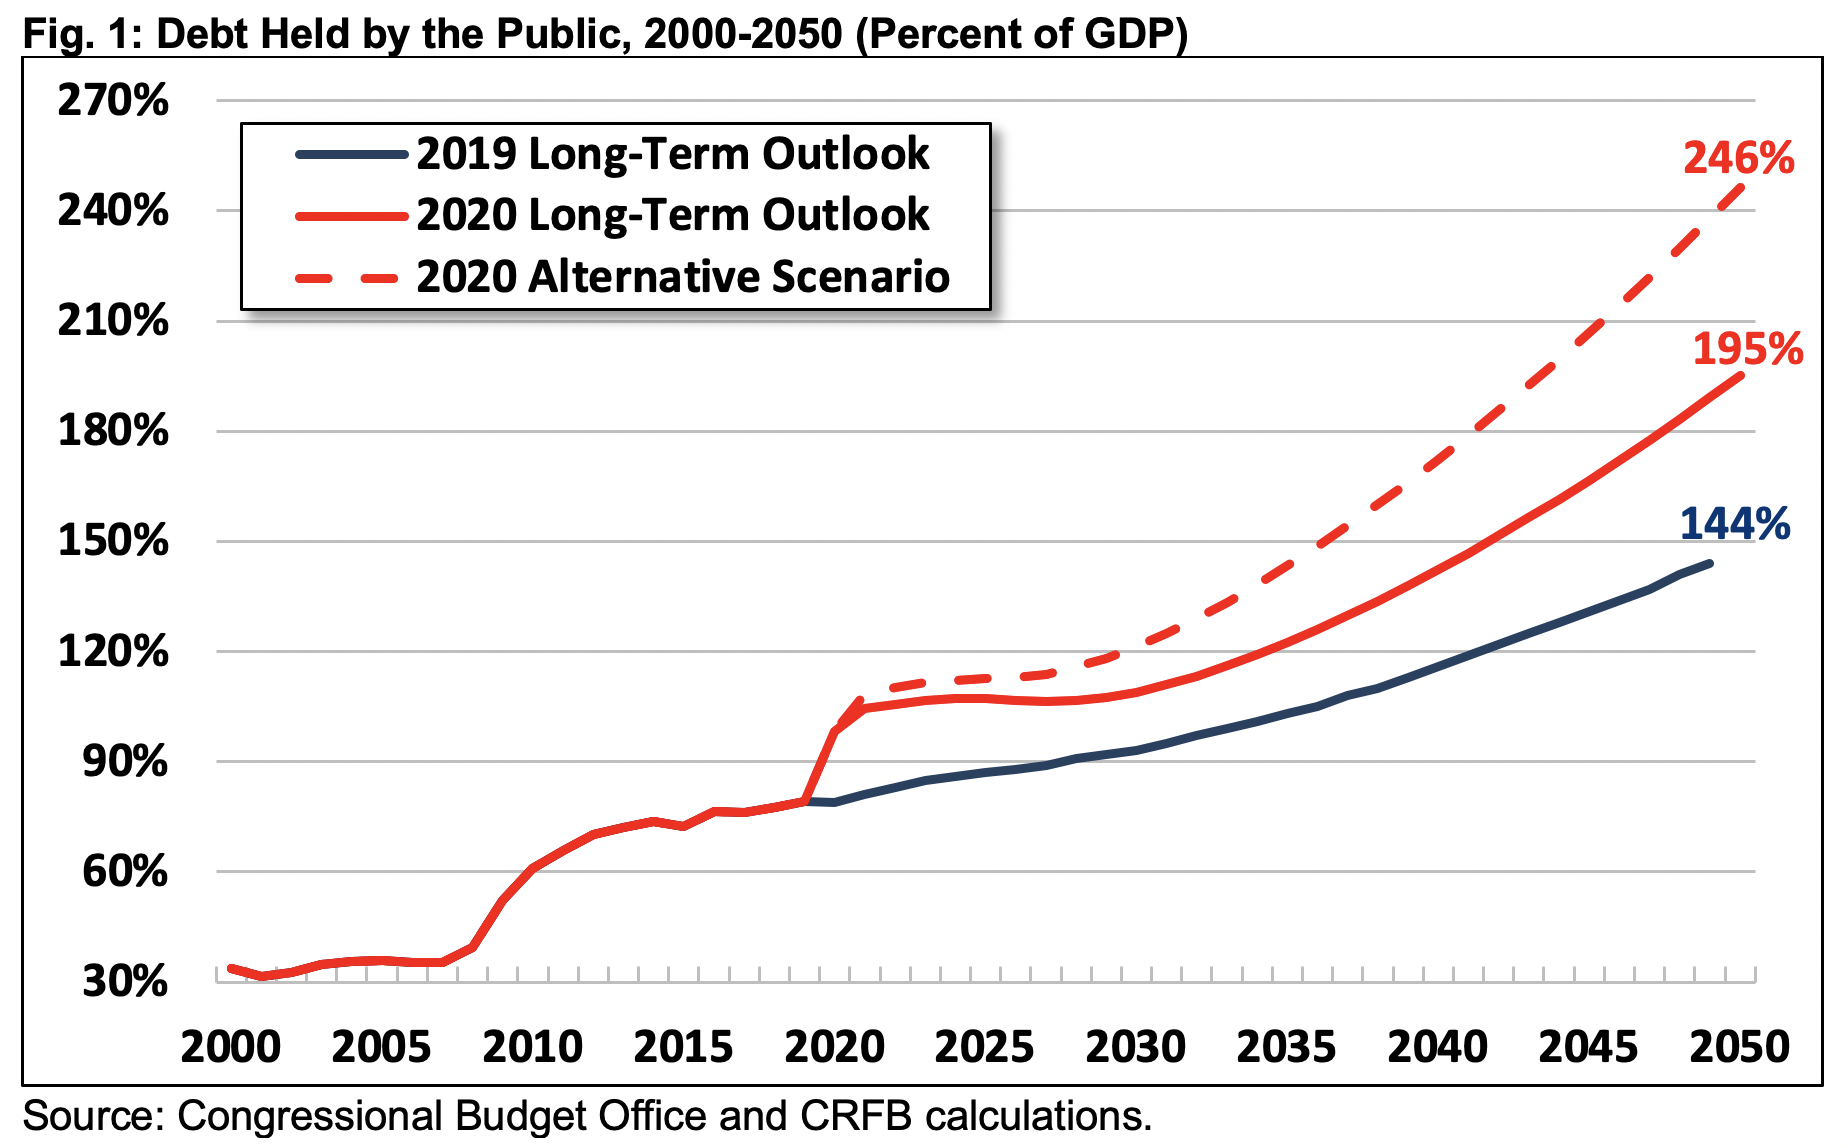
I don’t envy the person who takes the Oval Office in the months ahead. Whoever is inaugurated on January 20, 2021, will enormous fiscal challenges as trillion-dollar annual budget deficits will become the new normal. As we discussed recently, the national debt is projected to exceed the post-World War II record high over the next four-year term and reach twice the economy’s size within 30 years.
“Projected debt in 2050 is nearly five times higher than the 50-year average of 42 percent of GDP. It will be on track to double the previous record of 106 set just after World War II. In dollar terms, debt will rise from nearly $21 trillion today to $121 trillion by 2050.” – CFRB
Four major trust funds are also headed for insolvency, including the Highway and Medicare Hospital Insurance trust funds, within the next presidential term.
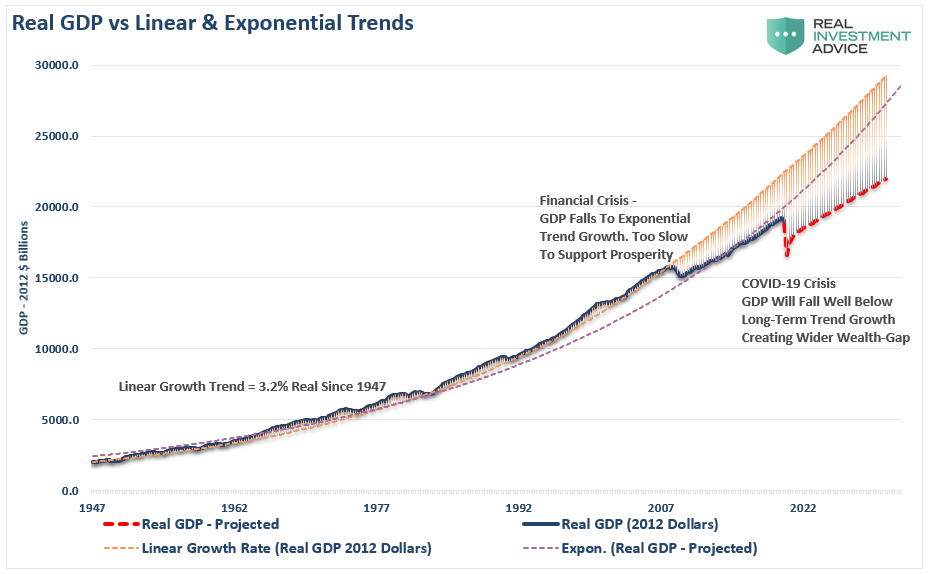
Furthermore, economic growth rates will decline as the “wealth gap” continues to widen.
“Before the “Financial Crisis,” the economy had a linear growth trend of real GDP of 3.2%. Following the 2008 recession, the growth rate dropped to the exponential growth trend of roughly 2.2%. Instead of reducing the debt problems, unproductive debt and leverage increased.”
Therefore, given there is no “will” to fix the problems before they break, whoever wins the Presidency will likely wind up losing.

Policies Over Politics
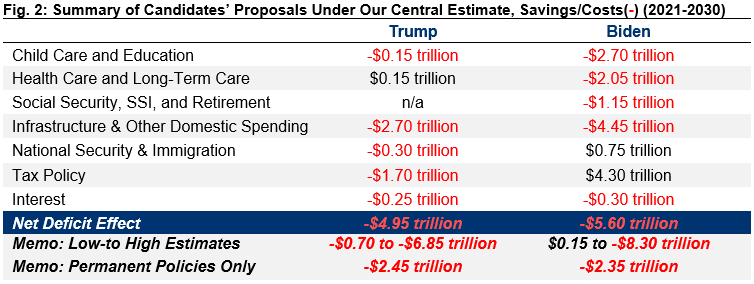
From an investment standpoint, the candidates’ policies will have an important bearing on economic growth and, ultimately, stock market returns. Our friends at the Committee For A Responsible Federal Budget (CFRB) did an excellent breakdown of candidates’ policies.
“President Donald Trump has issued a 54 bullet point agenda that calls for lowering taxes, strengthening the military, increasing infrastructure spending, expanding spending on veterans and space travel, lowering drug prices, expanding school and health care choice, ending wars abroad, and reducing spending on immigrants.
Vice President Joe Biden has proposed a detailed agenda to increase spending on child care and education, health care, retirement, disability benefits, infrastructure, research, and climate change, while lowering the costs of prescription drugs, ending wars abroad, and increasing taxes on high-income households and corporations.“
Importantly, neither of these plans will significantly improve economic prosperity, growth, or reduce the wealth gap. What both plans will do is significantly increase the debt and deficits.
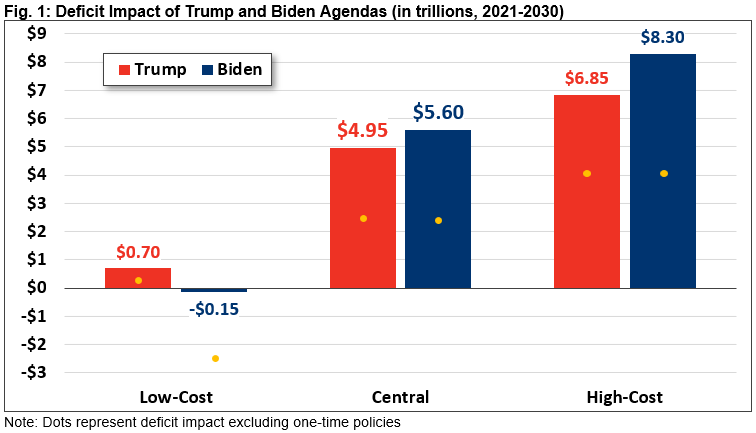
The table below breaks down the spending by candidates in different areas of the economy.
Bridges To Nowhere
While markets tend to get excited over infrastructure projects, they are not the projects that create long-term revenue streams and are a productive use of debt. Over the last 30-years, most of the projects have been “roads and bridges to nowhere,” which has left America financially worse off as the debt service mounts.
Importantly, there is a simple equation for future stock market returns:
- Corporate Profits = Revenue (derived from economic growth) – Taxes
Due to the misguided use of debt and higher tax rates on corporations, slower economic growth rates will negatively impact earnings growth. Given multiples are already extremely expensive, policies that reduce future earnings growth will make valuations increasingly difficult to justify. (Chart shows the 5-year average P/E as a percentage deviation from the long-term average.)
- The stock market, and investors, will favor Trump’s policies over Biden’s.
- The masses begging for more handouts, and Government largesse will prefer Bidens.
Both leave us worse off.
“Under our central estimate, neither major candidate for President of the United States in 2020 has put forward a plan that would address our unsustainable fiscal path. Instead, both President Donald Trump and former Vice President Joe Biden have promoted policy agendas that would likely significantly add to annual deficits and increase debt-to-GDP over the next decade.” – CFRB
Both candidates have the wrong policy prescription for fixing what ails the economy. However, this is “the trap.” After 40-years of deficit spending, politicians continue to hope that more deficits will somehow create a surplus.
The math doesn’t work that way.
At some point, you have to stop digging.

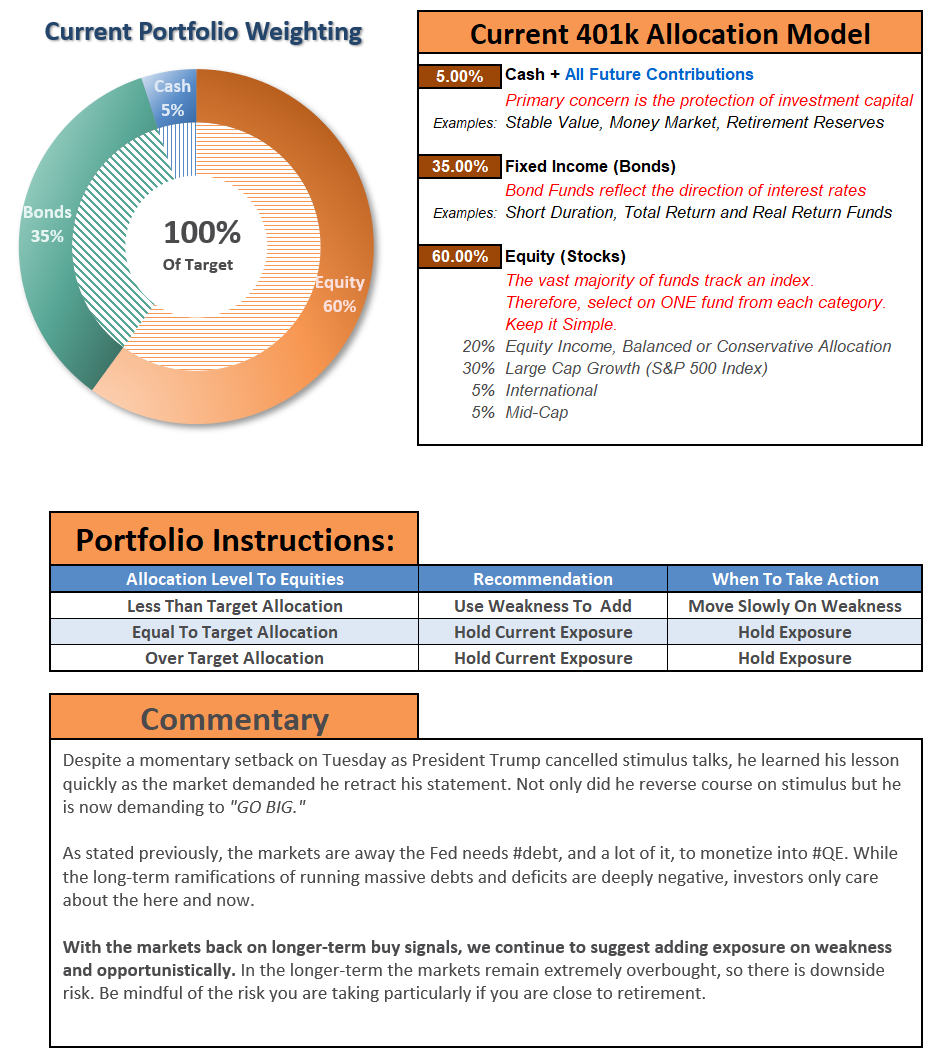
Portfolio Positioning Update
We have been increasing our equity exposure during the previous two weeks to take advantage of the market’s short-term bottom and reflexive rally. Following the same trading guidelines we have set out in this missive previously, we reduced laggards, added to our core long-term holdings, and rebalanced our risk hedges by reducing credit risk and shortening duration in our bonds.
Here are the rules:
Therefore, we are currently carrying only a slight overweight in cash, which has been a rarity this year. We are confident we will be rebuilding our cash position as the current rally reaches its conclusion near previous highs.
Above all, the longer-term market dynamics remain extremely skewed, and the recent correction failed to reduce those conditions. In other words, the market remains at risk of a deeper correction in the months ahead. As shown, the rising upper trendline continues to provide significant resistance, and combined with negative divergences in both breadth and relative-strength, there is a risk of failure.
In conclusion, such is why we continue to reiterate our positioning from last week:
“We continue to play the rally for what it is – a sellable one.
Over the next few weeks, a retracement back towards previous highs is possible. However, without fiscal support well on its way, another correction is likely. On a longer-term basis, as shown in the chart below, the market remains well deviated from longer-term means. That deviation will get resolved either through price or time. We don’t know which one it will be.”
Remember, when increasing equity exposure to chase market returns, “risk” is a function of how much you will “lose” if you are wrong.
If you manage the “risk” of losing more than you expected, generally, everything else tends to work out.

The MacroView
If you need help or have questions, we are always glad to help. Just email me.
See You Next Week
By Lance Roberts, CIO
Market & Sector Analysis
Analysis & Stock Screens Exclusively For RIAPro Members
Discover All You Are Missing At RIAPRO.NET
This is what our RIAPRO.NET subscribers are reading right now! Risk-Free For 30-Day Trial.
- Sector & Market Analysis
- Technical Gauge
- Fear/Greed Positioning Gauge
- Sector Rotation Analysis (Risk/Reward Ranges)
- Stock Screens (Growth, Value, Technical)
- Client Portfolio Updates
- Live 401k Plan Manager
THE REAL 401k PLAN MANAGER
A Conservative Strategy For Long-Term Investors

If you need help after reading the alert, do not hesitate to contact me.
Model performance is a two-asset model of stocks and bonds relative to the weighting changes made each week in the newsletter. Such is strictly for informational and educational purposes only, and one should not rely on it for any reason. Past performance is not a guarantee of future results. Use at your own risk and peril.

401k Plan Manager Live Model
As an RIA PRO subscriber (You get your first 30-days free), you can access our live 401k plan manager.
Compare your current 401k allocation to our recommendation for your company-specific plan and our on 401k model allocation.
You can also track performance, estimate future values based on your savings and expected returns, and dig down into your sector and market allocations.
If you would like to offer our service to your employees at a deeply discounted corporate rate, please contact me.


