
Inside This Week’s Bull Bear Report
- Sell-Off Starts The New Year
- How We Are Trading It
- Research Report – Sell Cash And Buy Stocks?
- Youtube – Before The Bell
- Market Statistics
- Stock Screens
- Portfolio Trades This Week
Market Review And Update
In our last newsletter for 2023, we noted that the more overbought market conditions were a risk. To wit:
“While the price action this past week reduced some of the overbought conditions, as represented by the Relative Strength Index (RSI), more work is still ahead. Next week, the ‘Santa Claus Rally’ will officially begin, lasting through the first two days of January. Given the overbought condition, further upside may remain limited.”
Unfortunately, the beginning of 2024 started with a sell-off that wiped out all of the gains from the last five days of December. In other words, “Santa Failed To Visit Broad And Wall.”

The failure of the Santa Claus rally has some historical implications, but not as dire as many have come to believe. As noted by the Stocktraders Alamanc on Wednesday:
“On the heels of last year’s momentous rally, the market is showing some signs of weakness causing the Santa Claus Rally to fail to materialize. Profit taking in January has become more commonplace in the last 25 years or so and January is notably softer in election years like 2024. Some profit taking is understandable following the massive rally from the end of October ranging from just over 16% for DJIA and S&P 500 to 19.9% for NASDAQ and 26.2% for Russell 2000 at their respective recent highs just before yearend. But the selling over the past few days is notable and a warning sign.
The lack of a rally can be a preliminary indicator of tough times to come. This was certainly the case in 2008 and 2000. A 4.0% decline in 2000 foreshadowed the bursting of the tech bubble and a 2.5% loss in 2008 preceded the second worst bear market in history. Down SCRs were followed by flat years in 1994, 2005 and 2015, and a mild bear that ended in February 2016. Of the 15 down SCRs since 1950, 10 years have been up and 5 down, but the average gain is a measly 5.0%. As Yale Hirsch’s now famous line states, ‘If Santa Claus should fail to call, bears may come to Broad and Wall.'”

With the Santa Claus Rally a no-show, we will now focus on the return for the first five days and the entire month. The old Wall Street axiom says, “So goes the first five days of January, so goes the month, so goes the year.” Since 1950, there have been only three occurrences when the Santa Rally failed, and the first five days and the month of January were positive. Two out of three years were up over 20%, and 1994 was flat, at -1.5%. The average gain for those 3-years was 14.8%.
Next week, we will know how the first five days turn out. For now, let’s return our focus on navigating a sell-off to start the year.
Investing Summit: Early Bird Registration Available Now
January 27th, we are hosting a live event featuring Greg Valliere to discuss investing in the 2024 presidential election. What will a new president mean for the markets, the risks, and where to invest through it all? Greg will be joined by Lance Roberts, Michael Lebowitz, and Adam Taggart for morning presentations covering everything you need to know for the New Year.
Register now, as there are only 150 seats. The session is a LIVE EVENT, and no recordings will be provided.

Sell Off Starts The New Year
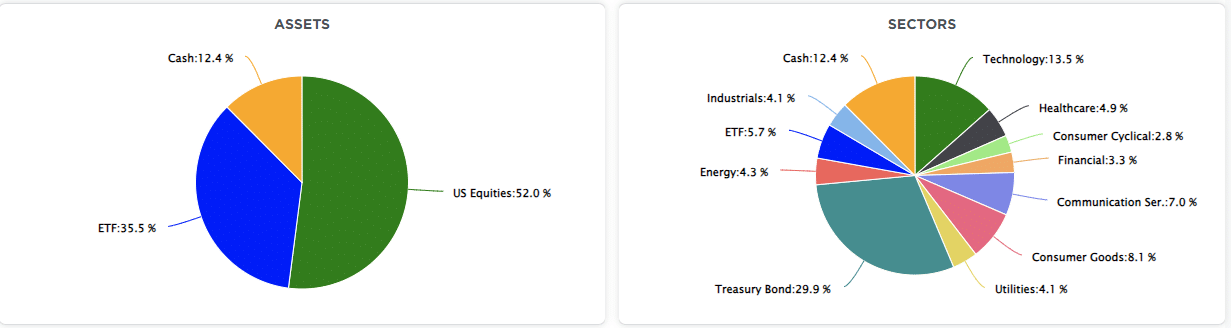
As noted above, the market started the year with a sell-off. However, as we discussed in Thursday’s Daily Market Commentary, the sell-off was most likely a function of tax selling by portfolio managers for the New Year. In other words, rather than selling on December 31st by taking gains (notably in Technology shares) in January, taxes are not paid until 2024. During that sell-off, we also noted some rotation into sectors that underperformed last year, like Healthcare and Energy, which should do better if economic growth stabilizes as is currently expected by Wall Street.
However, as we look forward to 2024, the question becomes, what will the markets do next? Will it be another year of Mega-cap stock dominance or a continued rotation into more defensive sectors? The answer will be whether we continue to see a disinflationary environment driven by slower economic growth or a rebound in activity. Also, what will the Federal Reserve do? Will it cut rates and ease monetary policy? These are all questions that we do not have answers to.
From a statistical perspective, the momentum and optimism from 2023 should carry into 2024. As shown in the table below, historically, when the market has a return of 20% or more, the following year tends to be positive.

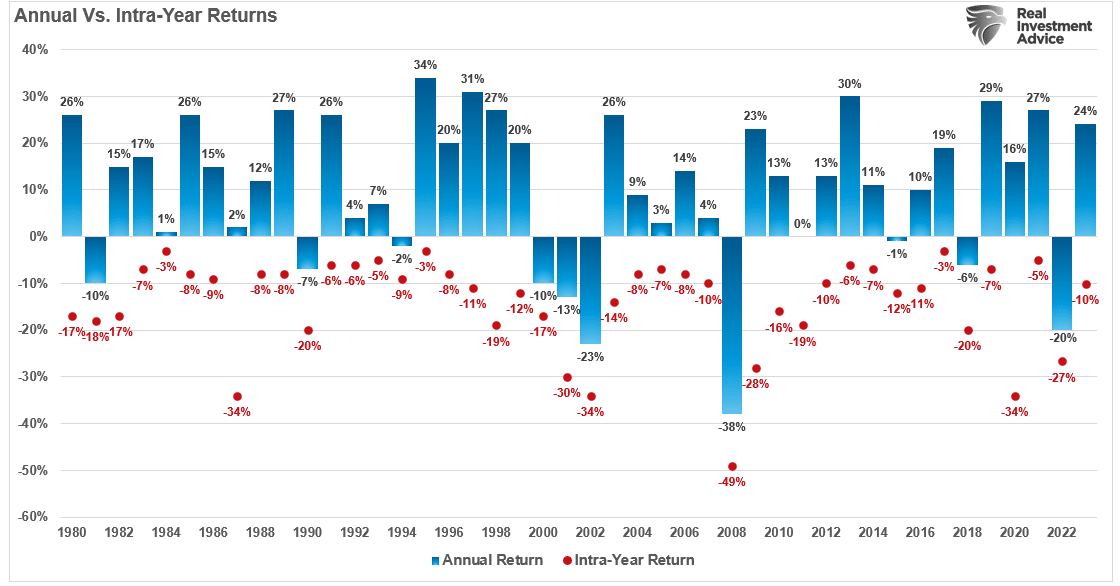
However, that does NOT mean there won’t be any bumps along the way. Just as in 2023, while the market sported a 24% return for the year, there was a 10% correction along the way, providing a better entry point for investors. As shown in the chart below, during every given year, there are corrections.
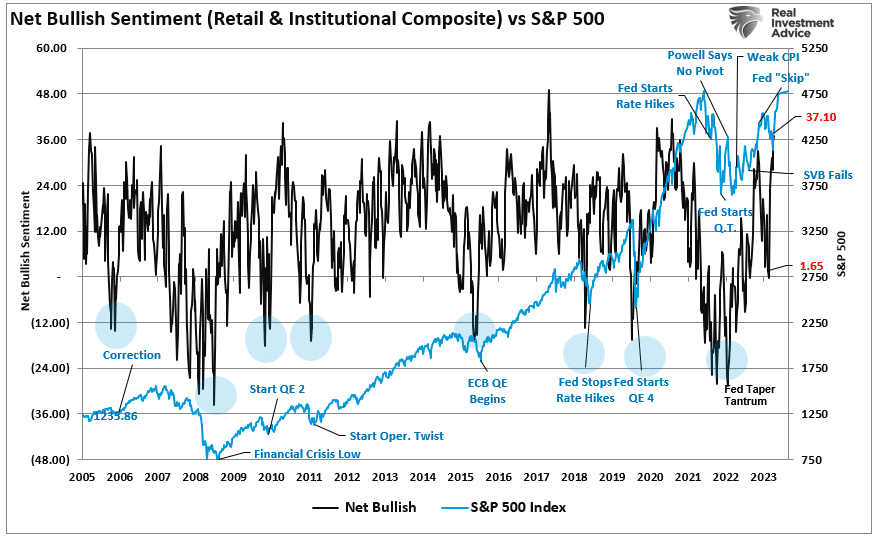
With investors currently very exuberant heading into 2024, the sell-off was not only expected but needed to rebalance buyers and sellers. As shown, the Net Bullish Sentiment of both retail and professional investors reached levels that historically coincide with short-term corrections.
While there are currently very few reasons to bearish on the market, it does not mean it lacks risks. And, as noted, investors should expect another 5-10% correction in 2024.
The Fed’s Predicament
That market rally since late October has been a function of valuation expansion. As shown, valuations have recently increased as earnings growth fails to keep up with the price increases.

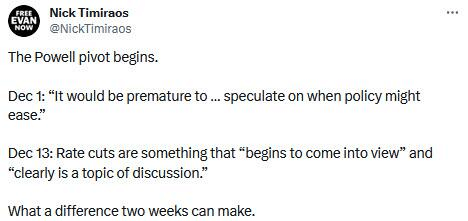
That valuation expansion was almost entirely driven by the reversal of the Federal Reserve’s focus on its inflation fight. As we noted previously, in just a month, the Federal Reserve reversed its stance from “higher for longer” to “rate cuts coming in 2024.”
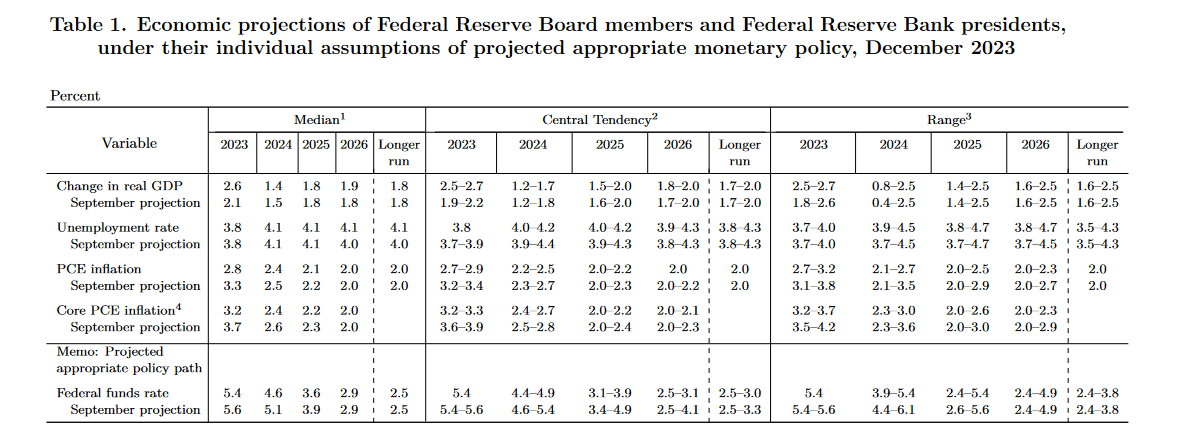
“Note that in the FOMC’s projections, not only is economic growth expected to slow sharply next year, but the Federal Funds rate is projected to drop by roughly 0.80 basis points.”
That reversal led to a rapid loosening of financial conditions, which supported the market rally.
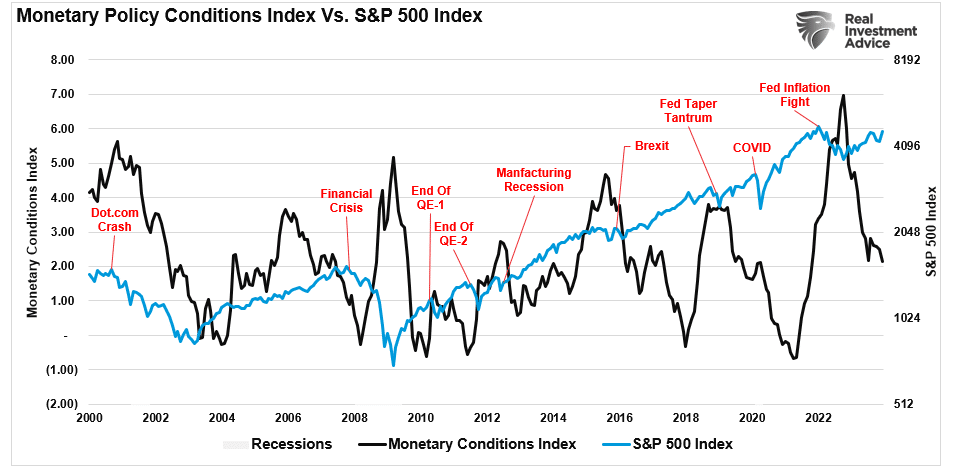
What surprised us is that the FOMC seems to have given up its fight against inflation. Given the decline in financial conditions will boost economic activity and consumer sentiment, historically supporting higher inflation rates, the Fed may face a predicament this year.
The question is whether the Federal Reserve sees some risk brewing in the economy or the financial system we are unaware of. There is some evidence of stress in the repo market, similar to that seen in 2019. The spread between the Treasury repo market and the fed funds rate has jumped sharply.
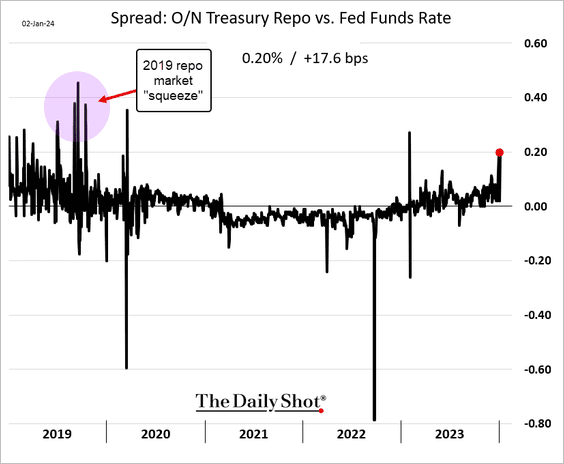
“After roughly four years of orderly trading when banks and fund managers lock-in funding at the end of each month, quarter and year, volatility has erupted again. Gyrations in repo rates sent one benchmark to a record on Thursday, while huge oscillations beset the market for short-term loans collateralized by Treasuries.
The return of these violent swings is largely thanks to the Federal Reserve, which is removing liquidity from the system via quantitative tightening, or QT. That’s reawakened volatility around these key funding periods, when banks pare activity to shore up their balance sheets for regulatory purposes, forcing would-be borrowers to either find alternatives or pay up. At the same time, the glut of government debt sales means more collateral that needs financing from the repo market.” – Bloomberg

In 2019, the Fed had started cutting rates and supplementing liquidity to the repo market. While such does not necessarily mean the current market sell-off melts into a full-blown bear market, it does explain the sudden change in the Fed’s view on “higher for longer.”
The critical point is that the financial system is fragile.
What Happens If The Fed Disappoints?
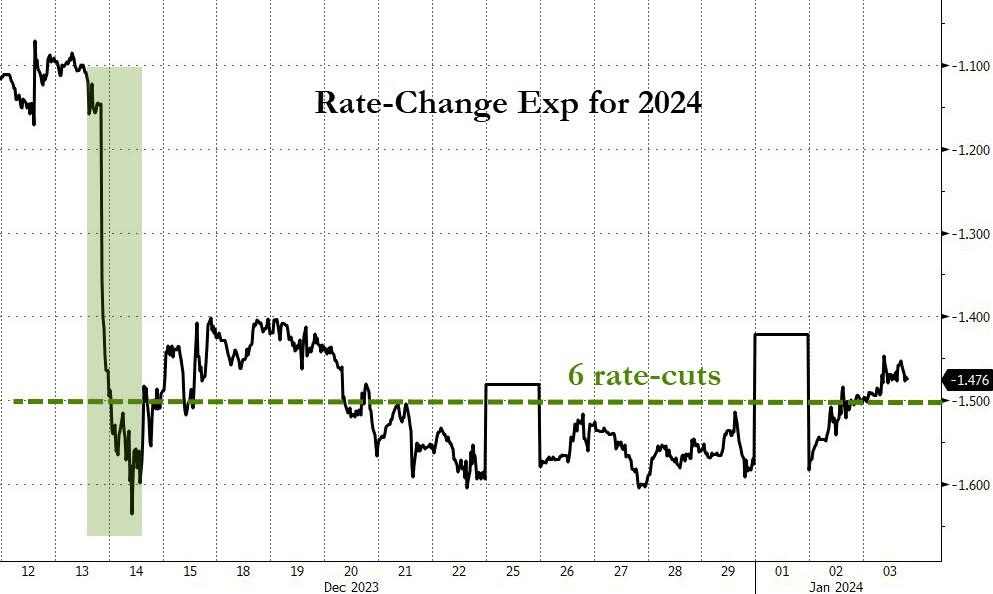
“Pros spend a lot of time thinking about potential risks. At the beginning of 2023, strategists and economists seemed to dwell on the downside. And most ended up being too pessimistic about the outlook for growth. In part, they anticipated the Fed’s interest rate hikes would choke off economic activity, a prediction that proved to be incorrect. Now, the market is pricing in six interest rate cuts this year. Once again, investors could be wrong — a key risk as we kick off 2024.” – Yahoo Finance
That gap between what the Fed says and what the market hears isn’t new. And as it has been in the past, it could lead to a more painful sell-off for the two to get on the same page. As noted, the market expects six rate cuts in 2024, double what the most recent Federal Reserve forecasts suggest.
The most recent FOMC minutes from December also suggest that the market is likely overly optimistic about financial accommodation in 2024. In those most recent minutes, there was:
- No sign of imminent rate cuts: Policymakers say their projections imply reductions “would be appropriate by the end of 2024,” and several suggest rates could stay at the current level for longer than they currently anticipate
- The benchmark rate was seen as likely at or near its peak, though officials note that further rate hikes remain possible if the economy warrants them.
- In addition, Fed officials reaffirmed a “careful” approach to rate decisions.
- Several participants observed that circumstances might warrant keeping the policy rate at current levels longer than they currently anticipate.
- Participants generally reaffirmed it would be appropriate for policy to remain restrictive until inflation was ‘clearly moving down sustainably.’
- At the same time, officials acknowledge “clear progress” in 2023 toward the Fed’s 2% inflation goal.
While the markets widely accepted Powell’s recent mention of rate cuts as a fact, the minutes suggest there is sufficient room for rates to “remain higher for longer.” Given the rapid easing in financial conditions and the sharp improvement in consumer confidence, such could be the case if inflationary pressures re-emerge.
That is likely an outcome that has not been fully accounted for in the more bullish outlooks for the markets.
How We Are Trading It
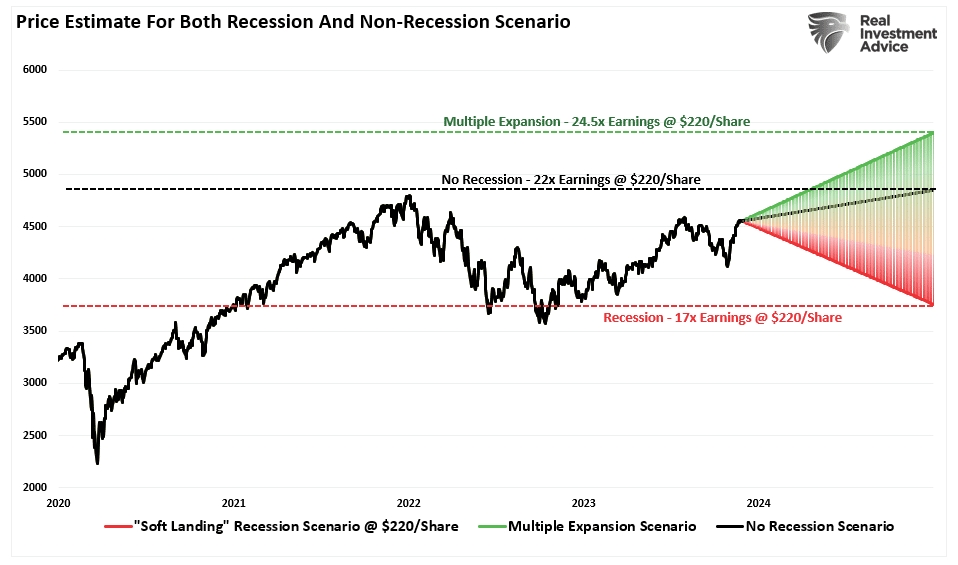
While the sell-off started the year on a soft footing, we have no idea how things will turn out this year. As we noted in “Analysts Are Optimistic,” there is a broad range of potential outcomes based on earnings and valuations.
“The chart below combines the three potential outcomes to show the range of possible outcomes for 2024. Of course, you can do the analysis, make valuation assumptions, and derive your targets for next year. This is just a logic exercise to develop a range of possibilities and probabilities over the next 12 months.
While the bullish scenario is possible, that outcome faces many challenges in 2024, given the market already trades at fairly lofty valuations. Even in a ‘soft landing’ environment, earnings should weaken, which makes current valuations at 22x earnings more challenging to sustain.
Our best guess is that reality lies somewhere in the middle. As investors, we should hope for lower valuations and prices, which gives us the best potential for long-term returns. Unfortunately, we don’t want the pain of getting there.”
Regardless of which scenario plays out in real-time, there is a reasonable risk of weaker returns over the next year than what we saw in 2023. Therefore, we suggest managing risk and focusing on what matters long-term.
- Capital preservation is always the primary objective. If you lose your capital, you are out of the game.
- Seek a rate of return sufficient to keep pace with the inflation rate. Don’t focus on beating the market.
- Keep expectations based on realistic objectives. (The market does not compound at 8%, 6% or 4%)
- Higher rates of return require an exponential increase in the underlying risk profile. This tends to never work out well.
- You can replace lost capital – but you can’t replace lost time. Time is a precious commodity that you cannot afford to waste.
- Portfolios are time-frame specific. If you have a 5-year retirement horizon but build a portfolio with a 20-year time horizon (taking on more risk), the results will likely be disastrous.
Have a great week.
Research Report

Subscribe To “Before The Bell” For Daily Trading Updates
We have set up a separate channel JUST for our short daily market updates. Please subscribe to THIS CHANNEL to receive daily notifications before the market opens.
Click Here And Then Click The SUBSCRIBE Button
Subscribe To Our YouTube Channel To Get Notified Of All Our Videos
Bull Bear Report Market Statistics & Screens

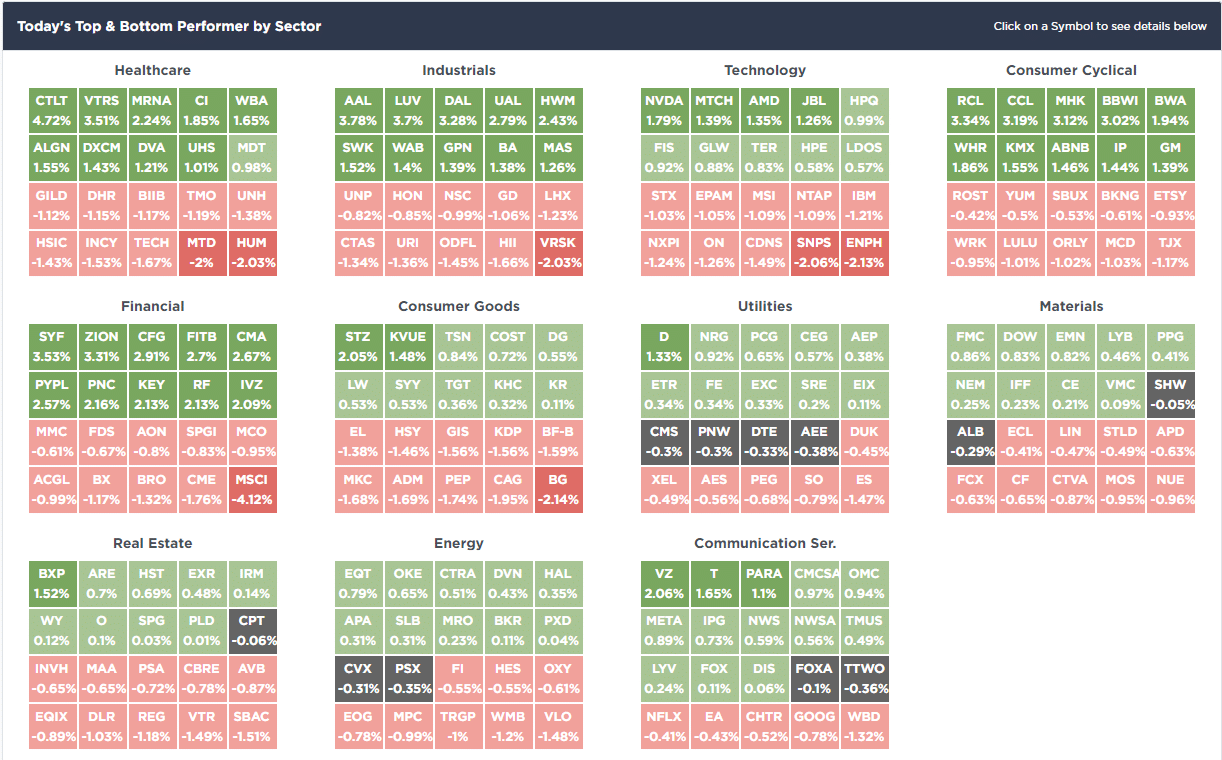
SimpleVisor Top & Bottom Performers By Sector
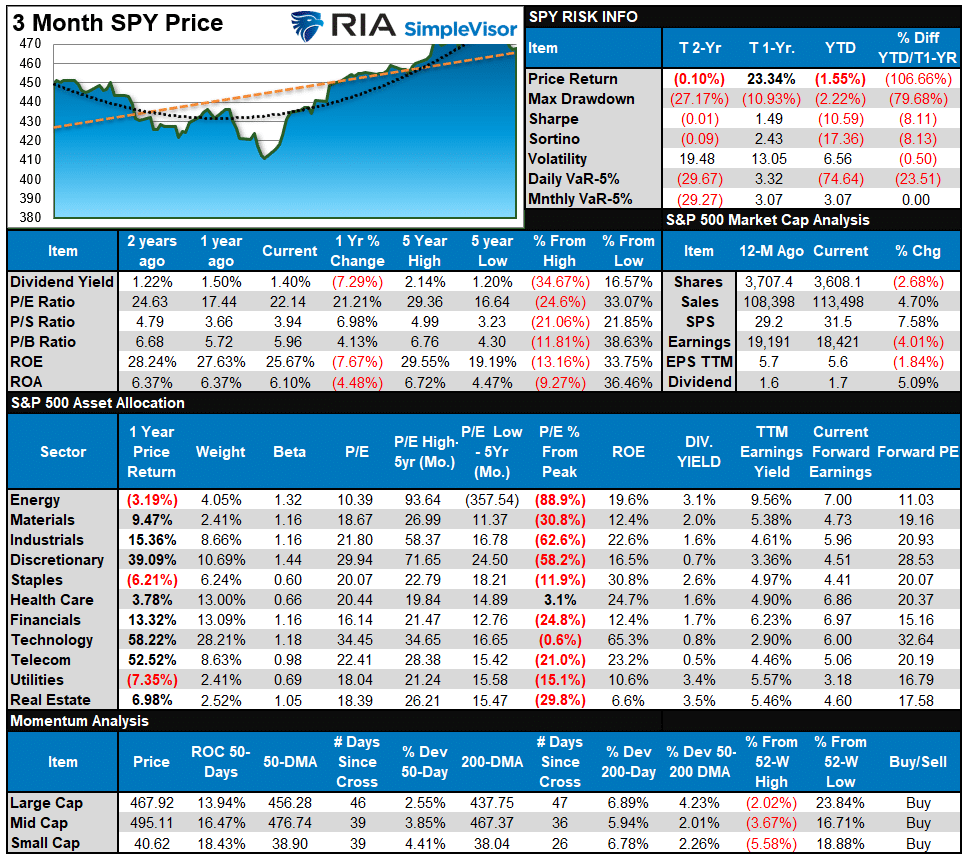
S&P 500 Weekly Tear Sheet
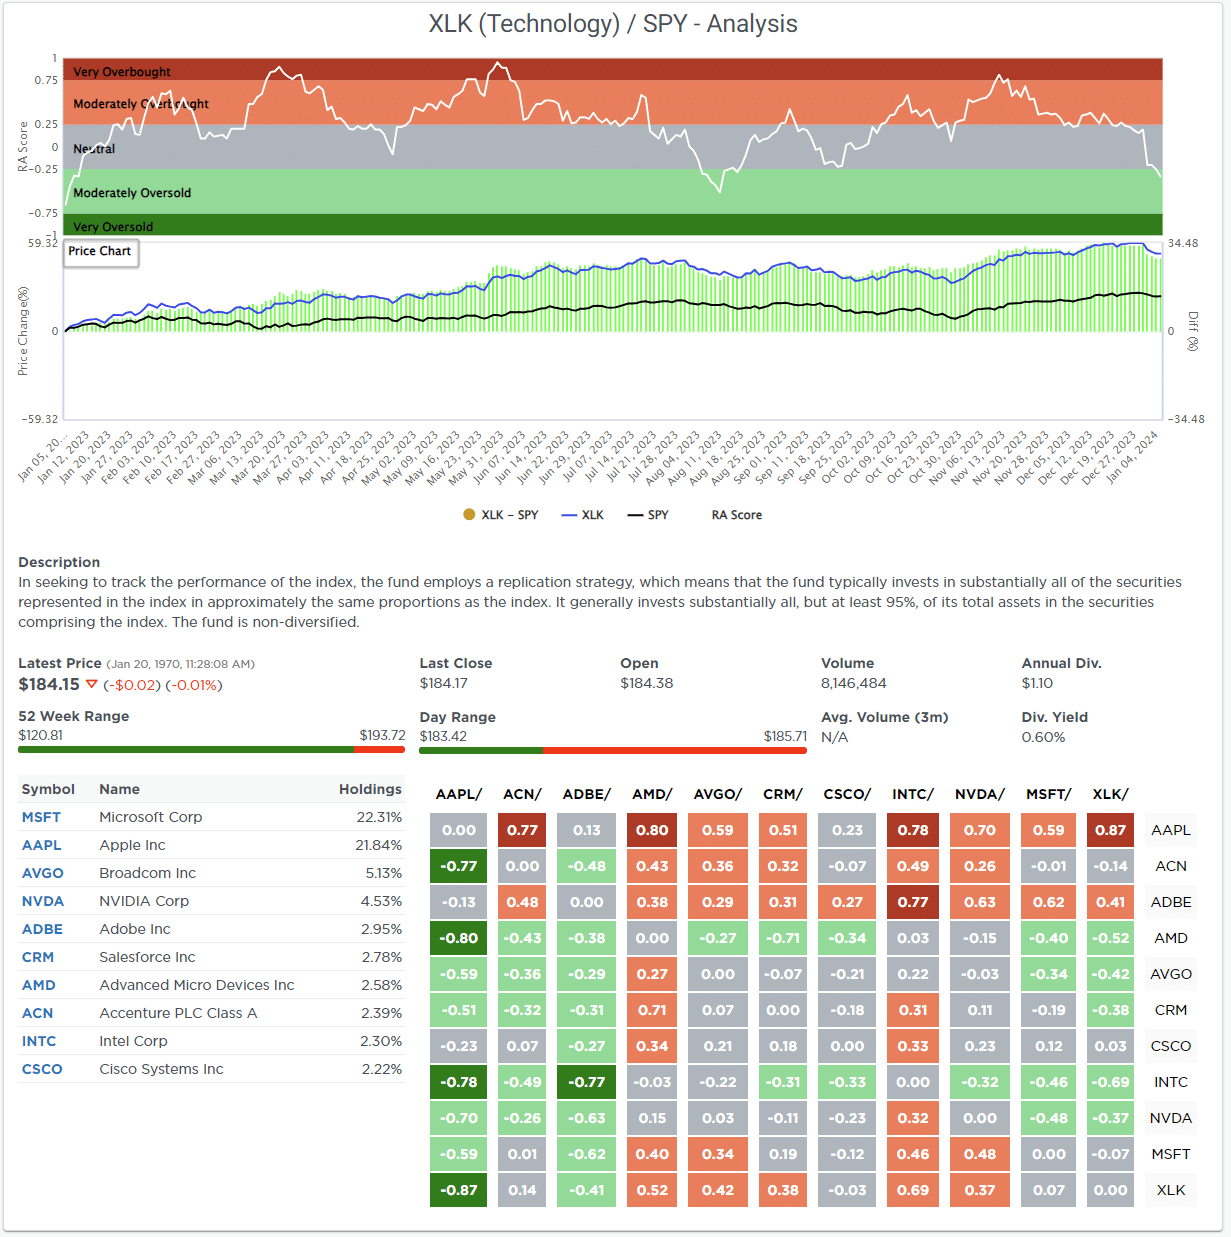
Relative Performance Analysis
The sell-off that marked the beginning of the year is evident in the major market and sector analysis. The laggards from last year, Utilities, Healthcare, and Energy, have clearly outperformed this year. Last year’s big winners have been this year’s biggest losers. We suspect that most of this is early repositioning and rebalancing, and we will get a clearer picture over the next few weeks as to where money is being allocated. However, for now, the markets are getting more oversold, and with Financials, Utilities, and Healthcare overbought, we should see some rotations back into the laggards to date.

Technical Composite
The technical overbought/sold gauge comprises several price indicators (R.S.I., Williams %R, etc.), measured using “weekly” closing price data. Readings above “80” are considered overbought, and below “20” are oversold. The market peaks when those readings are 80 or above, suggesting prudent profit-taking and risk management. The best buying opportunities exist when those readings are 20 or below.
The current reading is 79.98 out of a possible 100.

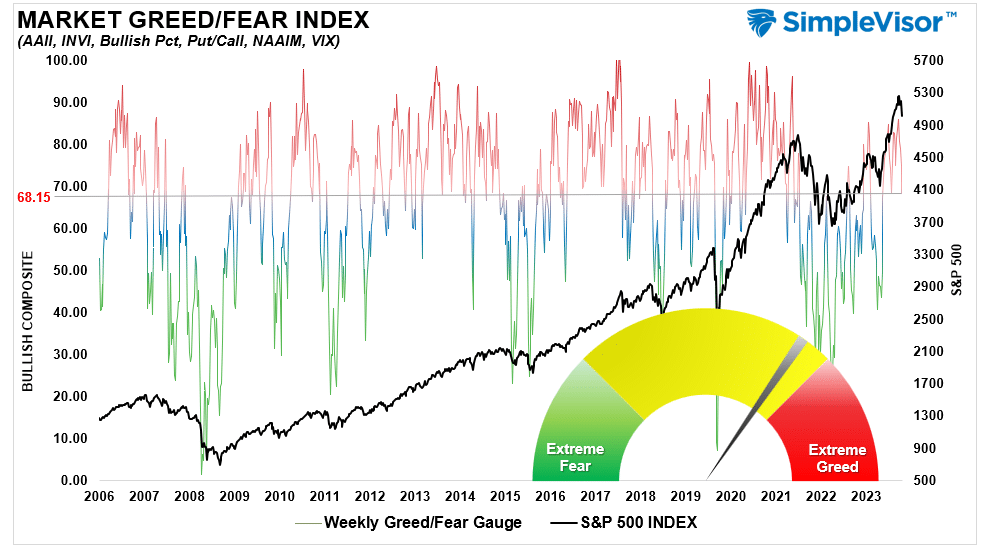
Portfolio Positioning “Fear / Greed” Gauge
The “Fear/Greed” gauge is how individual and professional investors are “positioning” themselves in the market based on their equity exposure. From a contrarian position, the higher the allocation to equities, the more likely the market is closer to a correction than not. The gauge uses weekly closing data.
NOTE: The Fear/Greed Index measures risk from 0 to 100. It is a rarity that it reaches levels above 90. The current reading is 83.26 out of a possible 100.
Relative Sector Analysis

Most Oversold Sector Analysis
Sector Model Analysis & Risk Ranges
How To Read This Table
- The table compares the relative performance of each sector and market to the S&P 500 index.
- “MA XVER” (Moving Average Crossover) is determined by the short-term weekly moving average crossing positively or negatively with the long-term weekly moving average.
- The risk range is a function of the month-end closing price and the “beta” of the sector or market. (Ranges reset on the 1st of each month)
- The table shows the price deviation above and below the weekly moving averages.
The start of the year has been sloppy. However, as we look forward to 2024, numerous sectors and markets are trading bearishly despite the market’s 24% advance last year. Furthermore, there are numerous sectors trading deviated well above their longer-term moving averages. Over the next couple of weeks, we should begin to get clarity as to where money is flowing. Will it be another narrow advance year, or will this finally be a year where the laggards finally have their day?

Weekly SimpleVisor Stock Screens
We provide three stock screens each week from SimpleVisor.
This week, we are searching for the Top 20:
- Relative Strength Stocks
- Momentum Stocks
- Fundamental & Technical Strength
(Click Images To Enlarge)
R.S.I. Screen

Momentum Screen

Fundamental & Technical Strength

SimpleVisor Portfolio Changes
We post all of our portfolio changes as they occur at SimpleVisor:
January 5th
“As we closed out last year, we took advantage of tax loss selling to reduce some positions in the portfolio. We entered the New Year a bit underweight in equity exposure, particularly in Healthcare. This morning, we are adding starter positions in both United Healthcare (see today’s UNH writeup) and Ely Lilly. We are looking for some consolidation or correction in these two names to bring the positions to target weight.
To make room for these two holdings, as we want to remain overweight cash at the moment, we are selling Cisco Systems (CSCO), which has remained a laggard in the portfolio.
In the sector model, we are balancing the Healthcare allocation by adding 2% to the SPDR Healthcare ETF (XLV).”
Equity Model
- Initiate a 1.5% portfolio position in United Healthcare (UNH) and Ely Lilly (LLY)
- Sell 100% of Cisco Systems (CSCO)
ETF Model
- Add 2% to the SPDR Healthcare Sector ETF (XLV).

Lance Roberts, C.I.O.
Have a great week!

