“Black Friday” Plunges As Covid Variant Rattles Markets


In this 11-26-21 issue of “Black Friday” Plunges As Market Rattled By Covid Variant
- “Black Friday” As Market Plunges
- Time To Buy Oil
- Yes, Interest Rates Will Matter
- Portfolio Positioning
- Sector & Market Analysis
- 401k Plan Manager
Follow Us On: Twitter, Facebook, Linked-In, Sound Cloud, Seeking Alpha
Is It Time To Get Help With Your Investing Strategy?
Whether it is complete financial, insurance, and estate planning, to a risk-managed portfolio management strategy to grow and protect your savings, whatever your needs are, we are here to help.
Schedule your “FREE” portfolio review today.
“Black Friday” As Market Plunges
Last week, we discussed the weakness of the underlying market as “FOMO” had returned to the market.
“The only concern we have is the lack of breadth as of late. As shown, the number of stocks above the 50-dma turned sharply lower this week. Furthermore, they are well below levels when markets typically make new highs. The same goes for the number of stocks trading above their 200-dma’s.”
Chart updated through Friday.
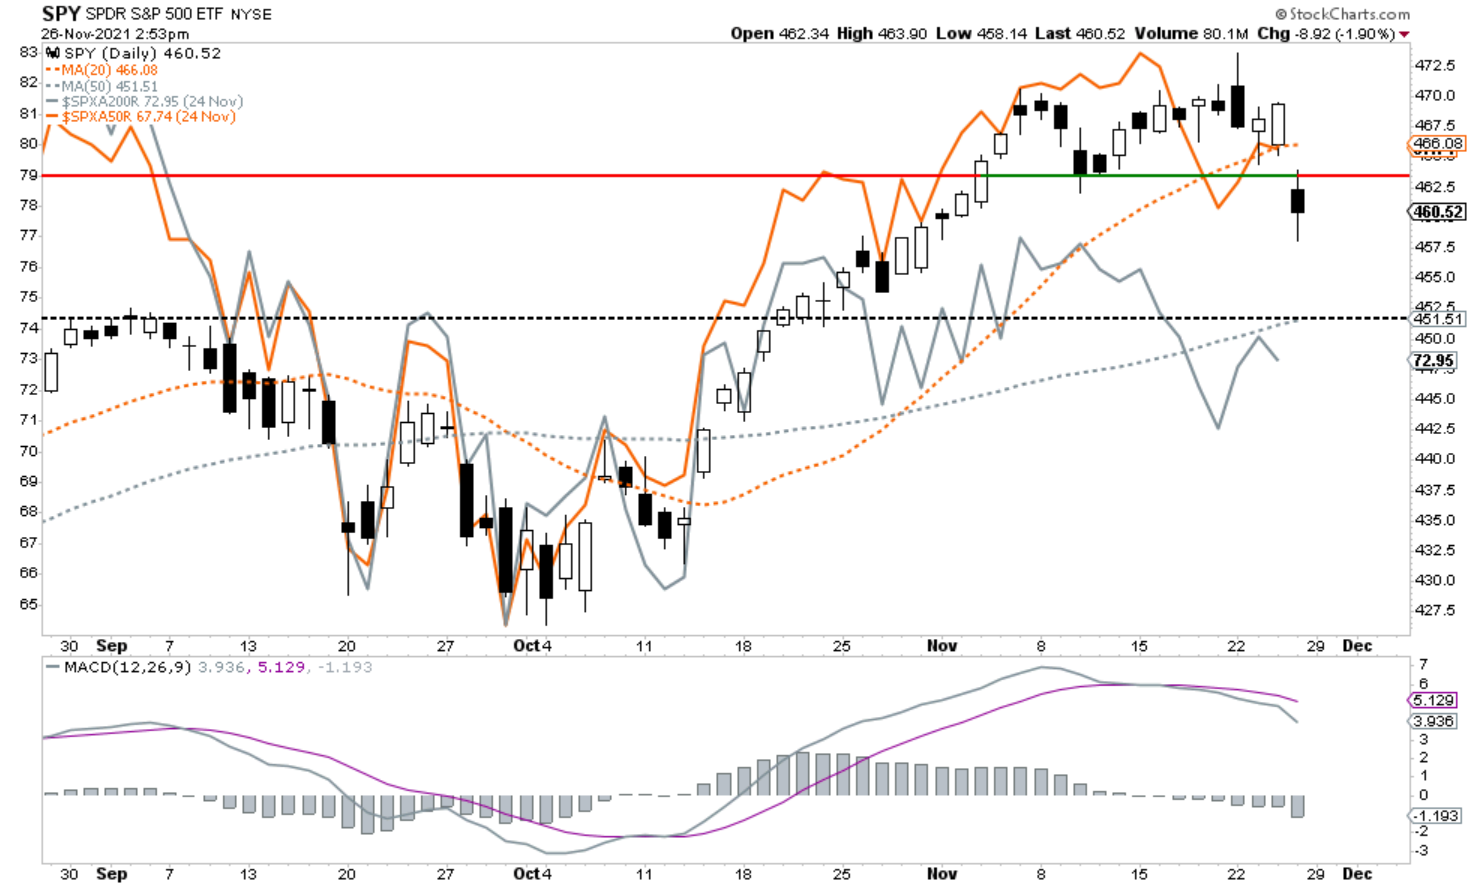
Over the last couple of weeks, the market has been warning to the risk of a downturn, all that was needed was a catalyst to change sentiment.
That occurred as news of a new “Covid” variant broke, stocks marked “Black Friday” by plunging firmly through the 20-dma and support at recent lows. Notably, that downside break broke the consolidation pattern (blue box in the chart below) that began in early November. While there is some minor support around 4550, critical support lies at the 50-dma at 4527. That support level also corresponds to the September peak.
With mutual fund distributions running through the first two weeks of December, there is additional downside pressure on stocks near term. However, our “money flow sell” signal is firmly intact and confirmed by the MACD signal. Such suggests we continue to maintain slightly higher levels of cash.

Notably, the market is getting oversold near-term, with the money-flow signal depressed. Such suggests that any further weakness will provide a short-term trading opportunity. As discussed last week, the statistical odds are high that we will see a “Santa Rally” as most professional managers will position for year-end reporting.
Just remember, nothing is guaranteed. We can only make educated guesses.
Will The Fed Slow Their Roll
While “Black Friday” usually marks the beginning of the retail shopping season, the question is whether the new “variant,” which is flaring concerns of additional lock-downs, will reverse the current economic recovery. As Barron’s notes, it will be worth watching the Fed closely.
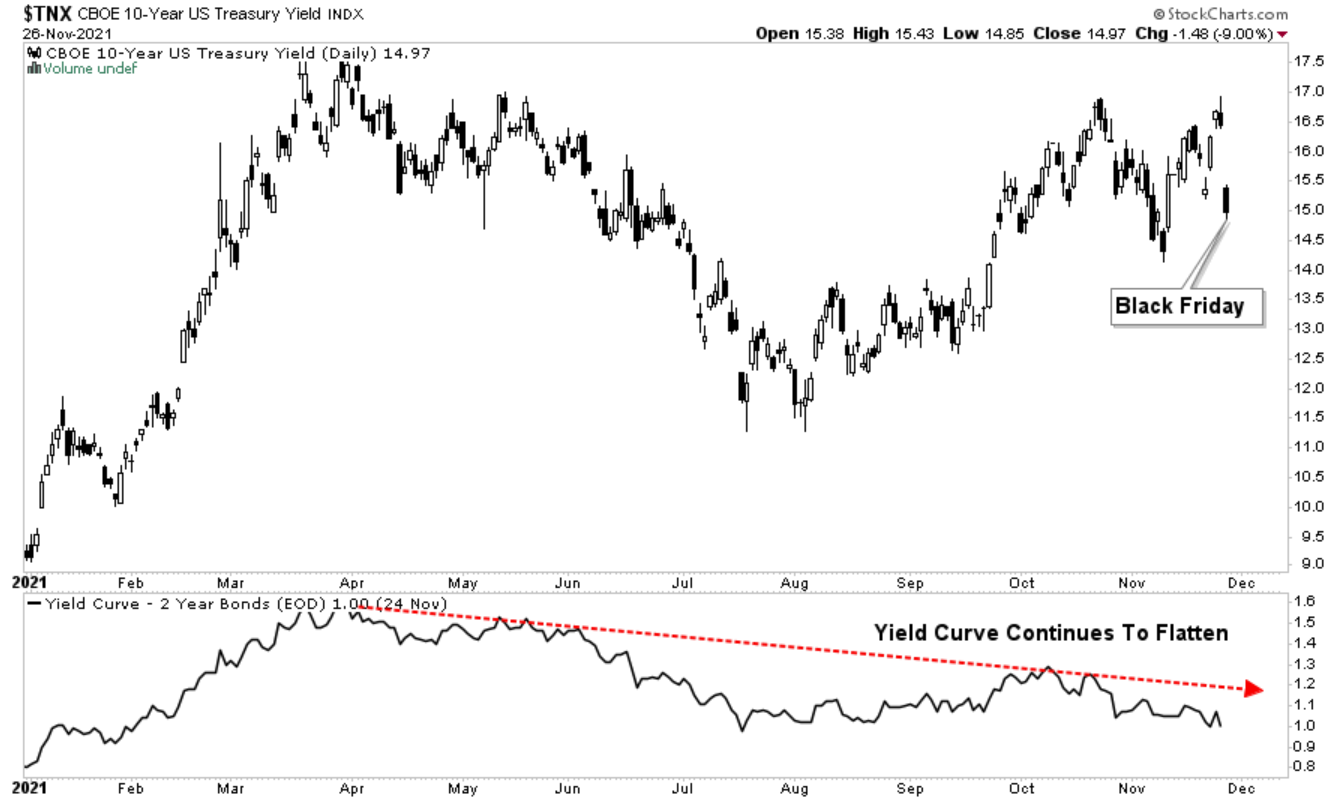
“Fixed-income markets are signaling that the Federal Reserve will have to increase interest rates sooner than expected, which could put a dent in the stock market.
The yield on the 2-year Treasury note has gone from 0.5% in early November to 0.64% as of Wednesday. The move suggests that investors expect the Fed to raise interest rates to combat inflation that remains higher than expected because of soaring consumer demand and supply chains that are struggling to match demand.
Indeed, minutes released Wednesday from the Fed’s meeting earlier this month show that members of the central bank are prepared to increase rates sooner than previously anticipated if inflation remains high.”
Of course, this was before “Black Friday” sent yields plunging 10% lower in a single day. Suddenly, the bond market is starting to question the sanity of hiking rates in the face of an ongoing pandemic.
While many pundits have suggested higher interest rates won’t matter to stocks, as we will discuss momentarily, they do matter and often matter a lot.
The surge in the new variant gives the Fed an excuse to hold off tightening monetary policy even though inflationary pressures continue to mount. But, what is most important to the Fed is the illusion of “market stability.”
What “Black Friday’s” plunge showed was that despite the Fed’s best efforts, “instability” is the most significant risk to the market and you.
More on this in a moment.

Time To Buy Oil?
Once a quarter, I review the Commitment Of Traders report to see where speculators place their bets on bonds, the dollar, volatility, the Euro, and oil. In October’s update, I looked at oil prices that were then pushing higher as speculators were sharply increasing their net-long positioning on crude oil.
We suggested then that “the current extreme overbought, extended, and deviated positioning in crude will likely lead to a rather sharp correction. (The boxes denote previous periods of exceptional deviations from long-term trends.)
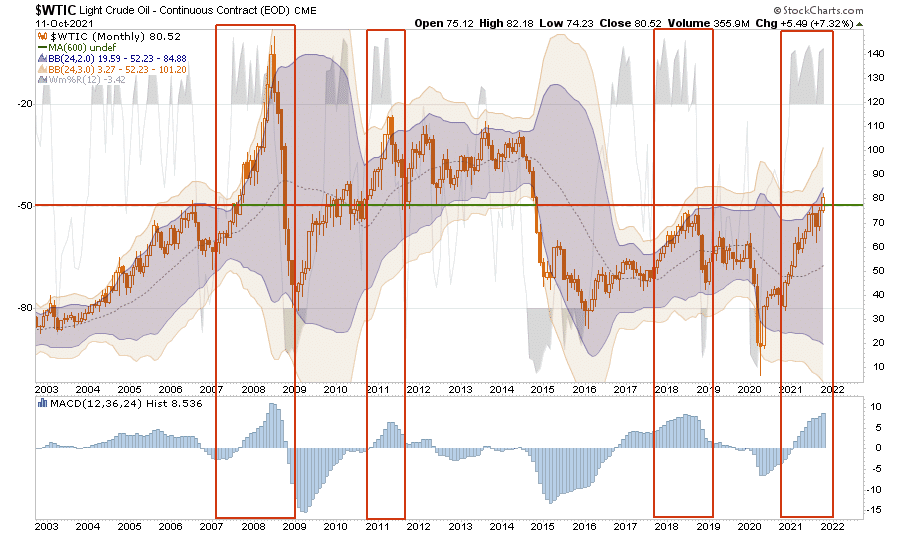
The dollar rally was the most crucial key to a view of potentially weaker oil prices. Given that commodities are globally priced in U.S. dollars, the strengthening of the dollar would reduce oil demand. To wit:
“The one thing that always trips the market is what no one is paying attention to. For me, that risk lies with the US Dollar. As noted previously, everyone expects the dollar to continue to decline, and the falling dollar has been the tailwind for the emerging market, commodity, and equity ‘risk-on trade.” – June 2021
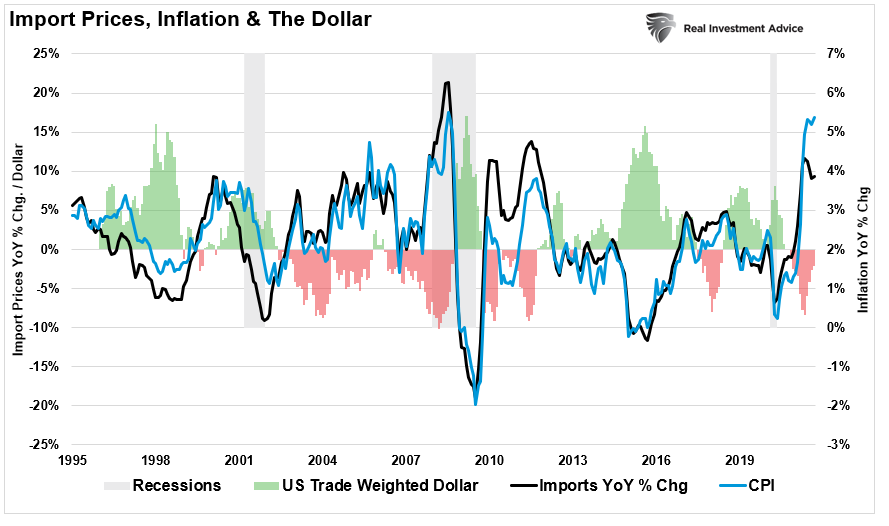
Since then, as expected, the dollar rally is beginning to weigh on commodity prices, and oil in particular.
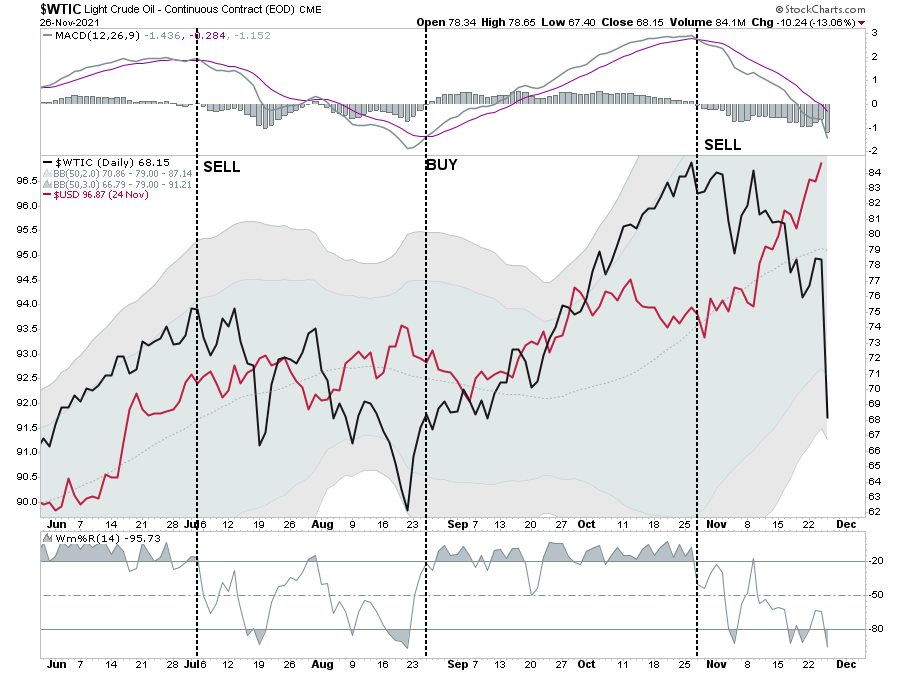
While the dollar could certainly rally further heading into year-end, oil prices are becoming much more attractive from a trading perspective. The recent correction did violate the 50-dma, which will act as short-term resistance. However, prices are beginning to reach more attractive oversold levels.
There are also reasons to believe higher oil prices are coming.

Higher Oil Prices Coming
The Biden administration released oil from the “Strategic Petroleum Reserve,” attempting to lower oil prices. He also tasked the DOJ to “investigate oil companies for potential price gouging.” These actions are thinly veiled attempts to regain favor with voters but will not lower oil prices.
Oil prices are NOT SET by producers. Instead, speculators and hedgers set oil prices on the NYMEX. Think about it this way:
- If oil companies are setting prices to “reap profits,” why did oil prices go below ZERO in 2020?
- Furthermore, would producers need to “hedge” current production against future delivery?
There are two drivers reflecting positioning by speculators and hedgers:
- The expected supply and demand for oil; and,
- The value of the dollar.
The more critical problem comes from the Administrations’ attack on production over “climate change” policies. As noted in Crude Investing: Energy Stocks & ESG (kailashconcepts.com):
“This isn’t rocket science. Look at the sharply lagging rig response to the rise in energy prices post the Covid crash. This is an anomaly.
According to history, there should be ~1,300 rigs in operation today based on current oil prices. With only ~480 rigs running today, oil’s prospects may be bright over the long haul.”
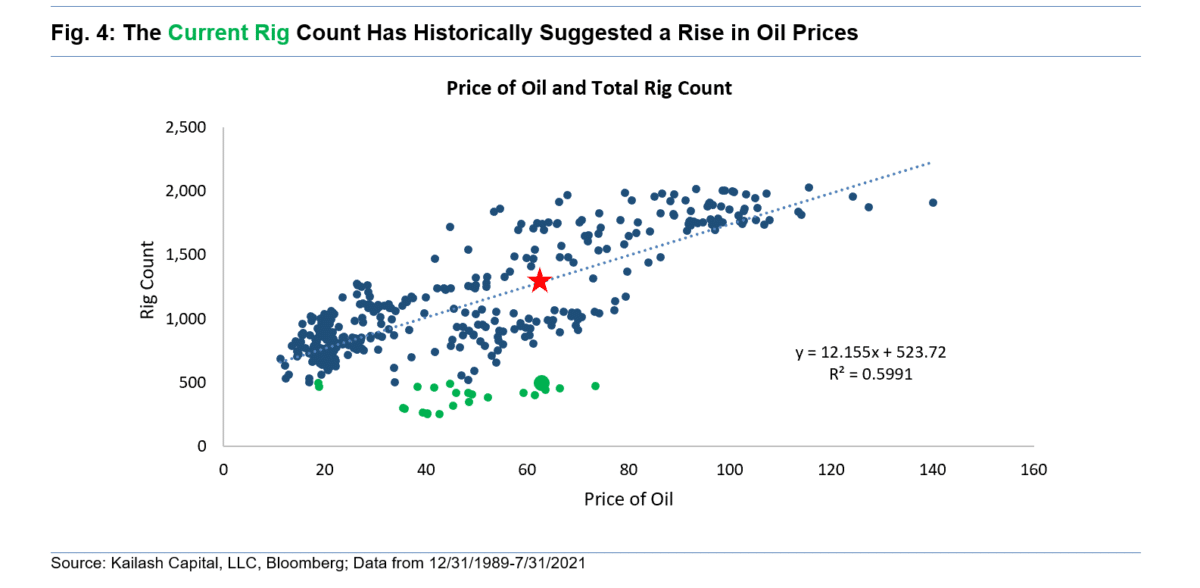
With output at such low levels, OPEC+ refusing to increase production, and “inefficient clean energy” increasing demand on “dirty energy,” higher future prices are likely.
If the economy falls into a tailspin, oil prices will fall along with demand, so nothing is assured. However, the ongoing decline in CapEx in the industry suggests production will continue to contract, leaving it well short of future demand.
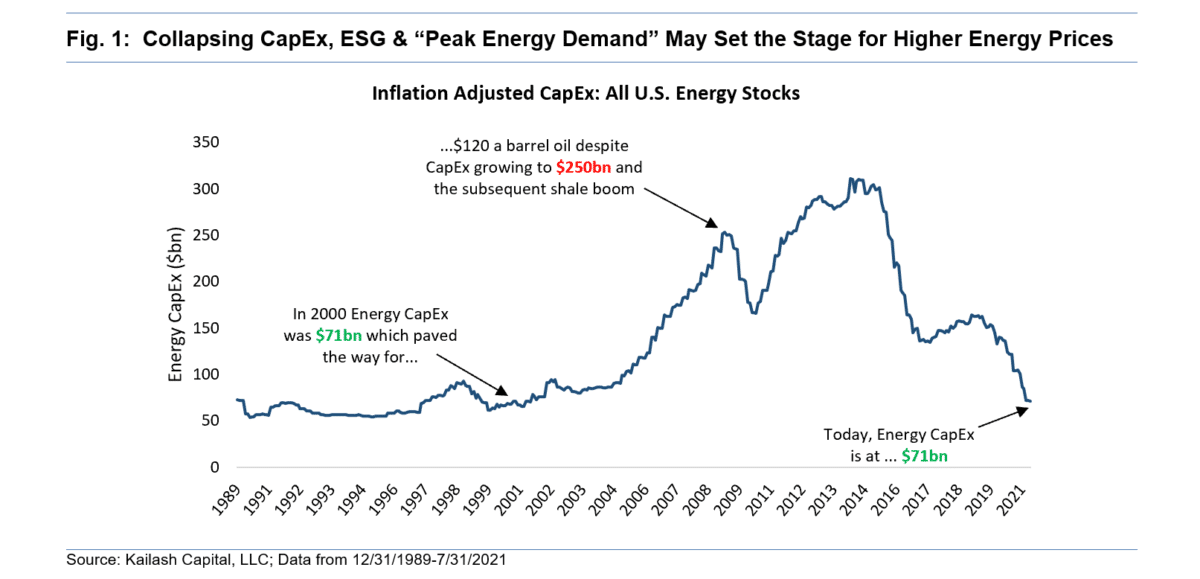
That is the perfect environment for higher prices.
In Case You Missed It

Higher Interest Rates Will Lead To Market Volatility
Did “Black Friday’s” plunge send a warning about rates? Last week, we discussed that it isn’t a question of if, but only one of when.
I showed the correlation between interest rates and the markets. With the sharp drop in rates, it is worth reminding you of the analysis. It is all about “instability.”
The chart below is the monthly “real,” inflation-adjusted return of the S&P 500 index compared to interest rates. The data is from Dr. Robert Shiller, and I noted corresponding peaks and troughs in prices and rates.
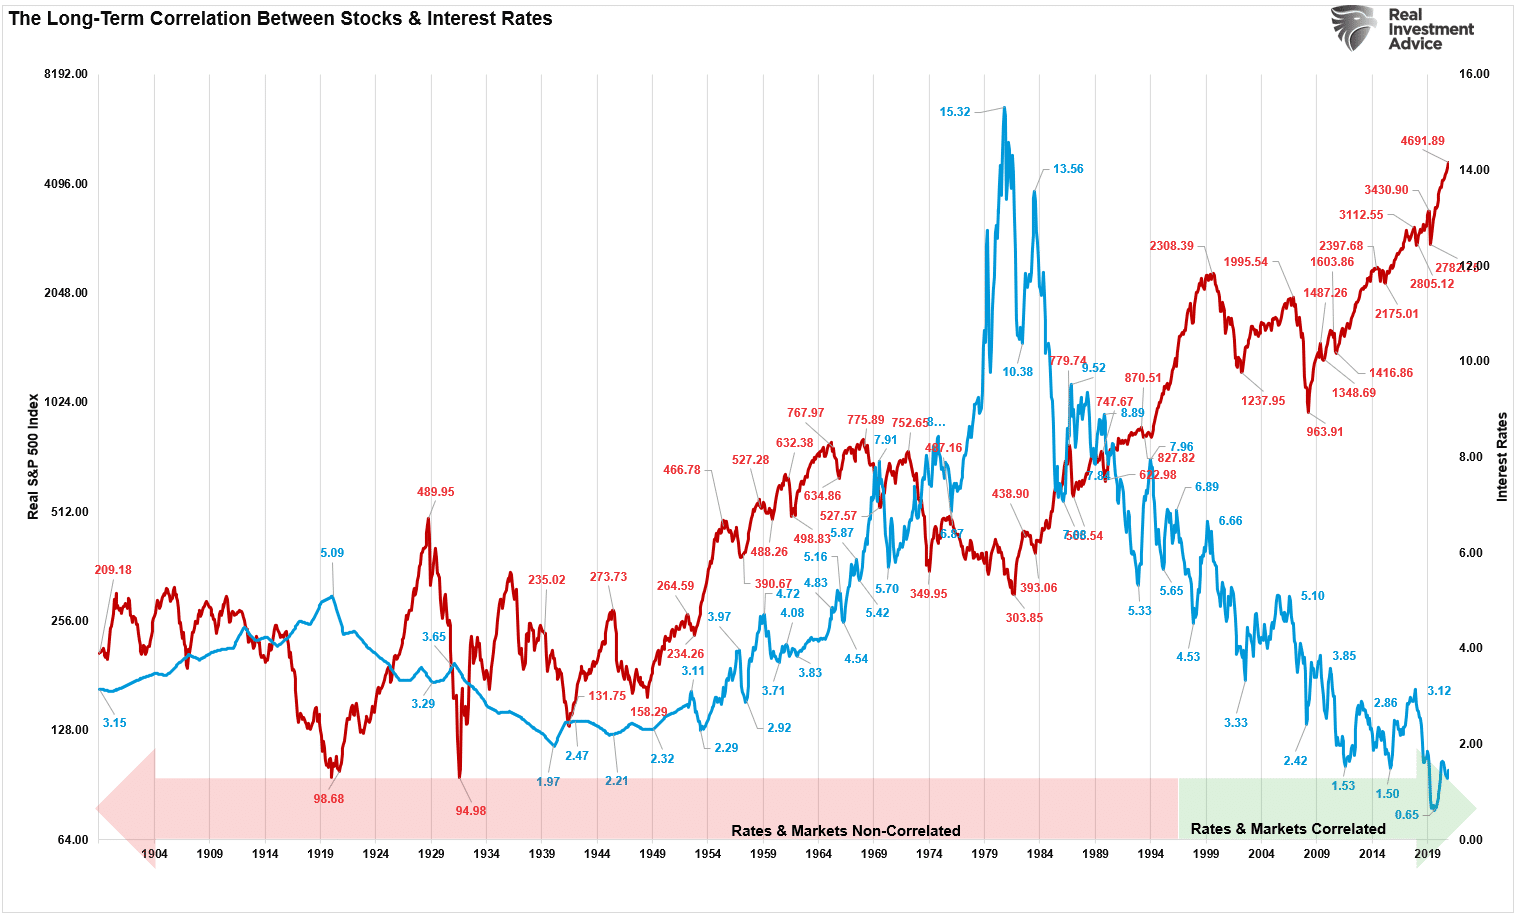
To try and understand the relationship between stock and bond returns over time, I took the data from the chart and broke it down into 46 periods over the last 121-years. What jumps is the high degree of non-correlation between 1900 and 2000. As one would expect, in most instances, if rates fell, stock prices rose. However, the opposite also was true.
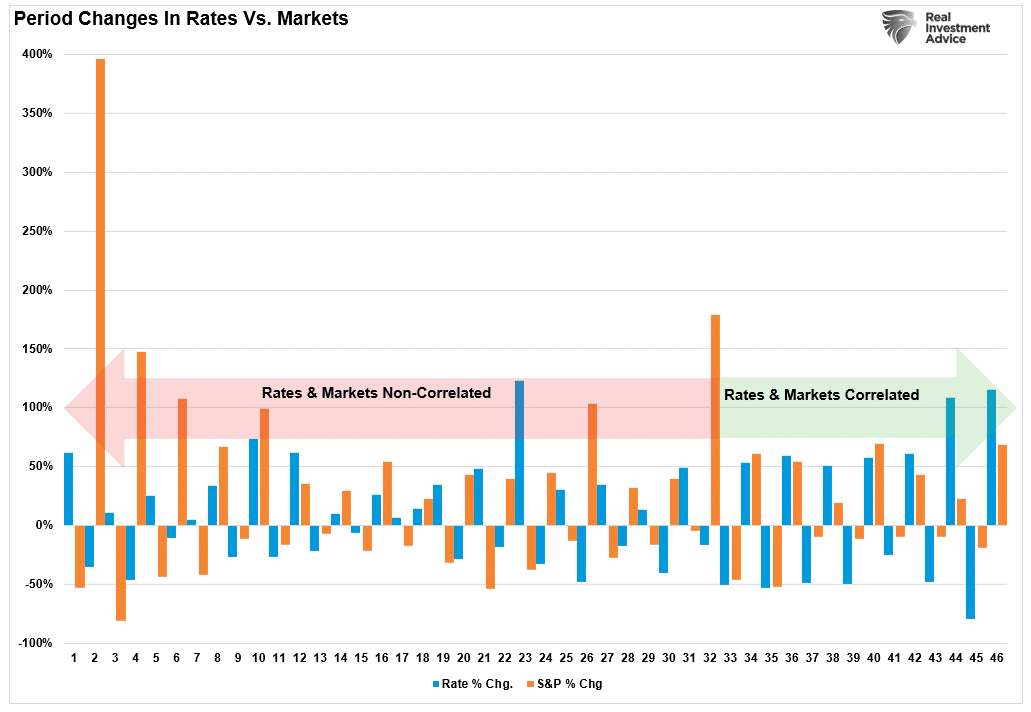
Rates Matter
Notably, since 2000, rates and stocks rose and fell together. So bonds remain a “haven” against market volatility.
As such, In the short term, the markets (due to the current momentum) can DEFY the laws of financial gravity as interest rates rise. However, as interest rates increase, they act as a “brake” on economic activity. Such is because higher rates NEGATIVELY impact a highly levered economy:
- Rates increases debt servicing requirements reducing future productive investment.
- Housing slows. People buy payments, not houses.
- Higher borrowing costs lead to lower profit margins.
- The massive derivatives and credit markets get negatively impacted.
- Variable rate interest payments on credit cards and home equity lines of credit increase, reducing consumption.
- Rising defaults on debt service will negatively impact banks which are still not as well capitalized as most believe.
- Many corporate share buyback plans and dividend payments are done through the use of cheap debt.
- Corporate capital expenditures are dependent on low borrowing costs.
- The deficit/GDP ratio will soar as borrowing costs rise sharply.
Critically, for investors, one of the main drivers of assets prices over the last few years was the rationalization that “low rates justified high valuations.”
Either low-interest rates are bullish, or high rates are bullish. Unfortunately, they can’t be both.
What “Black Friday’s” plunge showed was the correlation between rates and equity prices remains. Such is due to market participants’ “risk-on” psychology. However, that correlation cuts both ways. When something changes investor sentiment, the “risk-off” trade (bonds) is where money flows.
The correlation between interest rates and equities suggests that bonds will remain a haven against risk if something breaks given exceptionally high market valuations. The market’s plunge on “Black Friday” was likely a “shot across the bow.”
It might just be worth evaluating your bond allocation heading into 2022.

Portfolio Update
We made no substantive changes to portfolio allocations this past week given due to the holidays. Generally, the week of Thanksgiving is a poor indicator of market sentiment given the “inmates are running the asylum.”
Therefore, despite the market swinging around a good bit this past week, we will re-evaluate our positioning and holdings when institutional traders return to their desks next week.
However, as a reminder:
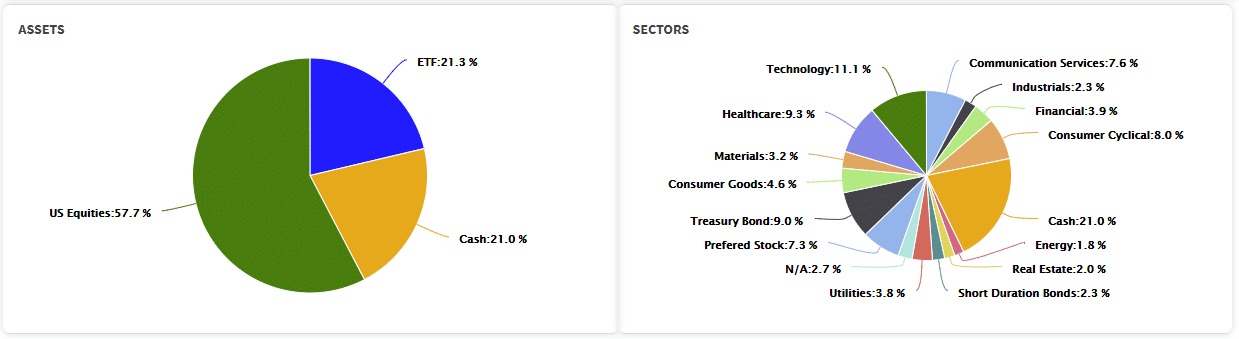
“Over the last two weeks, we took profits in overbought and extended equities. We also shortened our bond duration by trimming our longer-duration holdings. Such actions rebalanced portfolio risk short-term. In addition, we run a 60/40 allocation model for our clients; such left us slightly underweight equities and bonds and overweight cash.”
Despite the sell-off on Friday, the bullish bias remains strong. We also remain in the “seasonally strong” period of the year, and the seemingly endless supply of money continues to flood into equities.
However, as discussed most of this week, mutual fund distributions will begin in earnest and continue through the second week of December. Such suggests we could see some additional volatility and potential weakness in the market as those distributions get made.
Critically, any correction will provide a decent entry point for the year-end “Santa Claus” rally and the first week of January, which tend to be strong. Therefore, we will try and take advantage of that.
While Friday’s plunge likely shocked you out of your “tryptophan-induced” coma, I hope you had a Happy Thanksgiving.
Market & Sector Analysis
Analysis & Stock Screens Exclusively For RIAPro Members
Discover All You Are Missing At RIAPRO.NET
Come find out what our RIAPRO.NET subscribers are reading right now! Risk-Free For 30-Day Trial.
- Sector & Market Analysis
- Technical Gauge
- Fear/Greed Positioning Gauge
- Sector Rotation Analysis (Risk/Reward Ranges)
- Stock Screens (Growth, Value, Technical)
- Client Portfolio Updates
- Live 401k Plan Manager

See you next week.
By Lance Roberts, CIO


