Recession Alert Confirmed By NFIB


Inside This Week’s Bull Bear Report
- Inflation Data Keeps Fed On Pause
- Recession Alert
- How We Are Trading It
- Research Report – Minimum Wage & The Fed’s Fear
- Youtube – Before The Bell
- Stock Of The Week
- Daily Commentary Bits
- Market Statistics
- Stock Screens
- Portfolio Trades This Week
Inflation Data Keeps Fed On Pause
The latest NFIB data sends a recession alert, and the inflation data will likely keep the Fed on pause for now. However, the stock market hopes for a return to monetary accommodation. Unfortunately, both can’t be right.
This week, both the CPI (consumer price index) and PPI (producer price index) showed inflation continues to decline as year-over-year comparisons become much easier. With the bulk of the high inflation rates caused by the shutdown behind us, inflation will continue to trend lower back to the long-term 2% target, which will align with lower economic growth rates in the future.
What was most notable was the massive collapse in the spread between CPI and PPI. That collapse has both bullish and bearish implications. From a bullish perspective, sharp declines in the spread have historically correlated to market lows, as expectations are that lower inflation will boost consumer spending. (Increasing spreads typically correlate with higher asset prices.)
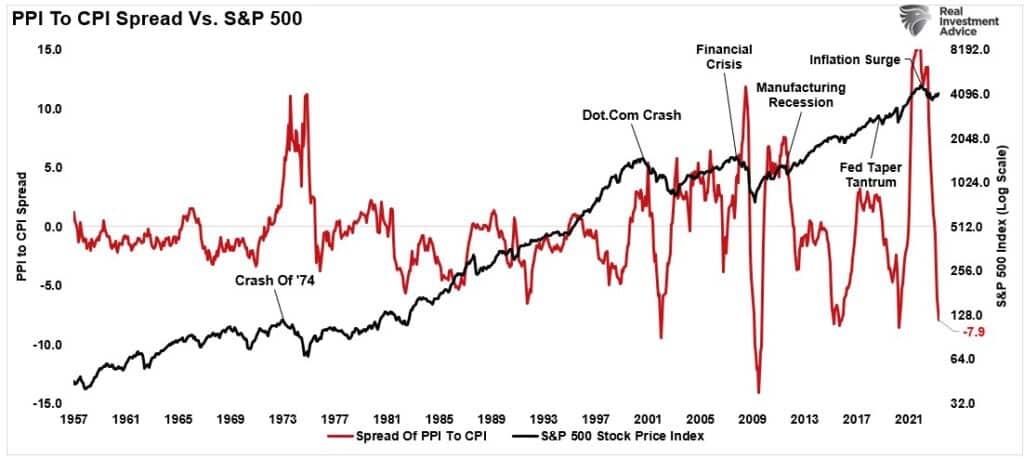
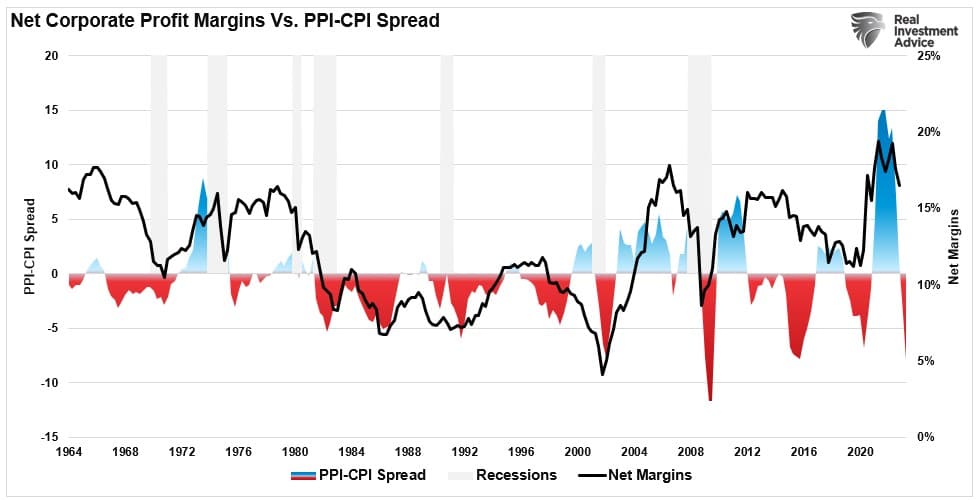
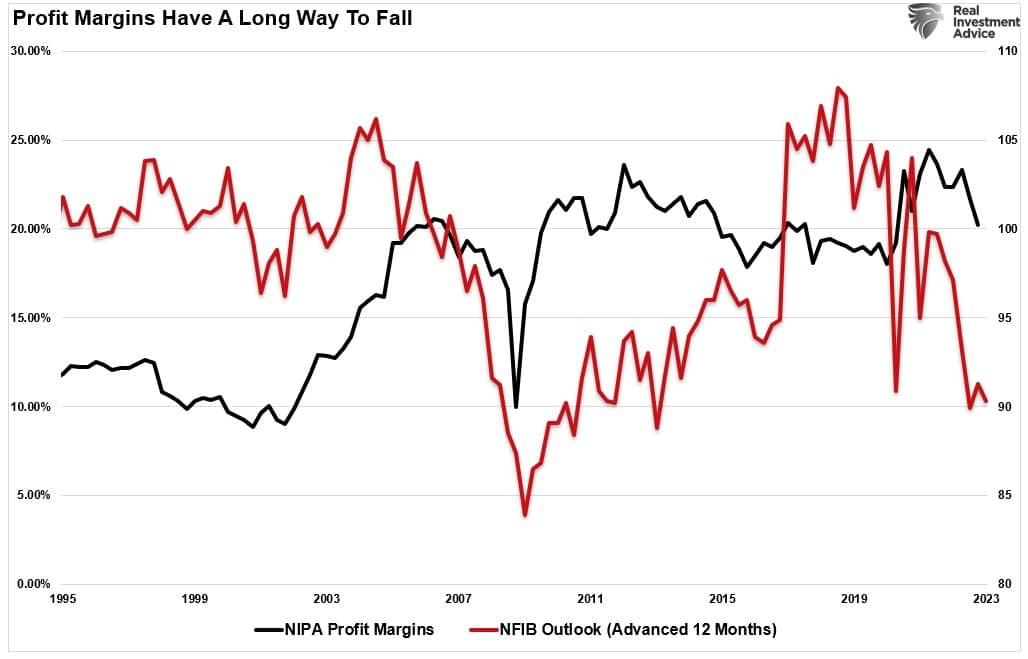
The bearish side of the collapse is that it suggests that companies’ net profit margins will likely remain under pressure as the ability to pass on higher costs will become more challenging.
We have not fully resolved the inflation issue yet, so the market’s upside will likely remain capped for a while longer. Of course, such aligns with our comments from last week’s newsletter. To wit:
The market remains on a “sell signal” and again tested and held critical support at the 50-DMA and the downtrend support line from the April highs. The consistent test and holding of support remain bullish overall, and unless or until that is broken, the more bearish concerns are secondary.
With our sell signals still intact, we remain cautious for now. We noted last week that the “upside may be somewhat limited,” which was the case. However, we are now approaching more oversold levels with technically strong support. If we see an improvement in the price action, we suggest increasing exposure again accordingly. However, for now, that is not the case.”
This week, such was the case as the market again struggled within a relatively tight trading range. Despite many bearish headlines, from more potential bank failures to weaker economic data, the market continues to trade bullishly. With moving averages sloping higher and downtrend support levels holding, we continue to grind away our current sell signal. It is important to remember that a market can correct excesses in two ways. The first is by declining in price. The second is by consolidating sideways.

So far, the correction has come as a consolidation, with the market continuing to cling to support at the 20-DMA. The rising trend line from the October lows is apparent as buyers step in on dips.
Nonetheless, there are still many concerns as to the viability of the “bull market.” The latest concern comes from the most recent NFIB data, which sent a “recession alert.”
Such is the topic we will dig into further today.
Need Help With Your Investing Strategy?
Are you looking for complete financial, insurance, and estate planning? Need a risk-managed portfolio management strategy to grow and protect your savings? Whatever your needs are, we are here to help.

NFIB Data Sends Recession Alert
The most recent NFIB (National Federation Of Independent Business) sent a “recession alert” that is certainly reason for concern. I say that because the small business data survey has repeatedly provided good economic signals.
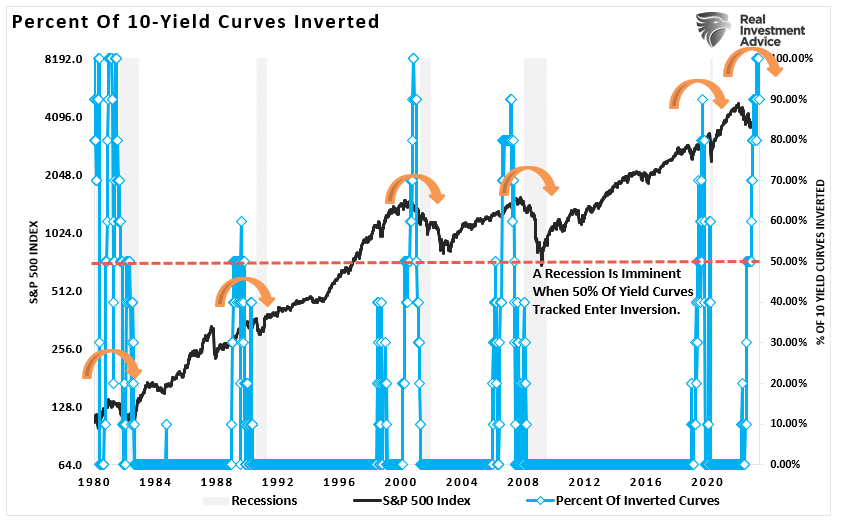
For instance, in 2019, the NFIB survey and an inverted yield curve suggested an impending recession. In 2020, those signals became a reality.
As in 2019, we see many of the same warning signals from the NFIB survey again combined with a high percentage of yield curve inversions. Notably, out of the ten yield spreads we track, which are the most sensitive to economic outcomes,100% are inverted as of the end of April.
So far, the problem with the “recession alerts” is that there hasn’t been one. Such has now started to pull more of the mainstream economists into the camp of the “no recession” scenario.
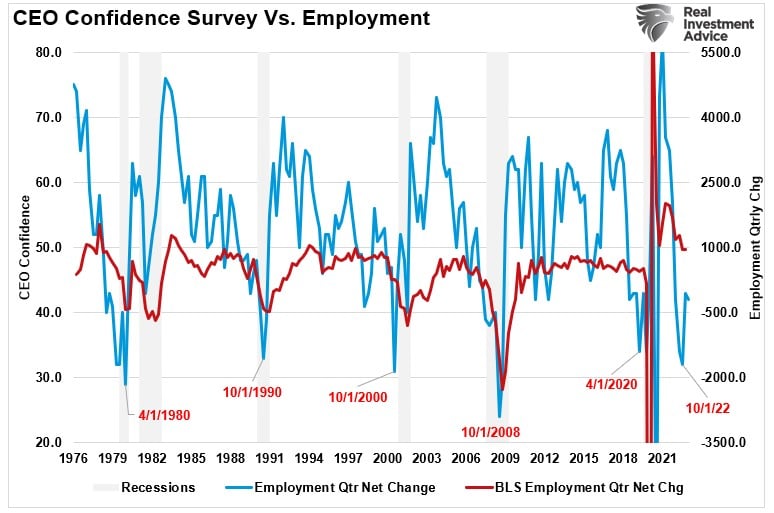
One of the reasons for the hopes of a “soft landing” scenario remains squarely pinned on the consistently strong employment reports. It is worth noting that while those employment reports remain strong, we should consider the rapid decline in employment growth. As stated, the data trend tends to be far more critical than the monthly number.

The rapid decline in the 3-month employment growth average coincides with the sharp drop in CEO confidence. Notably, the CEO confidence gauge usually leads the trough in employment reductions. Such suggests we may see continued weakness in employment growth over the next few quarters.
As noted, these “recession alerts” are further confirmed by the latest NFIB survey. Since small businesses employ roughly 50% of the working population, the survey can tell us much about the state of the economy versus the data from Government sources.
Non-Confidence
In April, the survey declined to 89, the lowest reading in the last decade. While that may not sound like much, it is where the deterioration is occurring that is most important.
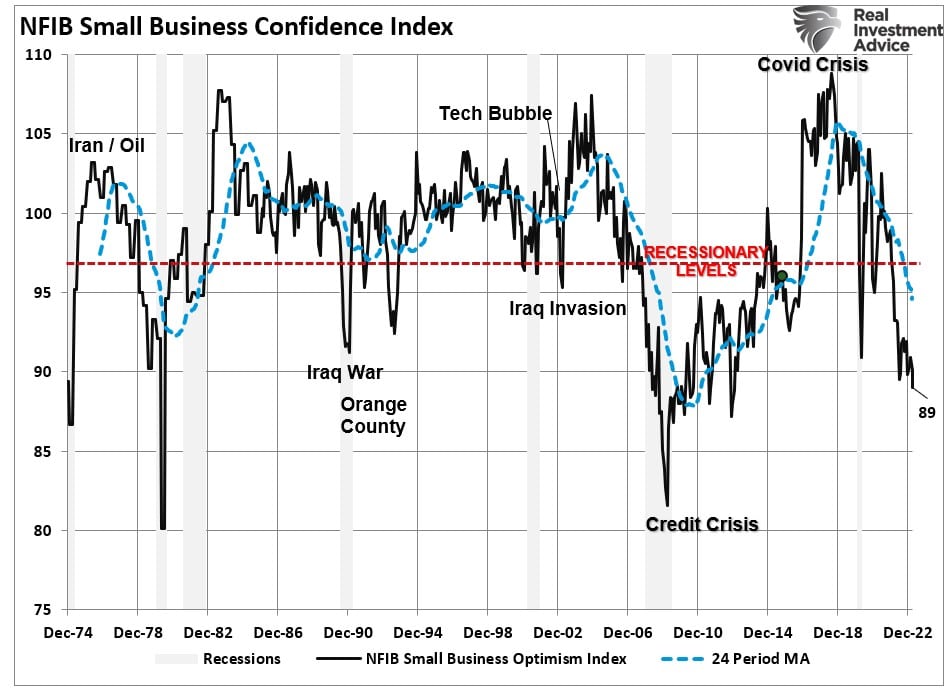
As noted by the NFIB in their monthly commentary:
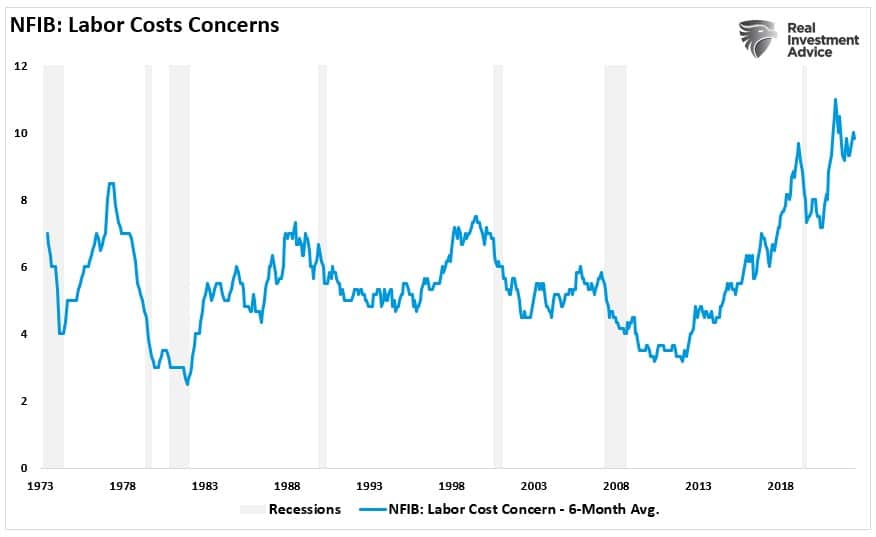
“Defaults will rise as the economy weakens but hopefully not at pandemic levels. The manufacturing sector appears to be in contraction (ISM<50). The service sector is still in growth mode, but much weaker (ISM 51.2, down 3 points). Main street firms have been pessimistic for the last 18 months, with the NFIB Optimism Index at 89 (49 year average = 98). Price raising activity has slowed but remains historically high, and reports of higher labor compensation are sticky at historically high levels. This will make inflation sticky as labor costs are the major operating cost of small firms, especially in the service sector. The economy seems inclined to slow down and this will make raising prices harder and slow inflation. Maybe it’s time for the Fed to pause and let nature (markets) take its course.”
There is much to unpack in that statement. However, tighter bank lending standards have always been a strong “recession alert” signal as it correlates with changes in retail sales. (Retail sales comprise roughly 40% of PCE, which is 70% of the GDP calculation.)
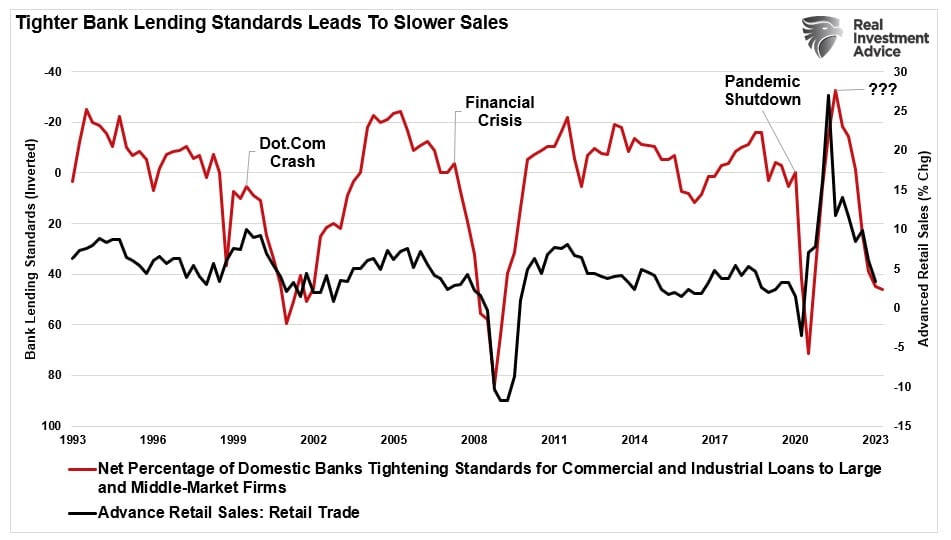
Specifically, as it relates to small businesses, that are heavily dependent on every sale, actual and expected sales have declined sharply from the 2018 peak. We will likely continue to see weakness in the consumer over the coming months, which, as noted, has economic consequences.
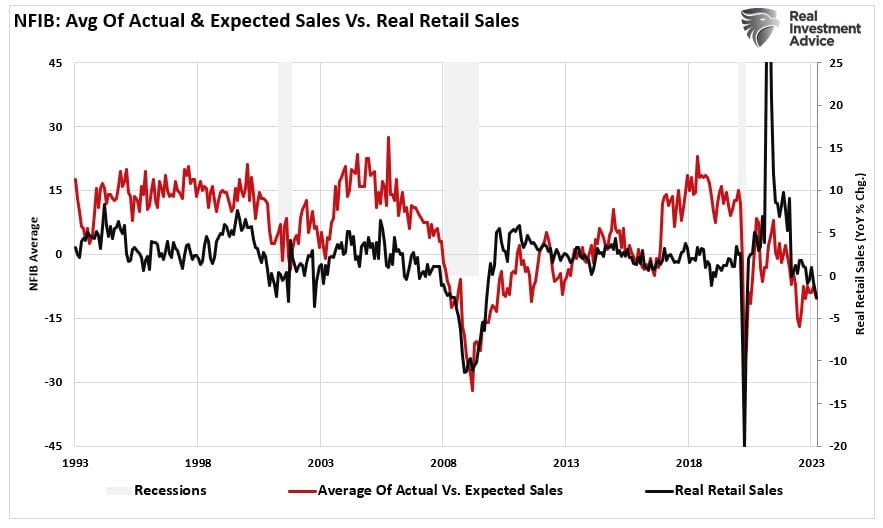
Considering that sales generate any business’s revenue and profits, the decline in sales will further impact profitability. As shown, the drop in “confidence” as economic concerns rise suggests that profits are under attack.
As such, business owners will take actions to maintain profitability through various actions, from cost-cutting to layoffs. Since labor costs are the most significant expenses to any business and the area of most concern, further employment reductions will be unsurprising. Labor cost reductions are a key “recession alert” worth paying attention to.
Of course, this suggests that employment is likely weaker than the BLS report suggests. There is a critical point to remember regarding “sentiment-based” surveys like the NFIB.
“Planning” to do something is a far different factor than actually “doing” it.
For example, the survey stated that 17% of business owners are “planning” to increase employment in the next few months. That sounds positive until you look at the trend, which is negative. Furthermore, there is a massive gap between those “plans” and what occurred. Such is one of the many problems with the “job openings” data reported each month. Just because they have a job opening does NOT mean they will fill it.
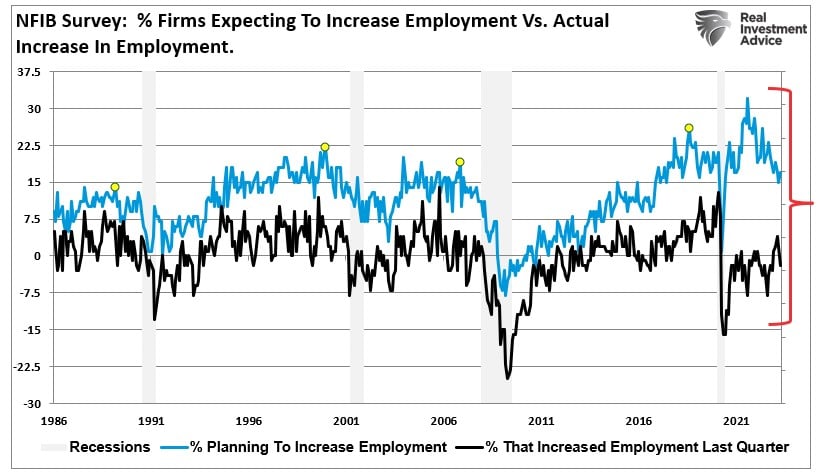
Since business owners are sensitive to economic risk, the rise in NON-Confidence in the NFIB survey suggests that more defensive actions are probable in the months ahead. Such is particularly evident when it comes to the overall economic outlook.
Another Brick In The (GDP) Wall
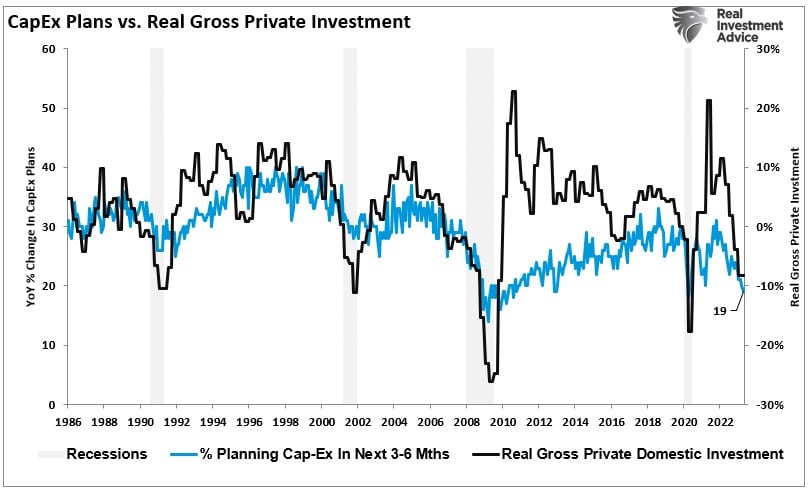
As noted above, retail sales feed directly into the GDP calculation. Another “recession alert” from the NFIB survey hits another component of the GDP calculation, which is “private investment” or “business spending.” As I noted previously:
“Business investment is a crucial component of the GDP calculation. Small business “plans” to make capital expenditures, which drive economic growth, correlate highly with Real Gross Private Investment.“
There are two critical points in the chart below.
- CapEx plans continue to erode after each recession.
- The current decline in CapEx plans has exceeded the lows of the economic shutdown and recession.
As noted in the NFIB survey:
“Nineteen percent plan capital outlays in the next few months, down 1 point from March and historically very weak.“
Given the correlation between weak capital expenditures and recessionary periods in the economy, such suggests the rash of analysis suggesting a “soft landing” is a sentiment not shared by the NFIB survey. The linkage between the economic outlook and CapEx plans confirms that business owners are concerned about committing capital in an uncertain environment. While the mainstream media may be more optimistic about the “economy,” business owners remain unwilling to “bet” their capital on it.
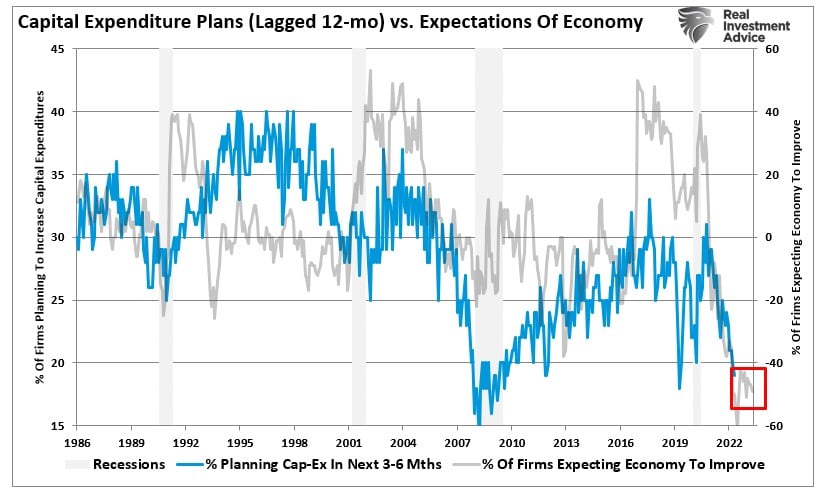
Not surprisingly, there is a high correlation between capital expenditure plans and economic outlooks. Since business owners are the “boots on the ground” for the economy, their perspective tends to be a very accurate leading indicator. Notably, their current outlook does not support the idea of avoiding a recession in 2023.
The Market Or The Data
While the “recession alerts” from various sources suggest a forthcoming recession, the market continues to trade more bullishly.
The market is often said to be a leading indicator of the economy. Therefore, market participants are suggesting an economic recovery is at hand. A case can be made that data has become SO negative that even economic stabilization may start turning sentiment-based surveys more optimistic.
Earnings, at least so far in Q1, have appeared to trough. Furthermore, the outlook improved on the corporate front, suggesting more robust economic activity later in the year. At least, that seems to be the hope, but the NFIB data certainly throws some shade on that.
No one knows the timing of the recognition of the next recession, but the number of “recession alerts” indeed suggests an elevated risk.
Could this time be different? Absolutely. However, the last time the NFIB Signals were this weak, the Government started sending checks to households, and the Fed introduced $120 billion in monthly “QE.” Furthermore, Treasury bond rates fell to 0.5% as the Fed scrambled to buy junk bond ETFs.
No two recessions are ever the same. However, suppose the economy does falter, and companies continue to take more defensive actions to offset the risk of the decline. In that case, it is difficult to fathom how stock market prices avoid repricing somewhat lower to accommodate falling earnings.
But then again, anything is possible, making navigating the current market environment challenging.
How We Are Trading It
Not much has changed with our analysis of the market since last week. We remain on hold, with the broader market still on a sell signal.
With our sell signals still intact, we remain cautious for now and still think, as noted above, that the “upside may be somewhat limited,” which remains the case. However, as reported last week, we are beginning to approach more oversold levels with technically strong support. Therefore, we did increase our equity exposure slightly and increased the duration of our bond portfolio somewhat. These are tiny moves to align the risk profile of portfolios to the market. If we continue to see an improvement in the price action, we will increase exposure further.
For now, continue to use reflexive rallies to rebalance equity risk heading into the summer months. While the Fed is done hiking rates, the lag effect of the previous hikes is still working its way through the system.
The bullish technicals but bearish fundamentals continue to make this a challenging market. As such, we continue to make small movements while erring to the side of caution. That careful positioning is penalizing our performance so far this year. While we are not enthused about that, we will accept near-term underperformance to hedge against a more significant downturn later. Reallocating cash and fixed-income holdings into equity risk is always easy when needed. Trying to recoup more severe losses is a far more challenging prospect.
How you manage your portfolio is up to you. This is just how we are approaching the market for the time being.
Have a great week.
Research Report

Subscribe To “Before The Bell” For Daily Trading Updates (Formerly 3-Minutes)
We have set up a separate channel JUST for our short daily market updates. Please subscribe to THIS CHANNEL to receive daily notifications before the market opens.
Click Here And Then Click The SUBSCRIBE Button
Subscribe To Our Youtube Channel To Get Notified Of All Our Videos
Stock Of The Week In Review
As the push for a green-energy transition gains popularity, producers of traditional fossil fuels have a disincentive to invest in production growth. Coupled with recently surging profits and attractive money-market rates spurred by the Fed’s fight against inflation, major energy companies are building sizable cash piles. As shown below, two U.S. majors- XOM and CVX, have shifted to a preference for returning excess cash to shareholders in recent years.
This week’s screen attempts to find large energy companies with a high potential for returning capital to investors through share buybacks. We look at Price/Free Cash Flow for the ability to generate cash on a continuing basis, P/S for a low valuation, and LT Debt/Equity for a favorable leverage ratio. A reasonable leverage ratio is vital since companies with high leverage, like Buffet’s OXY, may prioritize paying down debt over returning cash to shareholders.
Here is a link to the full SimpleVisor Article For Step-By-Step Screening Instructions.

Login to Simplevisor.com to read the full 5-For-Friday report.
Daily Commentary Tidbits
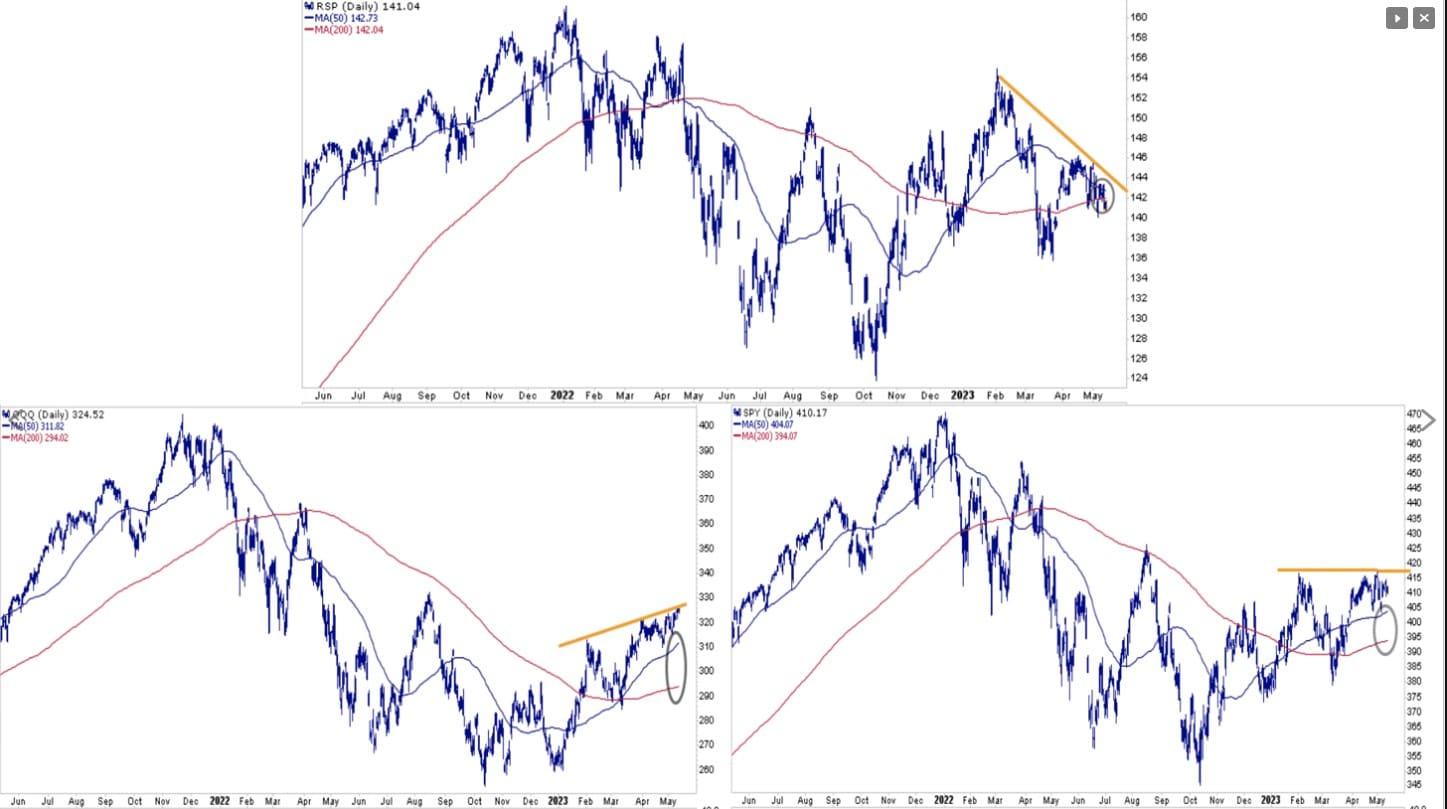
How Long Until The Fed Cuts Rates
Three well-followed market indexes provide investors with three different tales. These tales are a function of the narrow market breadth in which a small handful of the largest stocks lead the way higher. The Nasdaq 100 (QQQ), in which these stocks carry the most weight is bullish. It keeps setting higher highs, its 50dma is above its 200dma, and both moving averages trend upwards. The S&P 500 (SPY) is moderately bullish, with its moving averages trending up but failing to hit higher highs. Lastly, the equal-weighted S&P 500 (RSP) is providing bearish indications. It’s been setting a series of lower highs. More concerning, its downward trending 50dma will potentially cross below the 200dma in what technicians call a death cross.
Which tale is the best indicator of what will come? If the market can maintain its bullish bias and a broader array of stocks participate in the upside, RSP should break the downward trend and possibly avoid the death cross. In that scenario, SPY will break above the flat resistance line, which will also be bullish. Conversely, the top ten or so stocks responsible for nearly 100% of this year’s S&P 500 gains could reverse lower. If most stocks in the indexes follow them lower, it would be bearish for all three indexes.
(Subscribe To The Daily Market Commentary For A FREE Pre-Market Email)
Bull Bear Report Market Statistics & Screens

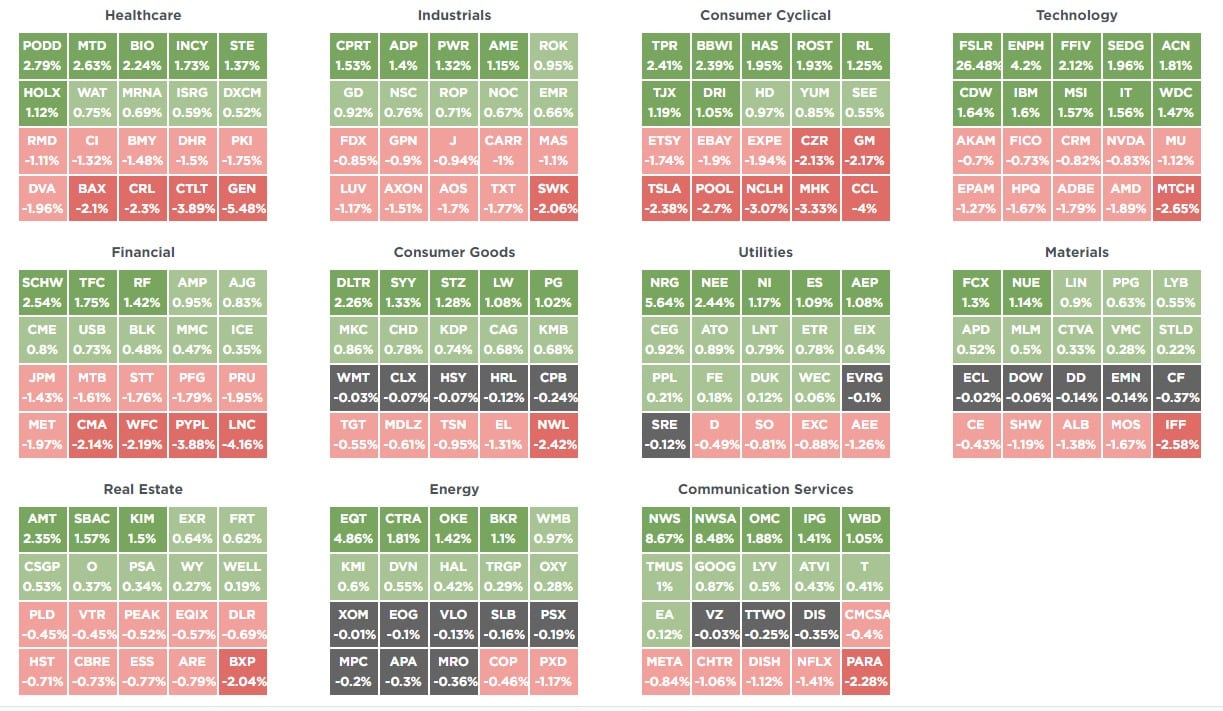
SimpleVisor Top & Bottom Performers By Sector
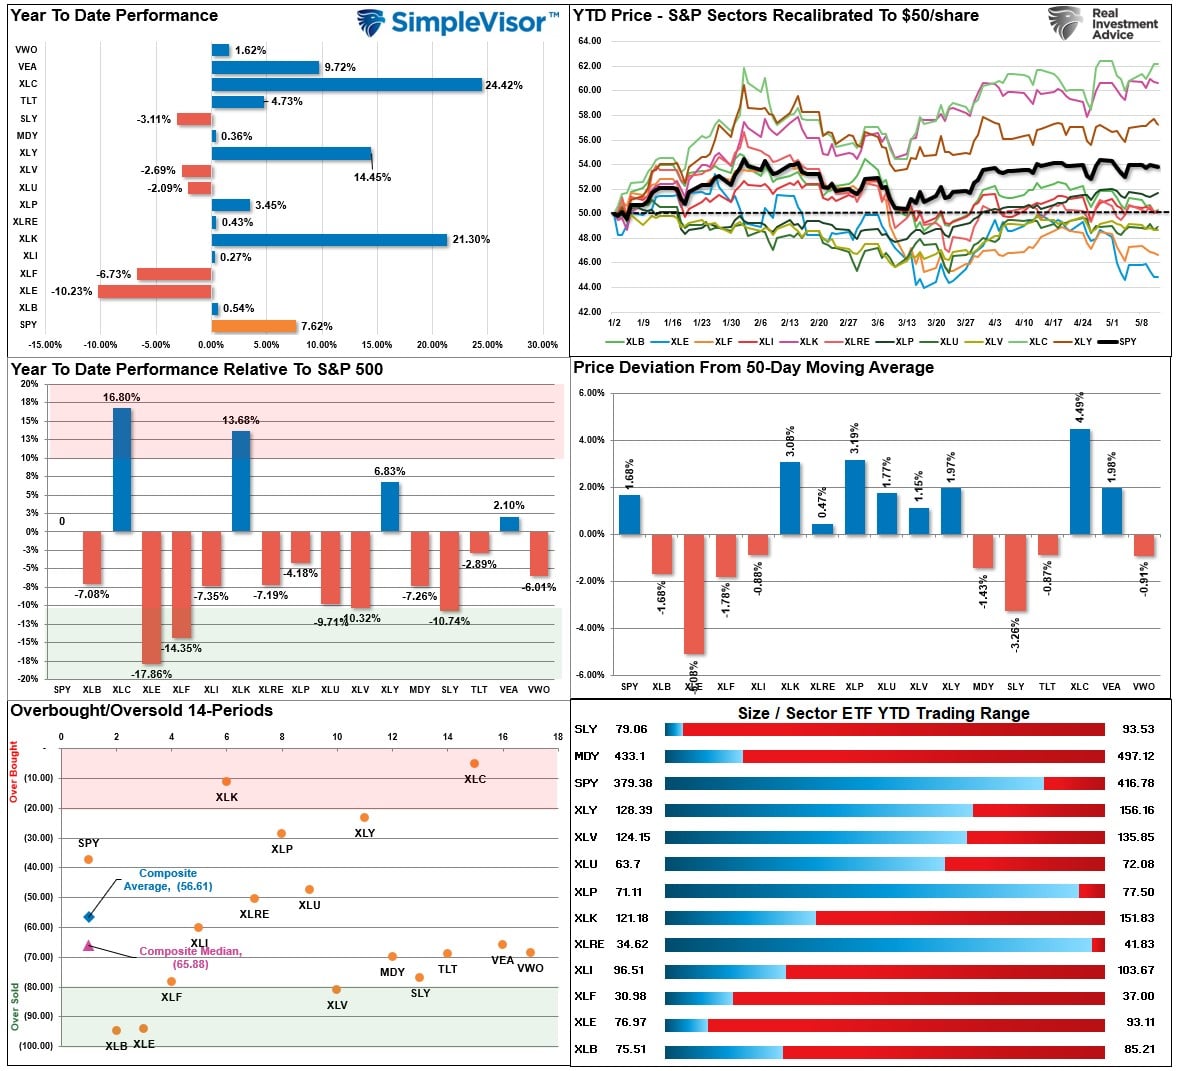
S&P 500 Weekly Tear Sheet
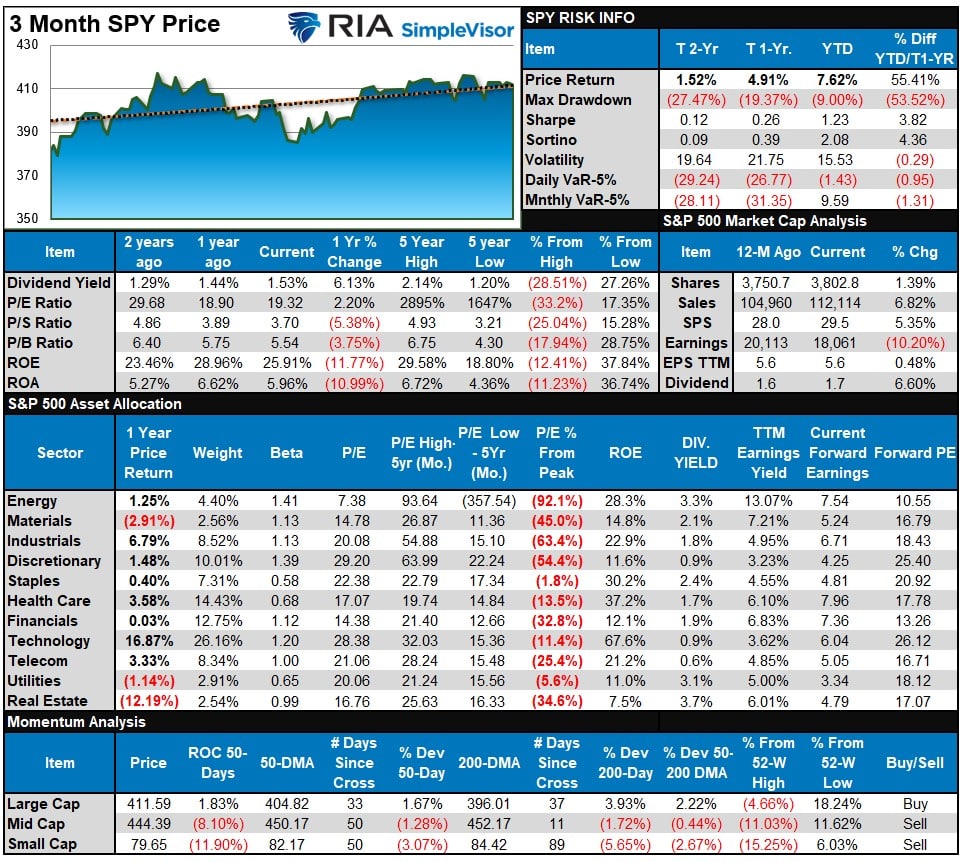
Relative Performance Analysis
Not much changed in the market over the past week as stocks mainly meandered sideways. Technology and Communications remain overbought, with Energy and Basic Materials getting more oversold. Overall, the market continues to grind through a consolidation cycle without a clear direction momentarily. I would expect more of the same next week as market sell signals remain intact.
Technical Composite
The technical overbought/sold gauge comprises several price indicators (RSI, Williams %R, etc.), measured using “weekly” closing price data. Readings above “80” are considered overbought, and below “20” are oversold. The market peaks when those readings are 80 or above, suggesting prudent profit-taking and risk management. The best buying opportunities exist when those readings are 20 or below.
The current reading is 66.14 out of a possible 100.

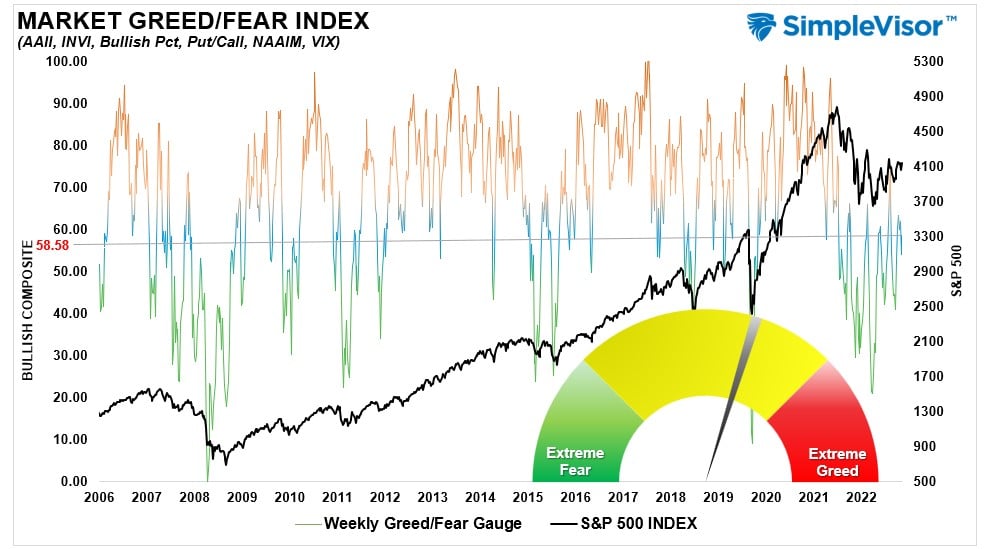
Portfolio Positioning “Fear / Greed” Gauge
The “Fear/Greed” gauge is how individual and professional investors are “positioning” themselves in the market based on their equity exposure. From a contrarian position, the higher the allocation to equities, the more likely the market is closer to a correction than not. The gauge uses weekly closing data.
NOTE: The Fear/Greed Index measures risk from 0 to 100. It is a rarity that it reaches levels above 90. The current reading is 58.58 out of a possible 100.
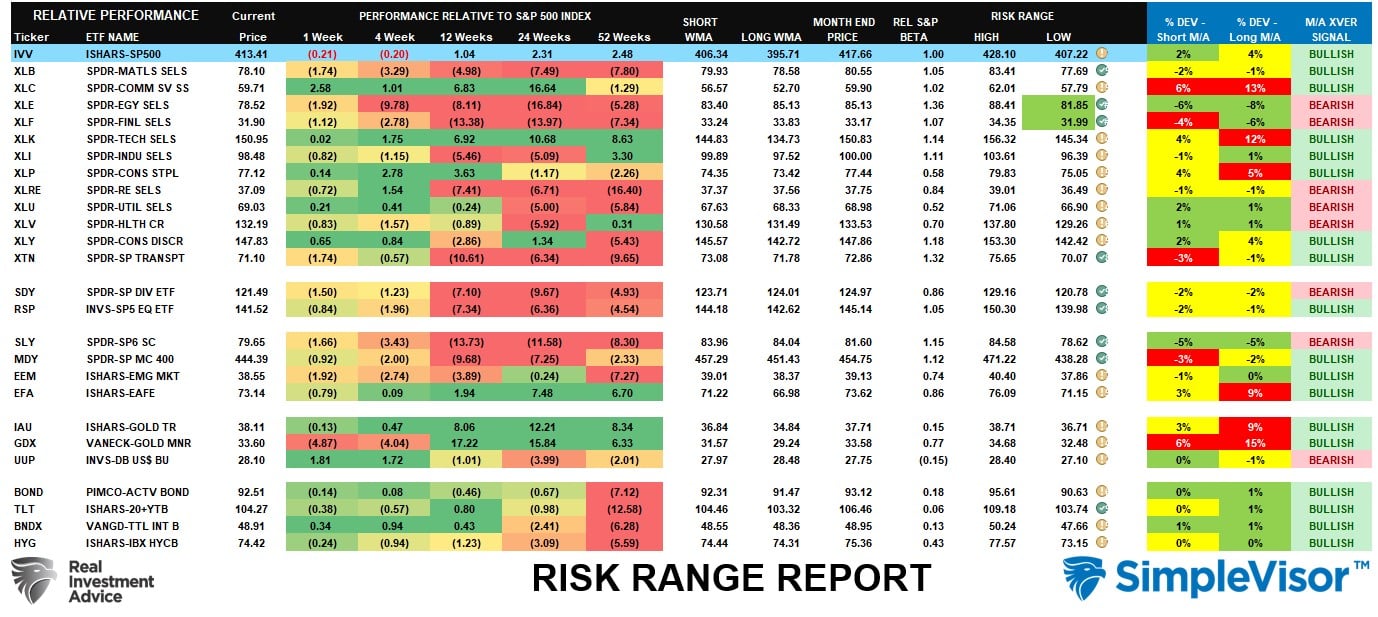
Sector Model Analysis & Risk Ranges
How To Read This Table
- The table compares the relative performance of each sector and market to the S&P 500 index.
- “MA XVER” (Moving Average Cross Over) is determined by the short-term weekly moving average crossing positively or negatively with the long-term weekly moving average.
- The risk range is a function of the month-end closing price and the “beta” of the sector or market. (Ranges reset on the 1st of each month)
- The table shows the price deviation above and below the weekly moving averages.
The market remains bullish, with Technology, Discretionary, and Communications continuing to lead the way. Financials, Energy, Real Estate, Utilities, and Health Care remain on bearish crossovers, which suggests we may continue to see underperformance in the near term from those areas. Fixed income has registered a bullish moving average crossover indicating bonds should continue performing better, particularly once the debt ceiling debate is resolved.
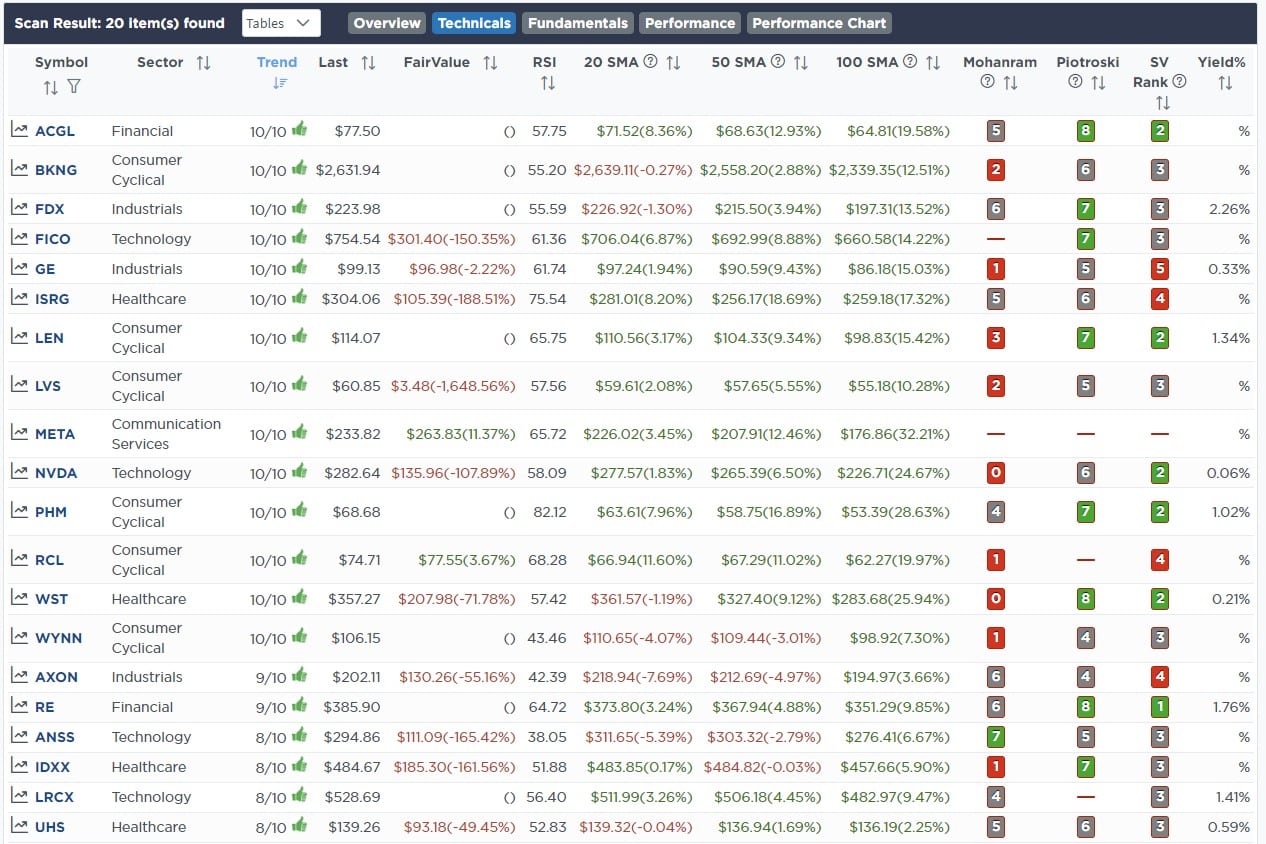
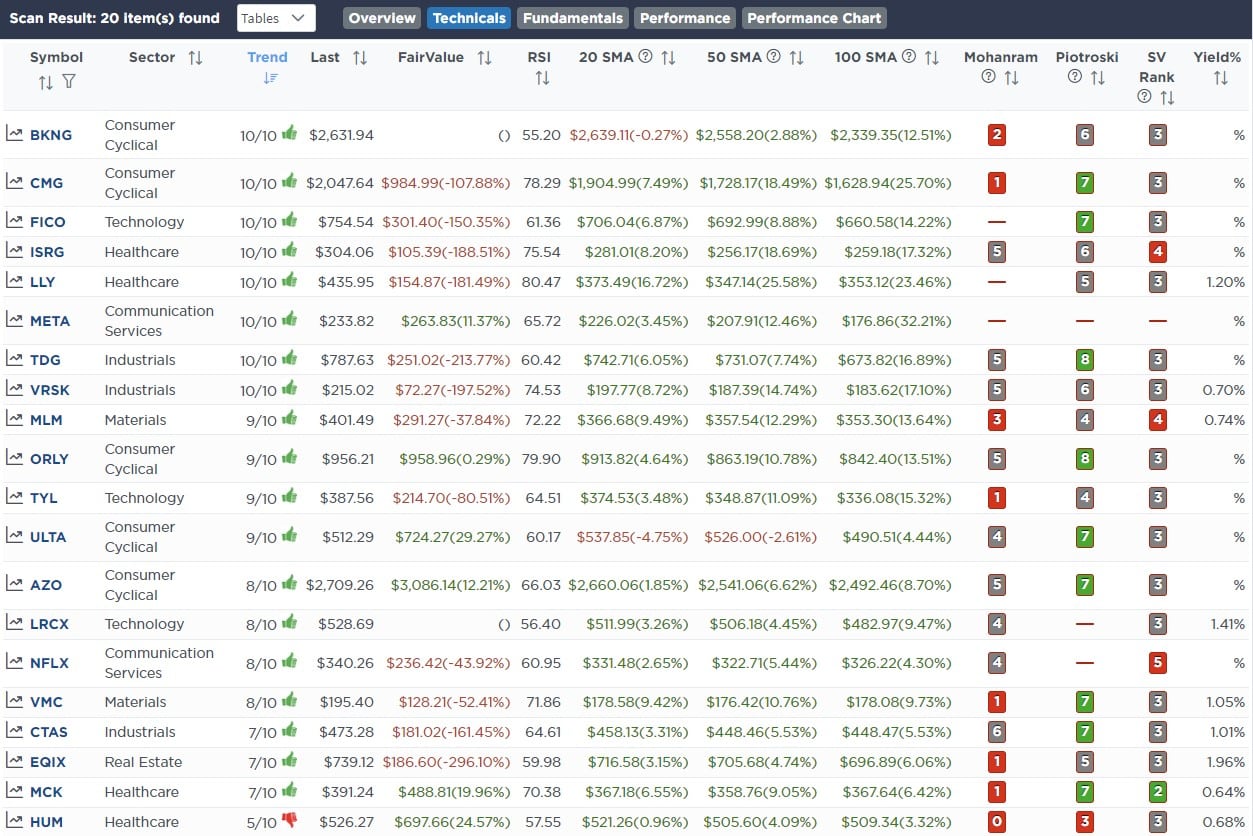
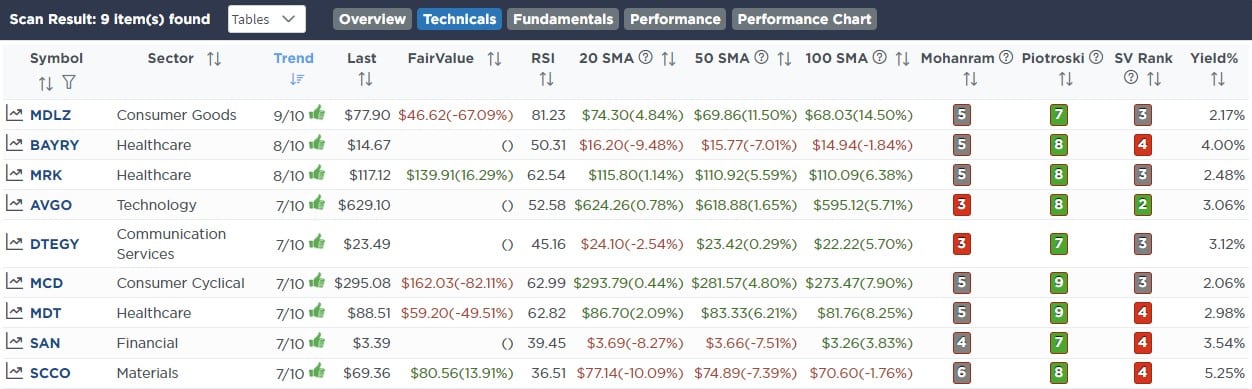
Weekly SimpleVisor Stock Screens
We provide three stock screens each week from SimpleVisor.
This week we are searching for the Top 20:
- Relative Strength Stocks
- Momentum Stocks
- Technically Strong Stocks With Dividends
(Click Images To Enlarge)
RSI Screen
Momentum Screen
Technically Strong With Dividends
SimpleVisor Portfolio Changes
We post all of our portfolio changes as they occur at SimpleVisor:
May 9th
This morning we added 1% of AMD and XLK. As we have discussed on both our daily podcasts and weekly newsletter, we want to add large-capitalization technology exposure to portfolios that will benefit from both the rise in Artificial Intelligence and a disinflationary environment. While we continue to look for an opportunistic entry point to re-enter Nvidia (NVDA), Advanced Micro Devices (AMD) has registered a buy signal and is not nearly as extended as NVDA.
In the sector model, we may eventually sell some of our current iShares Technology Index (XLK) and add the iShares Semiconductor ETF to gain more direct exposure to these companies. Unlike NVDA, which is 3 standard deviations overbought, AMD is 10% off recent highs and well off the late 21 highs. It is also forming a series of constructive higher highs and higher lows.
AMD is a starter position, and we are hoping for pullbacks in the coming weeks or months to add to our position.
Equity Model
- Initiate a 1% position in Advance Micro Devices (AMD)
ETF Model
- Increase the current iShares Technology Sector ETF (XLK) to 8% of the portfolio.
May 10th
We have successfully traded Albemarle (ALB) over the last couple of years, initially buying shares at $158.54 and selling the last at $215.70. After the recent correction, we are again entering a starter position in the company. We hope to get some initial weakness back to recent support to add to our holdings.
Given the long-term demands for lithium in the future, the recent correction in the stock price gave us a compelling entry point with a fairly tight stop loss at recent lows.
Equity Model Only
- Initiate a 1% position of the portfolio into Albermarle (ALB)
May 12th
We added a little duration to our bond sleeves and better balanced them this morning. We held off on adding the more volatile TLT due to the potential price swings around the debt cap. We bought 6% of IEI (3-7yr UST) and sold 6% of TFLO to make room for it.
The weighted average duration of our portfolio is now almost a year greater than our benchmark. That said, we only hold Treasury bonds, while AGG has corporate and MBS bonds. Given how tight corporate spreads remain, there is likely little upside to corporate spreads, and plenty of downside if the economy slows markedly.
Both Models
- Sell 100% of iShares Treasury Floating Rate Bond ETF (TFLO)
- Buy 6% of the portfolio into the iShares 3-7 Year Treasury Bond ETF (IEI)

Lance Roberts, CIO
Have a great week!


