Market Rallies To All-Time Highs As Bulls Dismiss Fed


In this 06-25-21 issue of “Market Rallies To All-Time Highs As Bulls Dismiss Fed.“
- Market Rally And Signal Conundrum
- Bullishness Is Back
- Hard Data Getting Soft
- Portfolio Positioning
- Sector & Market Analysis
- 401k Plan Manager
Follow Us On: Twitter, Facebook, Linked-In, Sound Cloud, Seeking Alpha
Are you worried about the potential for a market correction, a surge in inflation, or are you unsure how to invest for your retirement? We can help. If you are not yet a client and would like to discuss your portfolio construction, please schedule a time to meet with one of our advisors below.

Market Rallies To All-Time Highs
Well, that was undoubtedly an exciting bought of volatility. Last week, we reviewed our “signals” and the market sell-off.
“Well, not only did the highs not stick, but the 50-dma failed during Friday’s sell-off. The market closing at its lows suggests we could see some more selling early next week. The “good news,” if you want to call it that, is that the “sell signal” is moving quickly through its cycle. Such suggests that selling pressure may remain limited and may resolve itself by the end of June.”
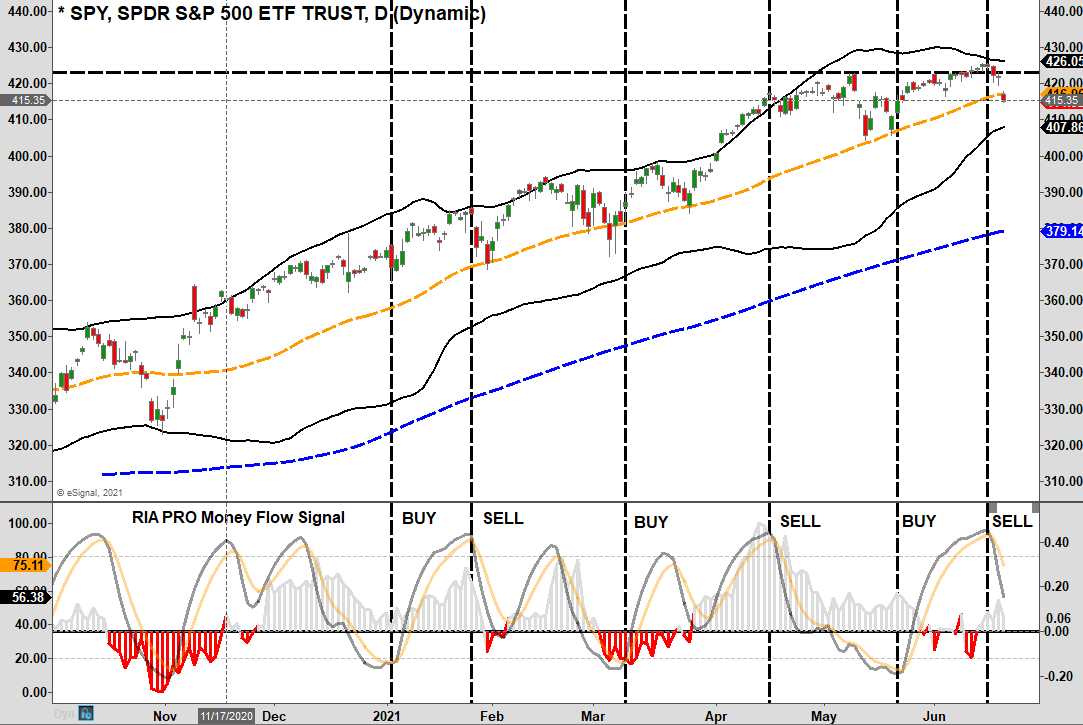
Well, this week, the market not only got off the mat but rallied back to new highs, just barely, as shown below.
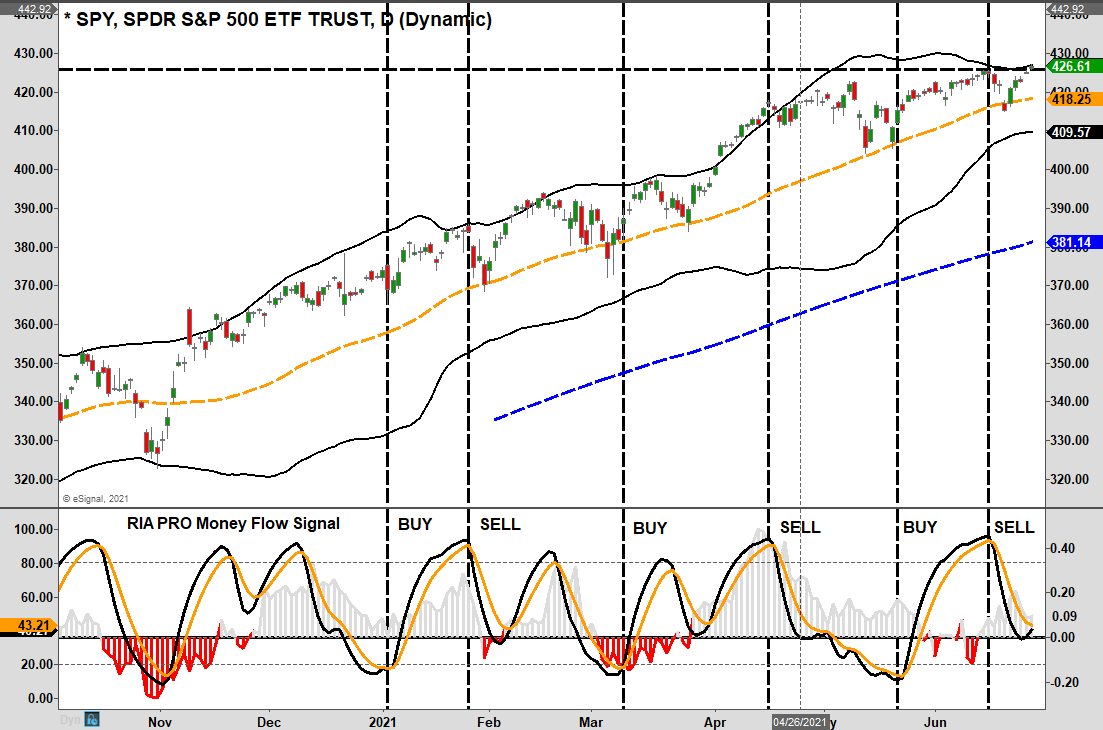
While the rally did get the “bulls” motivated, the declining “money flows” (grey histogram chart) suggest the rally is unlikely to stick. With the market back to 2-standard deviations above the 50-dma, conviction weak, and investors extremely bullish, the market remains set up for more consolidation or correction in the week ahead.
The weekly chart confirms the same. Our previous discussions warned that if the daily and weekly “sell signals” align, such often coincides with more “corrective” rather than “consolidative” actions. If the “daily” signal triggers a “buy” next week, such would indicate a limit to the upside, and more consolidation.
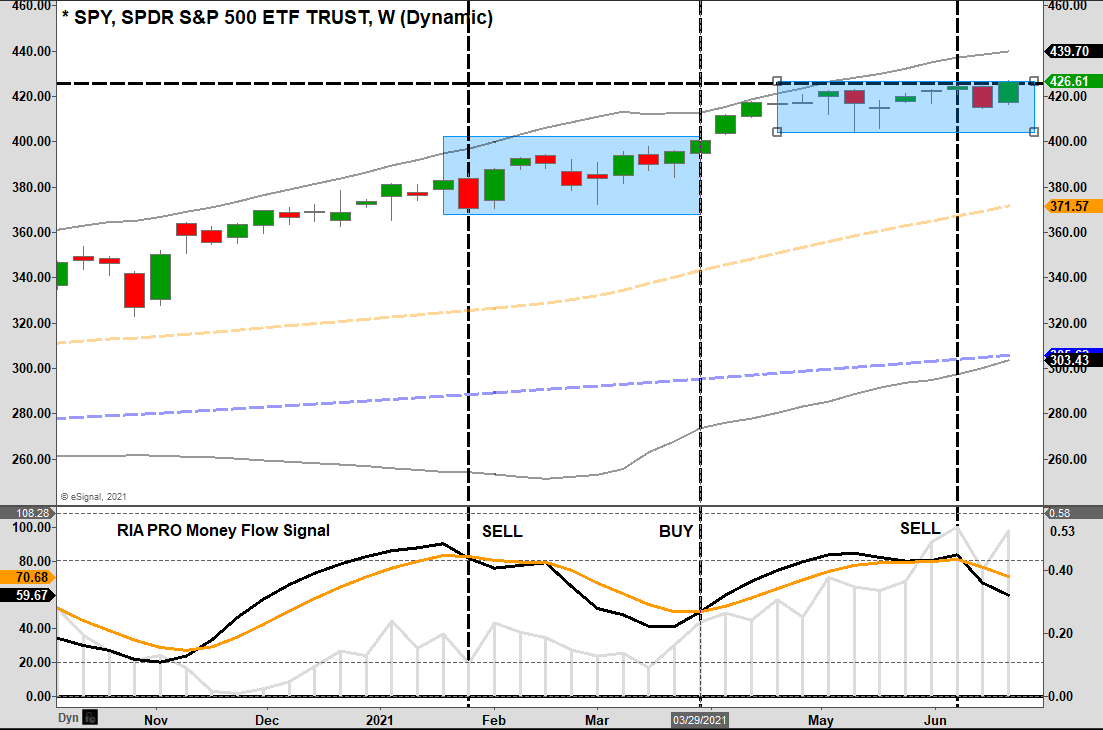
I got a few emails this week asking if I still think a 5-10% correction is possible?
The short answer is “yes.” However, it is not a guarantee that such will happen. If you notice in the weekly chart above, the market can consolidate over an extended period and reduce the “sell signal.” A “correction” makes it happen faster. It is also worth noting that corrections can come after “sell signals” are triggered. Thus, they are not always immediately correlated.
Sell Signal Conundrum
As we have laid out repeatedly over the last few weeks, there are several important points concerning technical analysis.
- Technical analysis is not always 100% accurate. We look for our indicators to be correct about 70% of the time, providing better risk management.
- Signals do not mean to be “all-in” or “all-out” of the market. As discussed, we reduced “risk” previously but still maintain a healthy exposure to markets.
- Just because the correction didn’t happen immediately doesn’t mean it won’t.
The last point I expand on in our latest 3-minutes video.
https://www.youtube.com/watch?v=gTtltv-dh-I
There are two other reasons we are cautious of this past week’s rally.
Volume was lacking, and seasonality is still at play.
“The implications are that we may see:
- A downdraft of some significance in the near-term
- Not a lot of new upside in the months ahead
- And a potentially bigger decline as we head into mid to late October
Is that how it will play out? Sorry folks, ‘climate, not weather,’ remember?
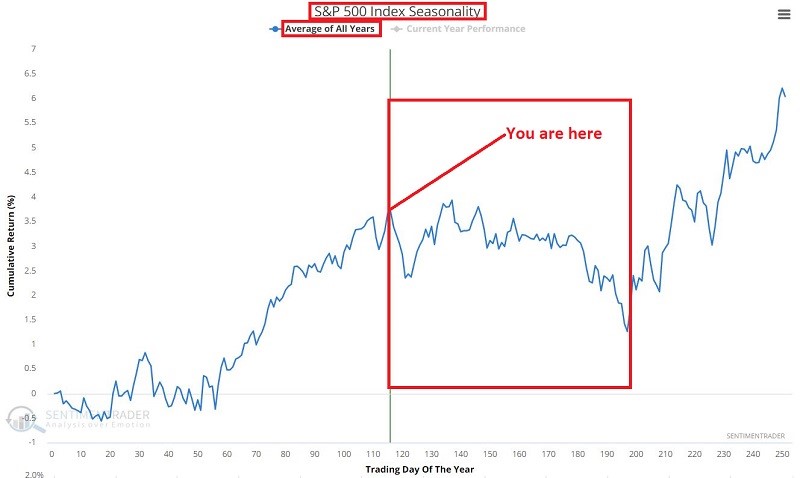
The stock market could easily rally to nominal new highs in the month ahead. However, do also note in the chart below that the S&P 500 Index has tracked its annual season fairly closely (in terms of the trend – and to a much greater magnitude) so far in 2021.
Will this continue? Same answer as the question above.” – Sentiment Trader
That view supports our current thesis of remaining slightly underweight equities for now. The market is likely to rally a bit from here for two reasons:
- End of the quarter “window dressing” by portfolio managers.
- The first two weeks of July tend to be seasonally strong before weakness reasserts itself.
We suggest remaining a little cautious but not overly defensive for now.

Bullishness Is Back
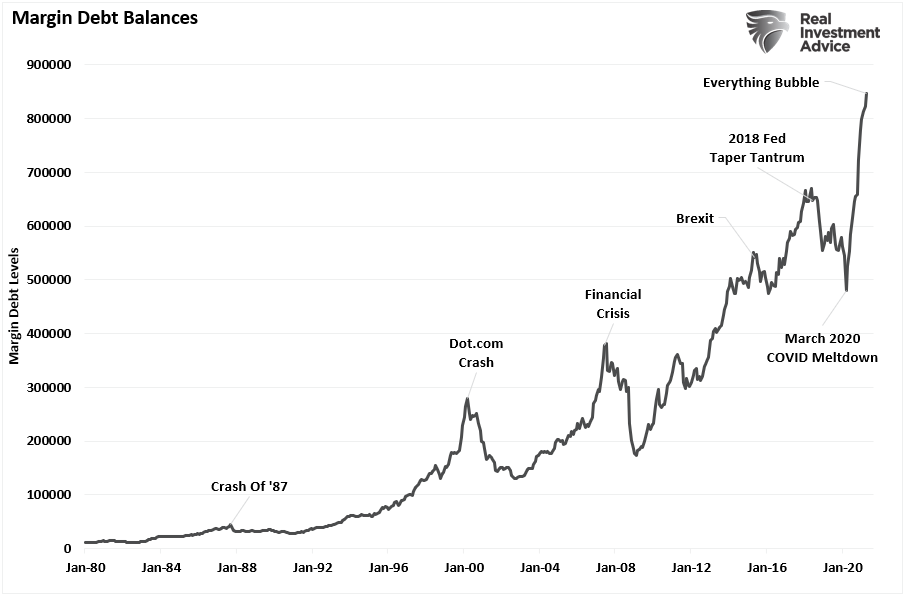
One thing about the market is the rather extraordinary amount of “bullish exuberance.” That exuberance often gets visualized, for example, by record margin debt levels.
However, some other “non-mainstream” indicators show the same. For example, a new survey from Natixis shows a clear example of “recency bias” at work.
“Wealthy Americans are pretty optimistic about their long-term investment returns, expecting to earn average annual returns of 17.5% above inflation from their portfolios.
That’s according to a new survey from Natixis that surveyed households that have over $100,000 in investable assets in March and April of 2021.”
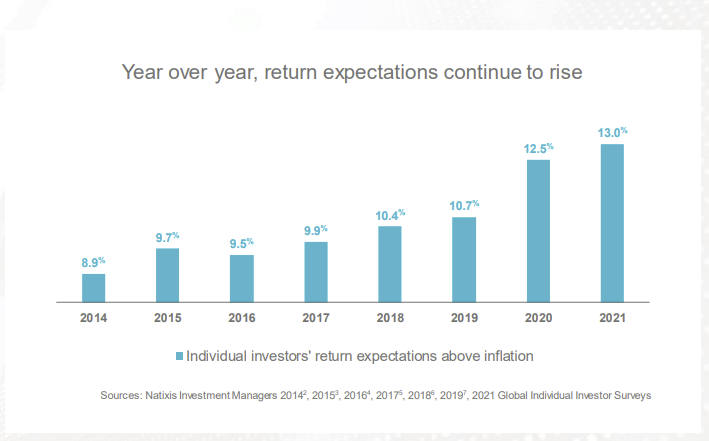
Of course, with inflation running roughly 5% in the second quarter, such suggests that investors are looking for more than 20% from the stock market by year-end.
But it isn’t just “recency bias.” It is also the “moral hazard” driven by the belief the Fed will continue to support markets indefinitely. The Bespoke “irrational exuberance” indicator subtracts the “Valuation Confidence” from the “One Year Confidence” survey data. This reading has exploded higher recently for both institutional and individual investors.
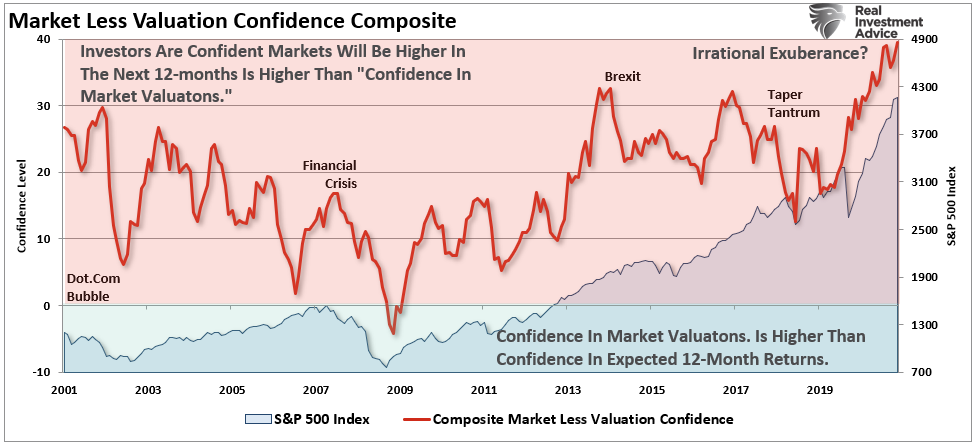
“When the reading is positive, it means confidence that the market will be higher one year from now is higher than confidence in the valuation of the market. The opposite is the case when the reading is in negative territory.” – Bespoke
The key takeaway is that “investors simultaneously believe the market is over-valued but likely to keep climbing.”
Why? Because the “Fed has investor’s backs.”
Of course, we would be remiss not to look at the level of household equity ownership as a percentage of their disposable personal income. The current deviation from the long-term exponential growth trend rivals every previous bubble in history.
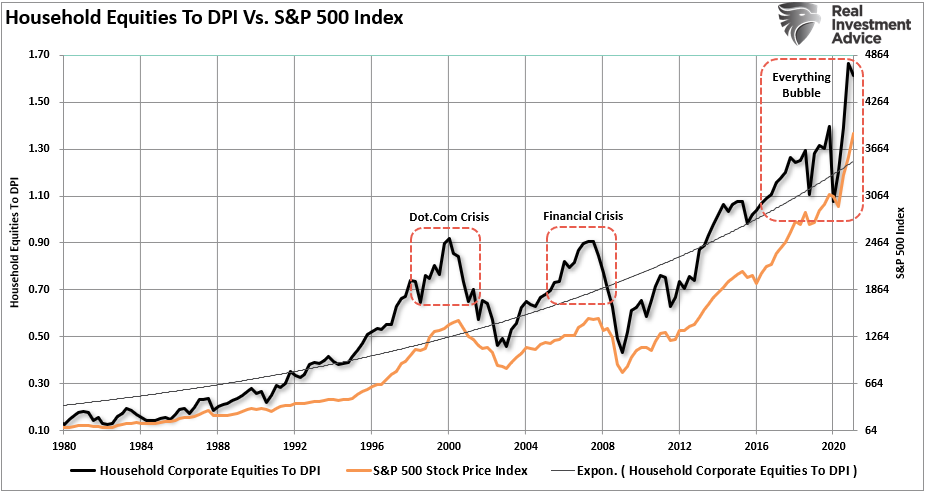
Yes, this time could be different. But, unfortunately, it just usually isn’t.
In Case You Missed It

Hard Data Getting Soft
The current market excitement remains a function of the “Fed” remaining accommodative and hopes of continued surging economic recovery. But, unfortunately, such is unlikely as the stimulus fades from the system.
“Ugly PMIs (Services recovery collapsed), and even uglier housing data suggest all is not well under the surface of the excellent recovery. The hope-filled gap between ‘soft’ and ‘hard’ data is set to slump again.” – Zerohedge
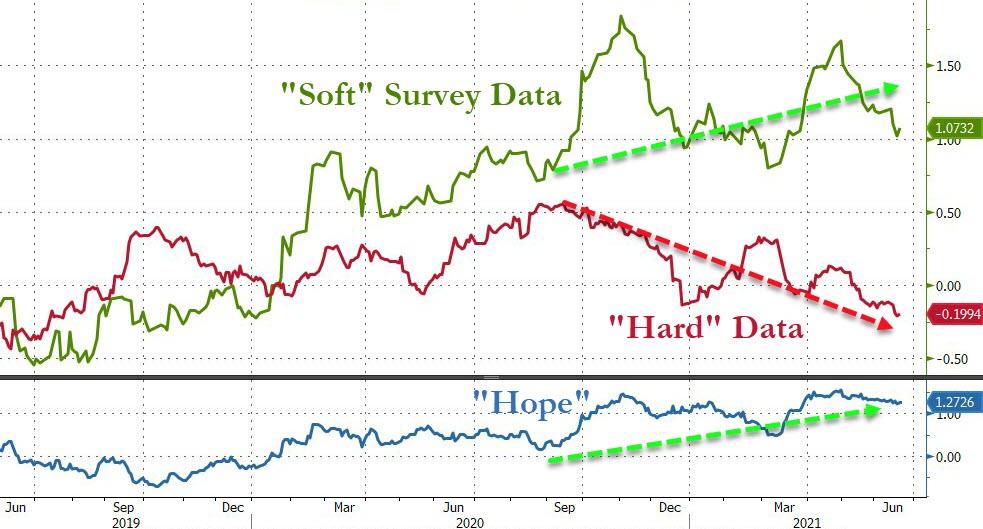
Look for both economic projections and earnings estimates to start getting revised down over the next two quarters.
Such is problematic for the Fed.
“Seven percent is more like a number that you would expect from an emerging market, not a developed country like the United States. It really highlights how strong the economic growth is expected to be over the course of this year.” – Eric Rosengren via Mish Shedlock
As Mish notes, the way 7% “real” growth gets achieved is by underestimating inflation. Currently, trimmed mean PCE is close to 2% versus the real economy.
“Fueled by negative real interest rates, the Fed has blown another housing bubble. Late as always, only now are some of the Fed presidents have noticed.” – Mish
That is correct, as noted by Dallas Fed President Robert Kaplan:
“The U.S. economy will likely meet the Federal Reserve’s threshold for tapering its asset purchases sooner than people think.
I think we’d be far better off, from a risk-management point of view, beginning to adjust these purchases of Treasuries and mortgage-backed securities. If we do these purchases longer than might be necessary, for me, it actually may reduce our flexibility in adjusting rates.
I’d rather start tapering, assuming we meet our conditions, sooner rather than later.”
The Fed Can’t Normalize
My colleague Albert Edward from Soc Gen nailed the Fed’s problem.
“The global reflation trade was already in retreat before the Fed lobbed in their surprisingly hawkish statement of intent last week. That retreat quickly turned into a rout across many asset classes.
Whilst not in the league of the 2013 Bernanke ‘Taper Tantrum’ it demonstrates the market’s sensitivity to the Fed’s intentions. To the surprise of many, the long end of the bond market rallied. Maybe it now realizes that a Fed tightening cycle is nigh on impossible?”
Albert also notes why the Fed may not continue to support markets indefinitely.
“Hilsenrath writes (WSJ link.) the markets could be too complacent. Former Fed Governor during the 2013 tantrum, Jeremy Stein thinks the markets shouldn’t take a benign view of the extent of potential tightening as ‘The Fed cannot support markets if there’s an inflation surprise.'”
He is correct. The Fed is in a trap. If they remove monetary accommodation, the market will react. However, as Albert notes:
“As Mr. Powell said in a June 16 news conference ‘We will do what we can to avoid a market reaction. But ultimately, when we achieve our macroeconomic goal, we will taper as appropriate.'”
In 2018, Chairman Powell failed miserably at trying to remove monetary accommodation.
Unfortunately, Powell’s failure this time will get amplified.
Portfolio Update
While the markets touched all-time highs this week, there was not a tremendous amount of conviction. Nonetheless, after reducing some equity risk two weeks ago, we did take the opportunity to add a bit of exposure in positions that got oversold. Those adjustments brought our equity weighting up slightly to 53% of a 60% target weight.
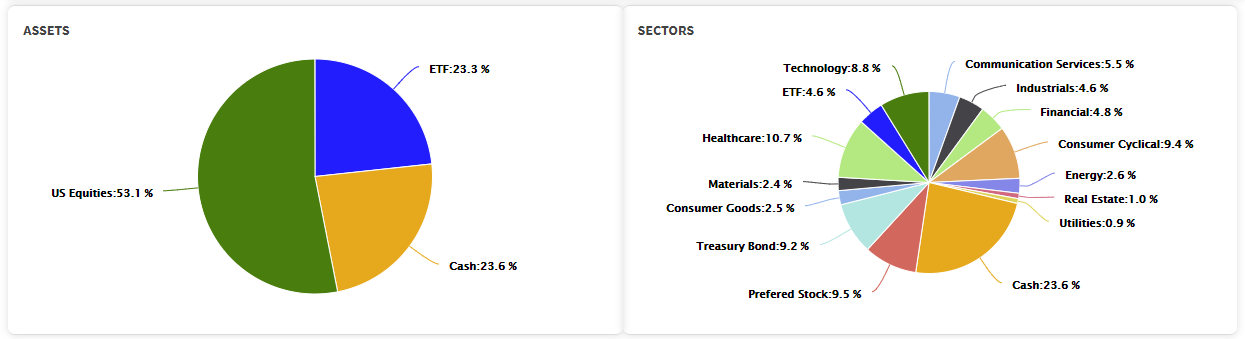
The rotation from “value” to “growth” continued this week, suggesting markets are already sensing a return to a deflationary environment. We currently carry a “barbelled” portfolio holding an inflationary tilt. However, the deflationary holdings are picking up performance.
As discussed in this week’s Technically Speaking report, the market is vulnerable to a spate of volatility. Such is why we overlay fundamental and technical analysis to align expectations with reality.
“Anyone who followed the numbers would have avoided the disaster of the 1929 crash, the 1970s or the past lost decade on Wall Street. Why didn’t more people do so? Doubtless, they all had their reasons. But I wonder how many stayed fully invested because their brokers told them ‘You can’t time the market.”‘ – Brett Arends
However, I think Seth Klarman from Baupost Capital summed our investment process up best.
“Can we say when it will end? No. Can we say that it will end? Yes. And when it ends and the trend reverses, here is what we can say for sure. Few will be ready. Few will be prepared.”
The current environment is very much the same as we saw at the markets’ peak in 1999 and 2007. New valuation metrics, IPO’s of money-losing companies, valuations, and the belief “this time is different.”
Our goal is only to get prepared.
“History repeats itself all the time on Wall Street” – Edwin Lefevre
See You Next Week
By Lance Roberts, CIO
Market & Sector Analysis
Analysis & Stock Screens Exclusively For RIAPro Members
Discover All You Are Missing At RIAPRO.NET
Come find out what our RIAPRO.NET subscribers are reading right now! Risk-Free For 30-Day Trial.
- Sector & Market Analysis
- Technical Gauge
- Fear/Greed Positioning Gauge
- Sector Rotation Analysis (Risk/Reward Ranges)
- Stock Screens (Growth, Value, Technical)
- Client Portfolio Updates
- Live 401k Plan Manager

THE REAL 401k PLAN MANAGER
A Conservative Strategy For Long-Term Investors
If you need help after reading the alert, do not hesitate to contact me.

Model performance is a two-asset model of stocks and bonds relative to the weighting changes made each week in the newsletter. Such is strictly for informational and educational purposes only, and one should not rely on it for any reason. Past performance is not a guarantee of future results. Use at your own risk and peril.
Have a great week!


