
Inside This Week’s Bull Bear Report
- Conference Board Scraps Its Recession Call
- How We Are Trading It
- Research Report – Small Cap Stocks May Be At Risk
- Youtube – Before The Bell
- Market Statistics
- Stock Screens
- Portfolio Trades This Week
Market Sets New All-Time High
Last week, we discussed the seemingly unstoppable bullish trend from the October 2022 lows.
“The market rebounded mid-week from the disappointing inflation report but stumbled again on Friday after producer inflation. The market’s momentum remains strong, and investor optimism is very high. The only question is what causes a short-term correction to reduce the deviations between the market and the 200-DMA.”
The rally continued this past week, spurred higher by Nvidia’s blowout earnings report Wednesday night. After a brief test of the 20-DMA, the market surged to new all-time highs on Thursday, confirming the ongoing bullish trend. As shown, the 20-DMA continues to act as crucial support for the market.

The negative divergence in both momentum and breadth (chart below) continues to be of concern, suggesting a short-term correction is likely. With the bulk of earnings season behind us, the focus will return to the Fed and the economy.
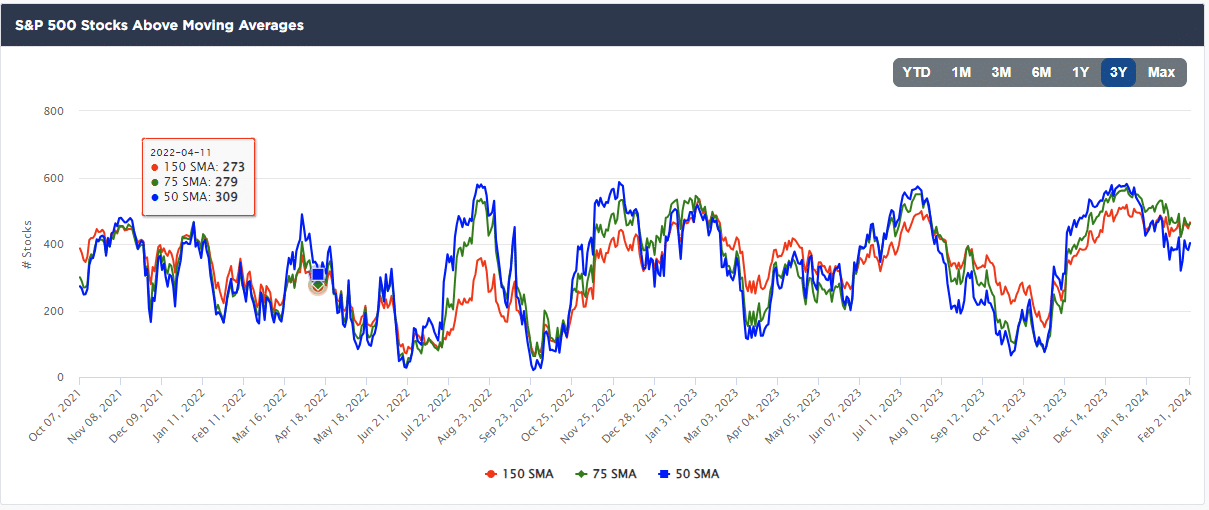
Given the more speculative action taking place in the options market, it is clear that bullish sentiment continues to remain elevated. Historically, the combination of negative divergences and bullish sentiment previously led to short-term corrections. As such, we suggest remaining somewhat diligent on risk management protocols.
We don’t know what will eventually lead to a market correction, but one will ultimately occur to reverse the more extreme deviation from the 200-DMA. With the market becoming more aligned with the Federal Reserve’s expectations for rate cuts, the current outlying risk for equities is an economic slowdown that impacts earnings.
At the moment, that is a very non-consensus worry. Most economists have swung from expecting a recession to giving up on that call. Such would include the Conference Board this past week.
Need Help With Your Investing Strategy?
Are you looking for complete financial, insurance, and estate planning? Need a risk-managed portfolio management strategy to grow and protect your savings? Whatever your needs are, we are here to help.

Conference Board Scraps Its Recession Call
Eventually, the pressure of being “wrong” gets to everyone. For stock investors, the markets are famous for “dragging the last of the holdouts” back into the market just before it does indeed correct. For economists, recession calls that don’t mature impact their credibility. As we wrote in October, “Economists No Longer Expect A Recession.” To wit:
“In the latest quarterly survey by The Wall Street Journal, business and academic economists lowered the probability of a recession within the next year, from 54% on average in July to a more optimistic 48%. That is the first time they have put the probability below 50% since the middle of last year.”
As of January, the probability dropped to just 39%. Of course, since the WSJ has been collecting the data, the surveyed economists continue to be spectacularly wrong, as they, just like investors, get swept up in short-term momentum and exuberance.
Unsurprisingly, this is the case for the Conference Board. This past week, it finally succumbed to an economy that continues to avoid a recession. To wit:
“The Conference Board on Tuesday abandoned a long-running call for the U.S. economy to fall into recession, although its Leading Economic Index still sees economic output flatlining in the months ahead. The Conference Board first announced in July 2022 that the index signaled a recession was coming. It repeated that forecast with each month’s report until Tuesday’s release for January, even as U.S. economic output, job creation, and consumer spending all continued at above-trend levels throughout, and no recession materialized.”
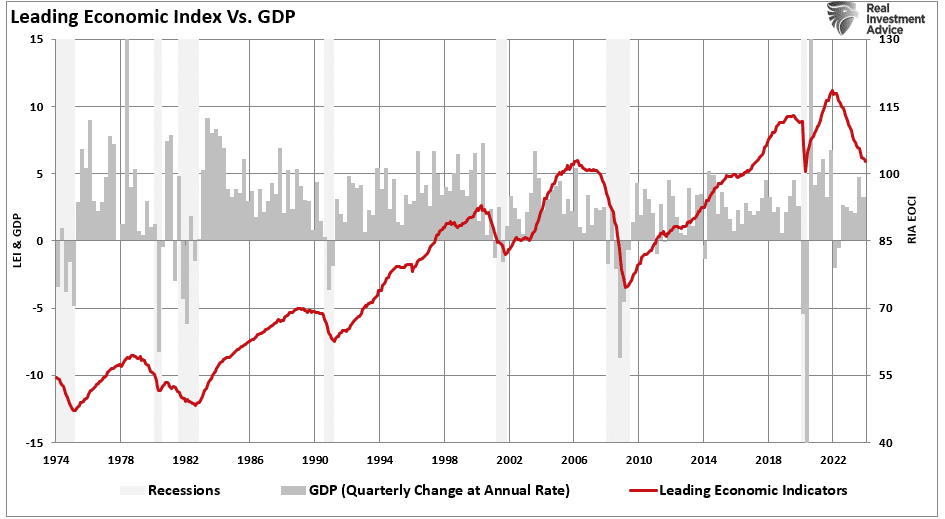
The chart below is the raw Leading Economic Index from the Conference Board versus GDP. Each previous decline in the index has aligned with a recession.
According to the Conference Board, the reason for the retraction of the recession call was the improvement in underlying indicators.
“While the declining LEI continues to signal headwinds to economic activity, for the first time in the past two years, six out of its 10 components were positive contributors over the past six-month period. As a result, the leading index currently does not signal recession ahead.” – Justyna Zabinska-La Monica, The Conference Board.
An Unusual Deviation
The LEI index comprises, as noted, 10 subcomponents, as shown in the chart below. The most significant positive contributor to the turn from a recession forecast came from the recent surge in stock prices to record highs. The benchmark S&P 500 index has risen by more than 20% since late October after signals from the Federal Reserve that its aggressive interest rate cycle aimed at containing inflation is over and that rate cuts are expected this year.
Furthermore, persistently low numbers of new filings for unemployment benefits and measures of future credit availability, home building permits, and new orders of manufactured goods also contributed to the change in the outlook.

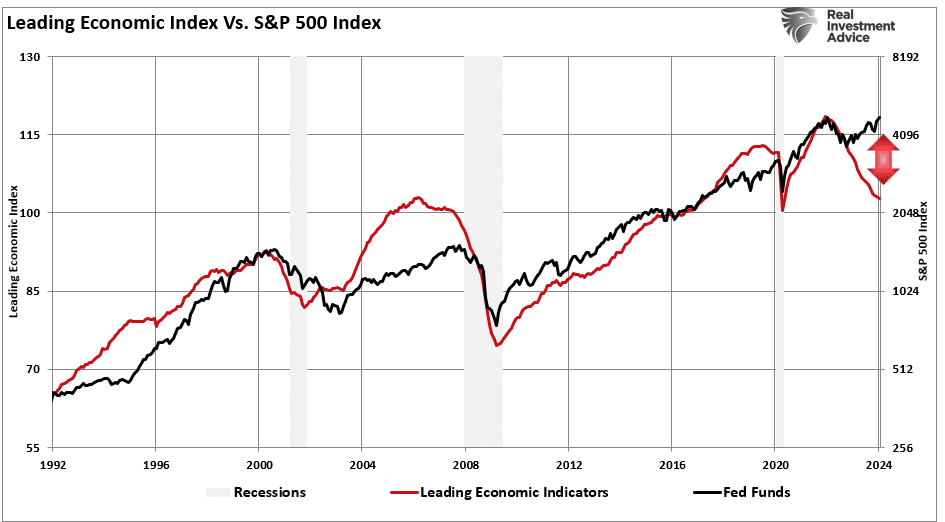
As noted, the biggest contributors were the leading credit index (which has improved with the drop in interest rates) and the surge in the S&P 500 index. Given that the Conference Board’s Leading Index suggests where the economy will be in 6-months, the stock market tracks the index. Currently, the stock market is very detached from the index.
However, therein lies the risk. The Federal Reserve has been adamant that their inflation fight is NOT over yet, as noted in the most recent FOMC minutes.
“Participants generally noted that they did not expect it would be appropriate to reduce the target range for the federal funds rate until they had gained greater confidence that inflation was moving sustainably toward 2 percent.”
Such brings up Rule #9.
Bob Farrell’s Important Rule
Bob was a Wall Street veteran with over 50 years of experience crafting his investing rules. Farrell obtained his master’s degree from Columbia Business School and started as a technical analyst at Merrill Lynch in 1957. Even though Farrell studied fundamental analysis under Gramm and Dodd, he turned to technical analysis after realizing there was more to stock prices than balance sheets and income statements. Farrell became a pioneer in sentiment studies and market psychology. His 10 rules on investing stem from personal experience with dull markets, bull markets, bear markets, crashes, and bubbles. In short, Farrell had seen it all and lived to tell about it.
Regarding Wall Street experts, Rule #9 is the most important.
“When all the experts and forecasts agree, something else will happen.“
With the Conference Board giving up its recession call, all the “experts” from Wall Street to the “Ivory Towers” of economics are in the “no recession” camp. It is an interesting switch, given that in 2022, all the experts expected a recession in 2023. But here we are in 2024 with “not a recession in sight.”
But this is where it is interesting. The Conference Boards index has had negative readings for the last 23 months. That is just one month short of negative readings in 2008.
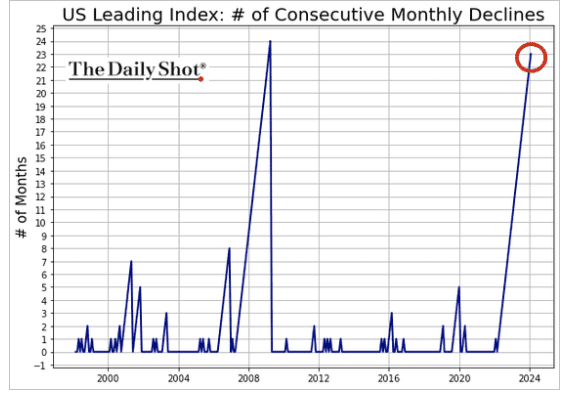
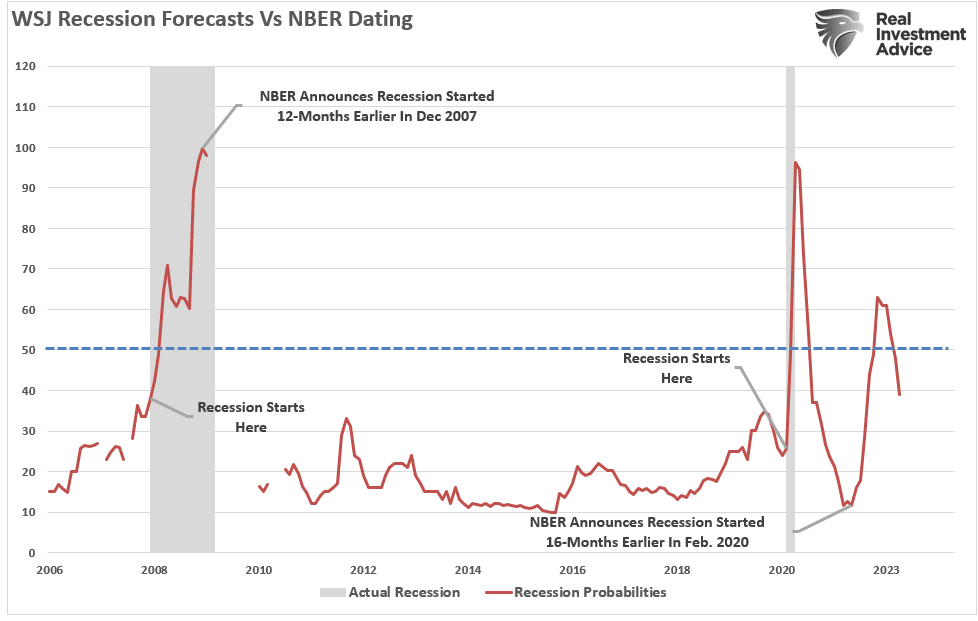
The first negative reading of the index was in April 2007. As shown in the chart below, in April 2007, there was no hint of a recession in the economic data. Employment was strong, and even in early 2008, Ben Bernanke, then Fed chairman, stated that it was a “Goldilocks” economy and that “subprime mortgages” were contained.
Notably, it wasn’t until 21 months later that the National Bureau of Economic Research (NBER) declared the recession began 12 months earlier, in December 2007.

Could a recession still be in our future?
The Risk Of A Recession Is Not Zero
With the stock market surging and financial conditions loosening, there seem to be valid reasons to suspect we may avoid a recession. As noted by the Conference Board, unemployment remains low, along with jobless claims, and confidence has improved markedly in recent months.
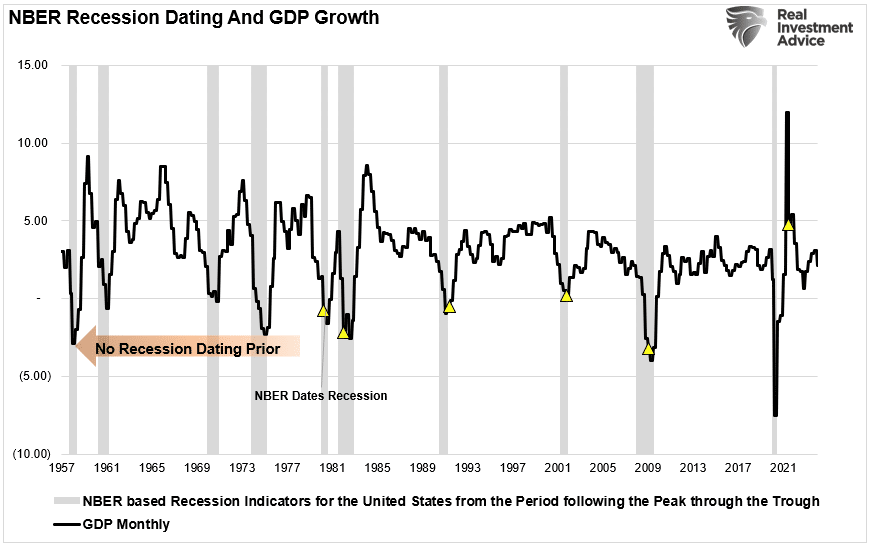
However, historically, the NBER has been very late in determining the start and end of a recession. Such will likely be the case as they wait for data revisions and clear evidence of a recessionary economic downturn. With the economy still growing, there is no need for a recessionary call.
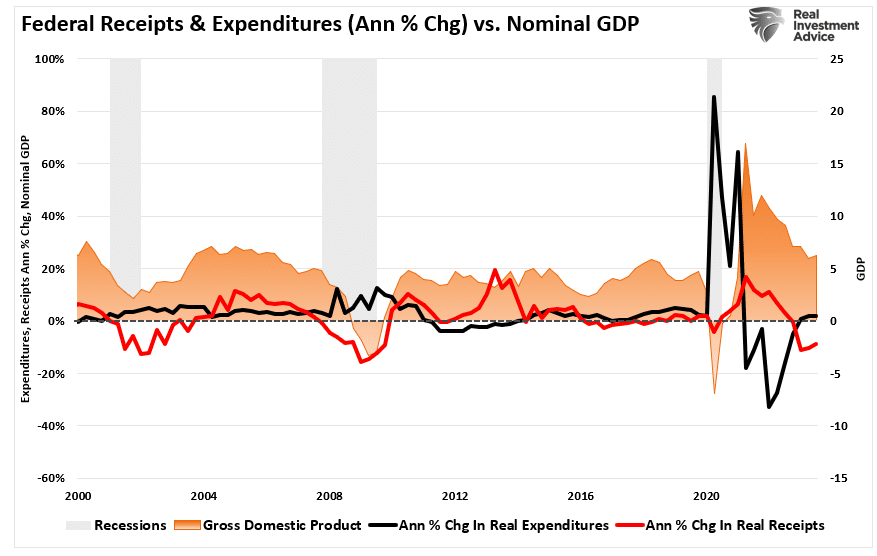
The economy’s strength is unsurprising, given the ongoing financial stimulus from the Inflation Reduction Act, the CHIPS Act, and a surge in deficit spending. As we discussed recently, deficit spending keeps the economy out of recession.
“As noted, the problem remains on how the economy has avoided a recession despite the Fed’s aggressive rate hiking campaign. Numerous indicators, from the leading economic index to the yield curve, suggest a high probability of an economic recession, but one has yet to occur. One explanation for this has been the surge in Federal expenditures since the end of 2022 stemming from the Inflation Reduction and CHIPs Acts. The second reason is that GDP was so grossly elevated from the $5 Trillion in previous fiscal policies that the lag effect is taking longer than historical norms to resolve.”
We see that same support to economic activity in the monetary supply (M2) as a percentage of the economy. While those monetary and fiscal supports caused economic growth to surge following the “pandemic-related” spending spree, both are reversing.
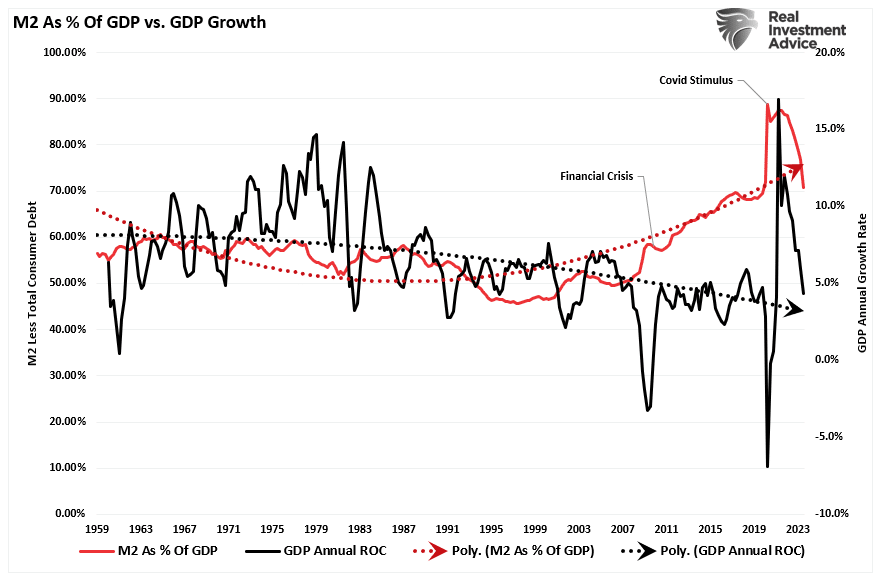
Crucially, it was worth noting that the massive surge in economic growth is reversing as those monetary supports fade. However, given that the reversal in economic growth started from the highest annualized growth rate since 1959, the reversal of that stimulus-induced surge will require more time.
As such, without additional fiscal or monetary stimulus to offset the restrictive period of monetary policy, the risk of recession in the next 12-24 months is not zero.
Yield Curve Still Says There Is A Risk
The question of a “soft landing” or an outright “recession” is difficult to answer. It is certainly possible that all of the tell-tale signs of economic recession may be wrong this time. There is another possibility. Given the massive increase in activity due to a shuttered economy and massive fiscal stimulus, the reversion may take longer than expected. Both scenarios support the rising optimism of Wall Street economists in the near term.
We would already be in a recession if we had entered this current period at previous growth rates below 4%. The difference is the contraction began from a peak in nominal GDP of nearly 12%. As noted above, a bounce in activity is not surprising after a significant contraction in the economic data. The question is whether that bounce is sustainable. Unfortunately, we won’t know the answer for quite some time.

We know that Federal Reserve actions regarding hiking rates have about a 6-quarter lead over changes to economic growth. Given that the last Fed rate hike was in Q2 of last year, such would suggest a further slowing in economic activity by the end of 2024.

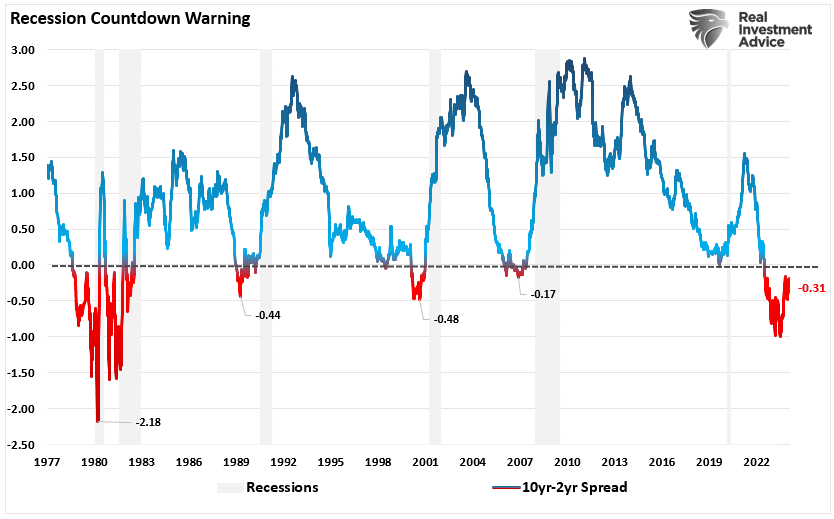
While the Conference Board has abandoned its recession call, the bond market has not. The yield spread between the 10-year and 2-year Treasury Bonds remains deeply inverted. Notably, the inversion is NOT the recessionary warning. It is when that yield-curve UN-inverts that signals the onset of a recession. Such has historically occurred in response to Federal Reserve rate cuts to try and offset a rapidly slowing economy.
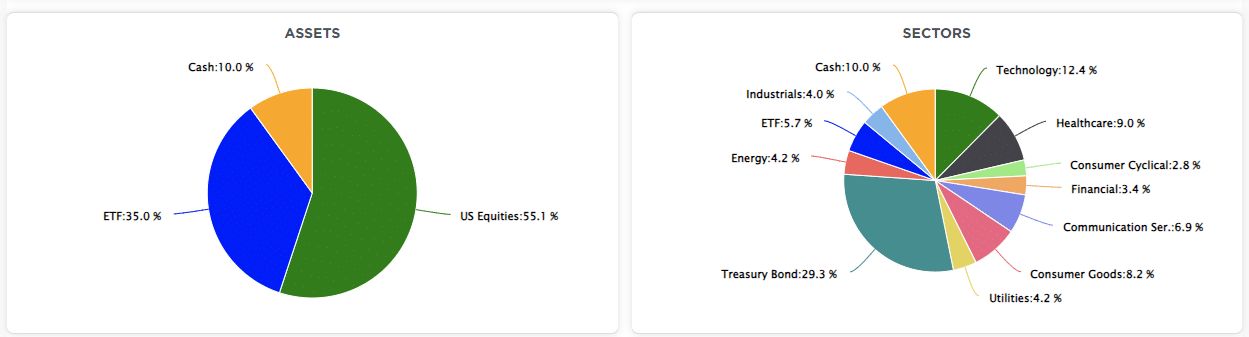
How We Are Trading It
As noted above, the massive surge in monetary stimulus (as a percentage of GDP) remains highly elevated, which gives the illusion the economy is more robust than it likely is. As the lag effect of monetary tightening continues to weigh on consumption, the reversion to economic strength may surprise most economists.
For investors, the implications of reversing monetary stimulus on prices are not bullish. As shown, the contraction in liquidity, measured by subtracting GDP from M2, correlates to changes in asset prices. Given that there is significantly more reversion in monetary stimulus to come, this suggests that lower asset prices will likely follow. However, the markets have recently been betting that a reversal of liquidity is coming. Given the inflationary implications of providing monetary accommodation, i.e., rate cuts and quantitative easing, it seems unlikely the Federal Reserve will act before the onset of a recession. If that assumption is correct, investors may set themselves up for disappointment.

As we update our recessionary indicators, there is still no clear visibility regarding the certainty of a recession. Yes, this “time could be different.” The problem is that, historically, such has not been the case.
Therefore, given this uncertainty, we must continue to weigh the possibility that Wall Street economists are correct in their more optimistic predictions. Simultaneously, we must remain open to the probabilities that still lie with the indicators.
No one knows what the future holds with any degree of certainty. Therefore, we must remain nimble in our investment approach and trade the market for what it is rather than what we wish it to be.
Have a great week.
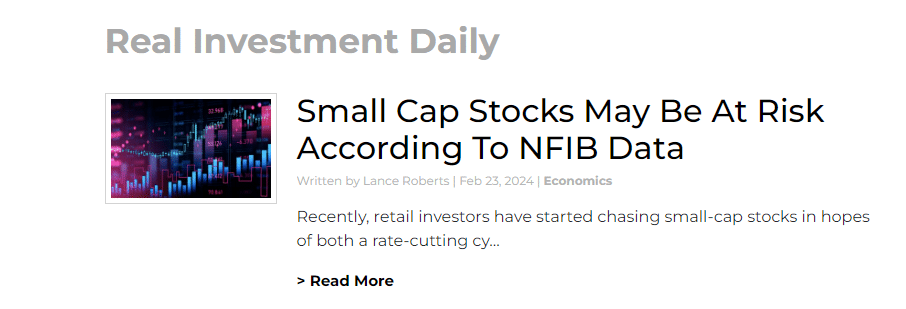
Research Report
Subscribe To “Before The Bell” For Daily Trading Updates
We have set up a separate channel JUST for our short daily market updates. Please subscribe to THIS CHANNEL to receive daily notifications before the market opens.
Click Here And Then Click The SUBSCRIBE Button
Subscribe To Our YouTube Channel To Get Notified Of All Our Videos
Bull Bear Report Market Statistics & Screens

SimpleVisor Top & Bottom Performers By Sector

S&P 500 Weekly Tear Sheet
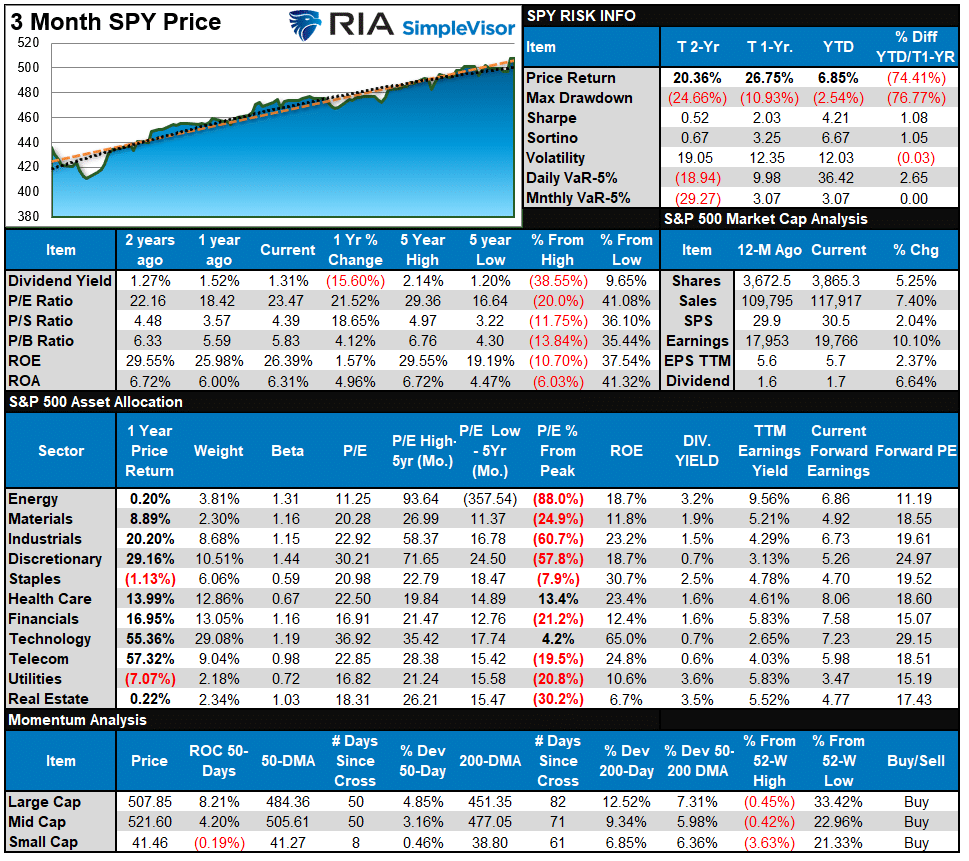
Relative Performance Analysis
The bull trend in stocks remained uninterrupted this past week, with the S&P 500 hitting all-time highs following Nvidia’s earnings. However, after the push last week, most sectors and markets are back to extreme short-term overbought conditions, which will likely limit further upside over the next week. The bullish backdrop remains very strong, and there is little reason for an abundance of caution. However, profit-taking and risk management remain prudent, with most markets and sectors overbought and deviating from their 50-DMA.

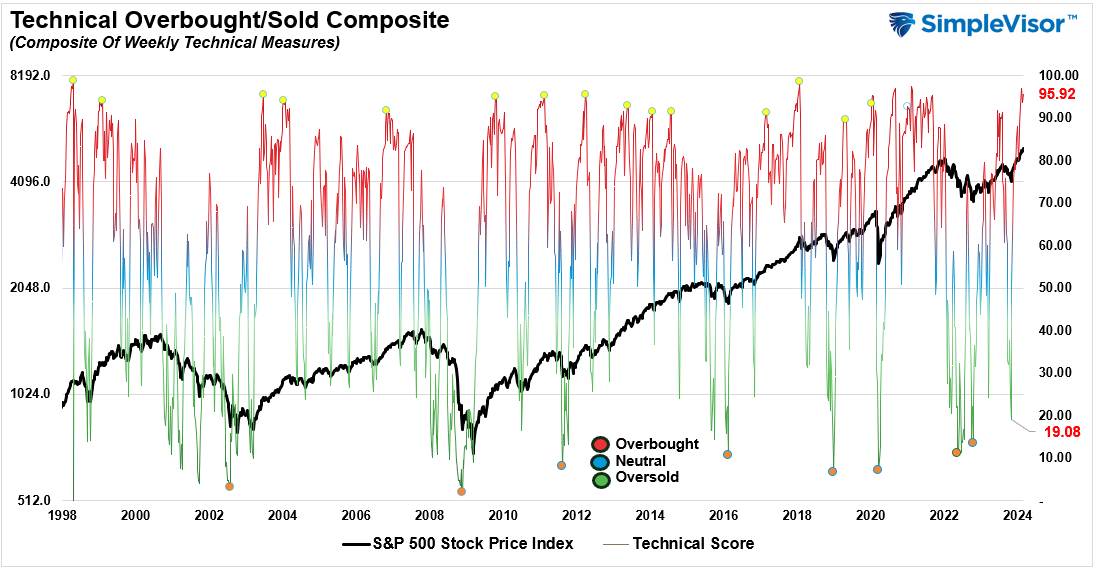
Technical Composite
The technical overbought/sold gauge comprises several price indicators (R.S.I., Williams %R, etc.), measured using “weekly” closing price data. Readings above “80” are considered overbought, and below “20” are oversold. The market peaks when those readings are 80 or above, suggesting prudent profit-taking and risk management. The best buying opportunities exist when those readings are 20 or below.
The current reading is 95.92 out of a possible 100.
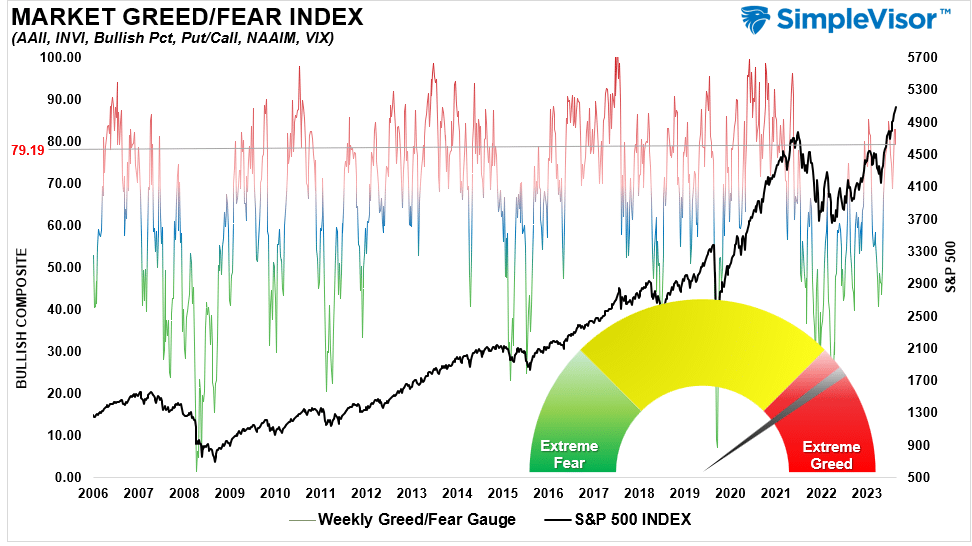
Portfolio Positioning “Fear / Greed” Gauge
The “Fear/Greed” gauge is how individual and professional investors are “positioning” themselves in the market based on their equity exposure. From a contrarian position, the higher the allocation to equities, the more likely the market is closer to a correction than not. The gauge uses weekly closing data.
NOTE: The Fear/Greed Index measures risk from 0 to 100. It is a rarity that it reaches levels above 90. The current reading is 79.19 out of a possible 100.
Relative Sector Analysis

Most Oversold Sector Analysis

Sector Model Analysis & Risk Ranges
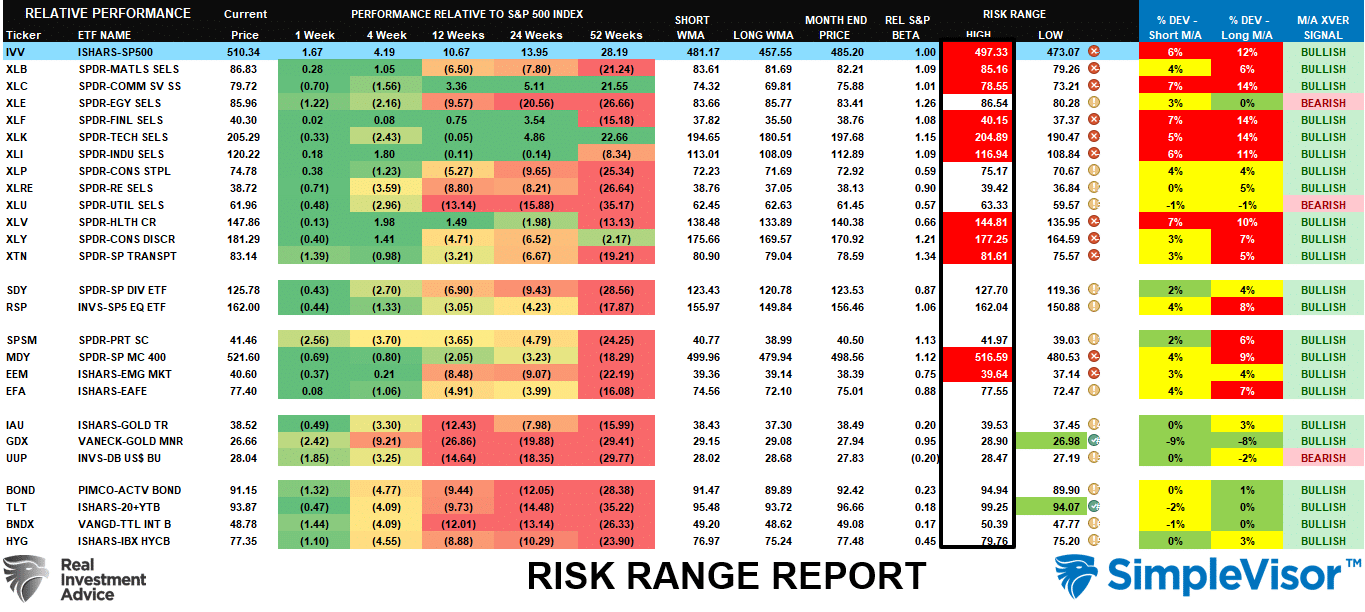
How To Read This Table
- The table compares the relative performance of each sector and market to the S&P 500 index.
- “MA XVER” (Moving Average Crossover) is determined by the short-term weekly moving average crossing positively or negatively with the long-term weekly moving average.
- The risk range is a function of the month-end closing price and the “beta” of the sector or market. (Ranges reset on the 1st of each month)
- The table shows the price deviation above and below the weekly moving averages.
As noted last week:
“The bullish momentum continued this past week, with the market holding above the 20-DMA. While the market did pull back on Wednesday and Friday, it did little to reverse the market trading well outside its normal risk range. Such was again a function of the mega-capitalization stocks, which are also well outside their ranges and deviated above long-term moving averages”
The broad market, Materials, Communications, Financials, Technology, Industrials, Healthcare, Discretionary, and Transports are all trading well outside their normal risk ranges. Furthermore, the broad market, Communications, Technology, Financials, Industrials, and Discretionary, are trading at extreme deviations from their long-term moving averages. These deviations are not sustainable long-term and argue for a more significant correction sometime this year.
Weekly SimpleVisor Stock Screens
We provide three stock screens each week from SimpleVisor.
This week, we are searching for the Top 20:
- Relative Strength Stocks
- Momentum Stocks
- Fundamental & Technical Strength W/ Dividends
(Click Images To Enlarge)
R.S.I. Screen

Momentum Screen
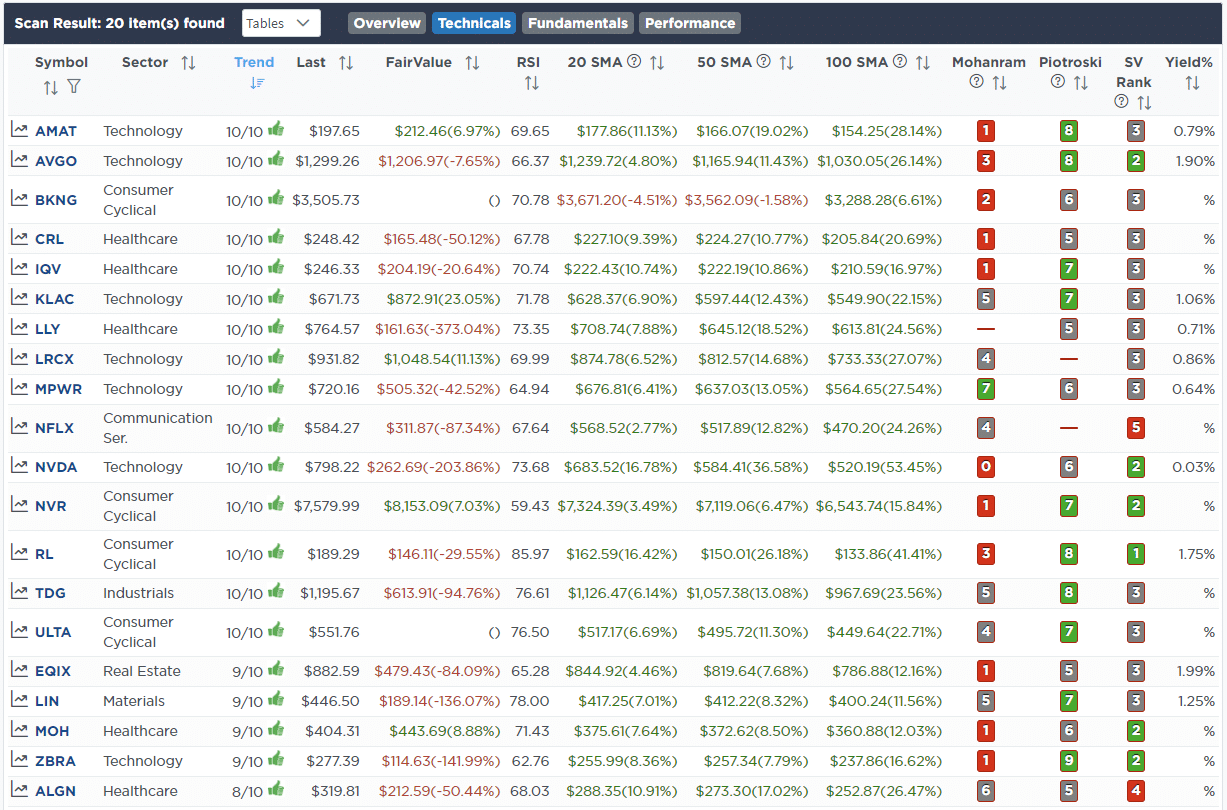
Fundamental & Technical Strength

SimpleVisor Portfolio Changes
We post all of our portfolio changes as they occur at SimpleVisor:
Feb 21st
“Last night, Palo Alto Networks posted strong earnings but weak guidance, leading to a sharp 25% selloff this morning at the open. Like NVDA and AMD, this stock is poised in the Artificial intelligence space where prices have run far ahead of reality. As such, even though earnings were strong, that detachment from underlying fundamentals can lead to very sharp price reversions. Such brings us to today’s trades in the Equity Model.
We have wanted to add Palo Alto (PANW) to our portfolio for a while but have been unable to get a decent entry point where the stock is oversold. Therefore, we are using today’s selloff as an opportunity to add a very small position to the portfolio. As the position stabilizes and finds support, we will increase sizing and reduce our cost basis.
However, the selloff in PANW is a stark reminder of what can happen with earnings, and after the bell today, Nvidia is reporting. While earnings and revenue will be strong, forward guidance is a risk. Therefore, we are reducing our holdings in both AMD and NVDA before the announcement to hedge some risk after a big runup in these two holdings. We are also trimming Diamond Back Energy (FANG) and taking profits as it has become disconnected from the rest of the drillers. We will look to add back to these positions opportunistically at better prices.”
Equity Model
- Reduce AMD (AMD) and NVIDIA (NVDA) to 2% and 1.5% of the portfolio, respectively.
- Reduce Diamond Back Energy (FANG) to 1% of the portfolio.
- Initiate a starter 0.75% position of Palo Alto Networks (PANW) in the portfolio.

Lance Roberts, C.I.O.
Have a great week!

