Technical Review Of The Market. Where To Next?


In this 06-03-22 issue of “Technical Review Of The Market.”
- Market Review & Update
- Technical Review Of The Market
- Portfolio Positioning
- Sector & Market Analysis
Follow Us On: Twitter, Facebook, Linked-In, Sound Cloud, Seeking Alpha
Need Help With Your Investing Strategy?
Are you looking for complete financial, insurance, and estate planning? Need a risk-managed portfolio management strategy to grow and protect your savings? Whatever your needs are, we are here to help.
Schedule your “FREE” portfolio review today.

Weekly Market Recap With Adam Taggart
Market Fails At First Resistance
As discussed last week, a rally finally took hold as investors found reasons to be bullish. That rally pushed the market above the 20-dma and triggered a reasonably strong “buy” signal. However, despite the optimism of the bulls, we noted an essential headwind to the rally. To wit:
“Concerning how long it will last, I suspect the rally could be powerful but short-lived as a tremendous number of investors swept up during the decline and are looking for a sellable rally. Such is a continuation of investor actions so far this year. For the most part, the 20-dma has consistently acted as the “exit” for ‘trapped longs.’”
While the market did clear the 20-dma, the “trapped longs” headed to the exits at the initial 38.2% Fibonacci retracement level from the March highs. That level was also where previous important support for the February and April lows got broken.
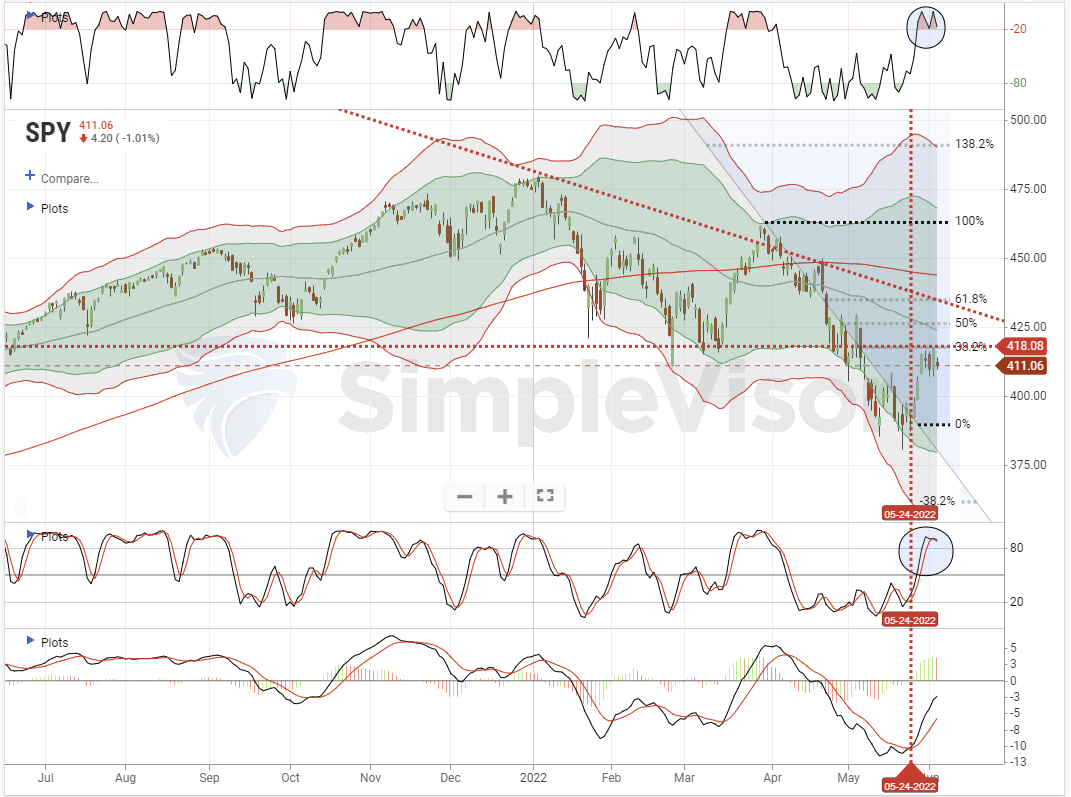
We technically review this chart again in a moment, but the critical point is that if the market doesn’t advance early next week, we will likely retest the recent lows.
As I discussed with Charles Payne on Friday, the problem I have is that we are trapped between a market that, from a sentiment view, is “so bearish, it’s bullish.” However, we are also facing an aggressive rate hiking campaign and the start of “QT” by the Fed.
It is quite a conundrum; therefore, let’s review both the bullish and bearish cases to determine how to position for what lies ahead.
Technical Review – The Bullish View
There are currently several bullish arguments to support a rally. While price action remains weak, the S&P 500 holds short-term support. At the same time, sentiment remains extremely “bearish,” which, from a contrarian perspective, is actually “bullish.”
Such was a point made on Thursday via Yahoo Finance:
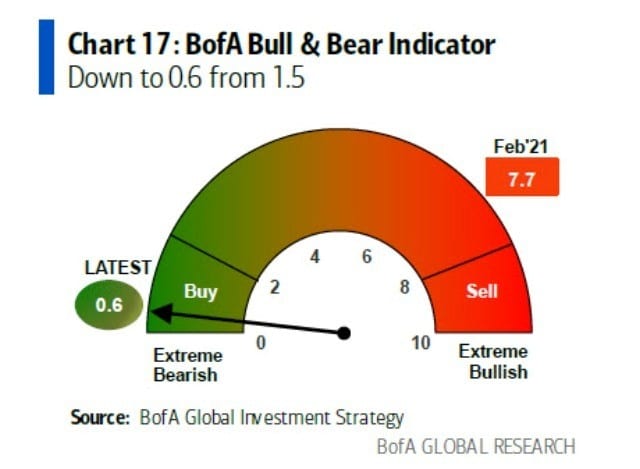
“Michael Hartnett’s team over at Bank of America Global Research noted their proprietary Bull & Bear indicator swung into contrarian buy mode a few weeks ago. But Hartnett still leans bearish, arguing that U.S. stocks are ‘vulnerable’ to a bear market rally and that traders should ‘sell any rips.'”
Concurrently, Hedge Fund leverage has gotten sharply reduced. As Morgan Stanley noted, last week ended with one of the most significant gross reductions. That happened on both the long and the short sides of their books.
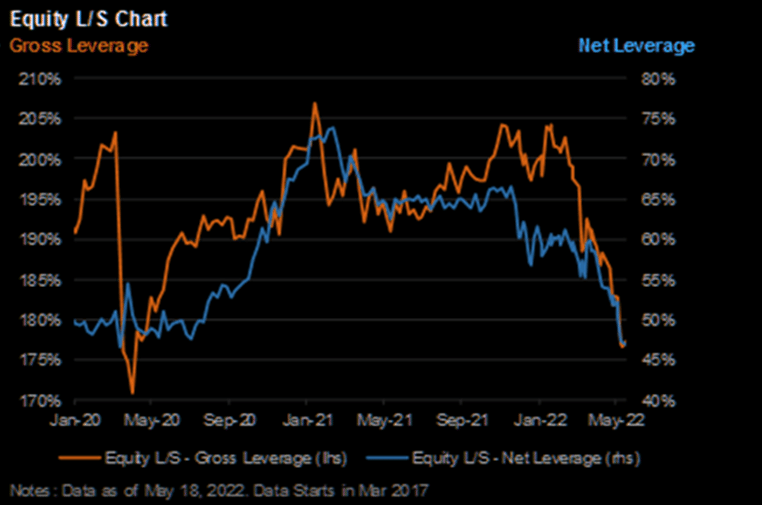
With June wrapping up the second quarter of 2022, it is very likely that between the selloff in both stocks and bonds this year, many fund managers are “out of balance” regarding their allocations. Such could provide decent buying pressure to align allocations by quarter-end.
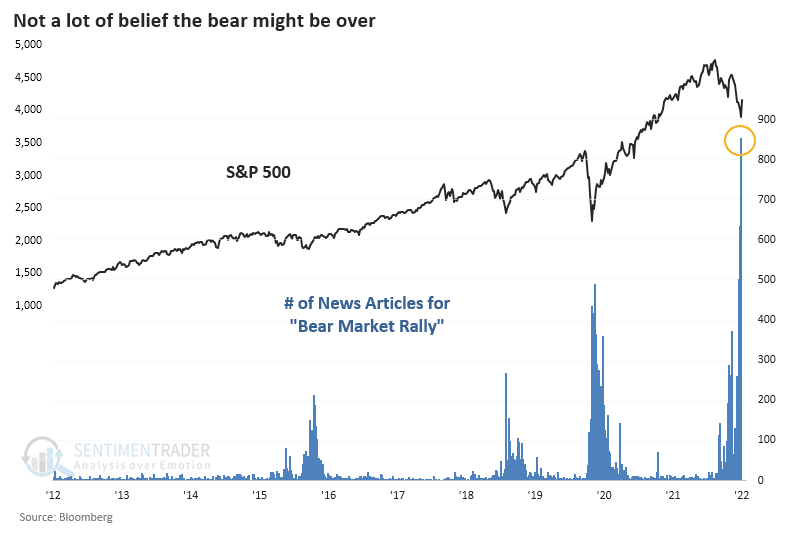
Lastly, as noted by Sentiment Trader previously:
“In late March 2020, thrusts in buying interest were wildly impressive. But almost all technicians mocked them as ‘unofficial’ because they didn’t meet some arbitrary, cherry-picked, overly optimized rules. It’s happening again, and there is even more skepticism that this rally is real. The number of articles dismissing the gains as just another “bear market rally” is nearly double the prior record from early April 2020.
In the three days leading up to the exchange holiday, more than 80% of volume on the NYSE flowed into advancing stocks. We typically do not see this kind of behavior during bear markets, usually at the end of them.“
The Bullish Chart
The decline in the market from the March peak to the May lows pushed prices well into 3-standard deviation territory below the 50-dma. A simplistic explanation is stretching a rubber band as far as possible in one direction. Physics states that if you release the rubber band, it will snap back or revert an equal distance in the opposite direction.
Let’s revisit that daily chart from above. Each time the market deviated below the 50-dma, there was a “snap back” to the upside. Furthermore, with both the short- and intermediate-term MACD (moving average convergence divergence) indicators triggering a “buy” signal, such further supports a continued rally.
There is certainly room for the market to rally further than many think currently, given the “fuel” of extremely underweight equity allocations and negative sentiment.
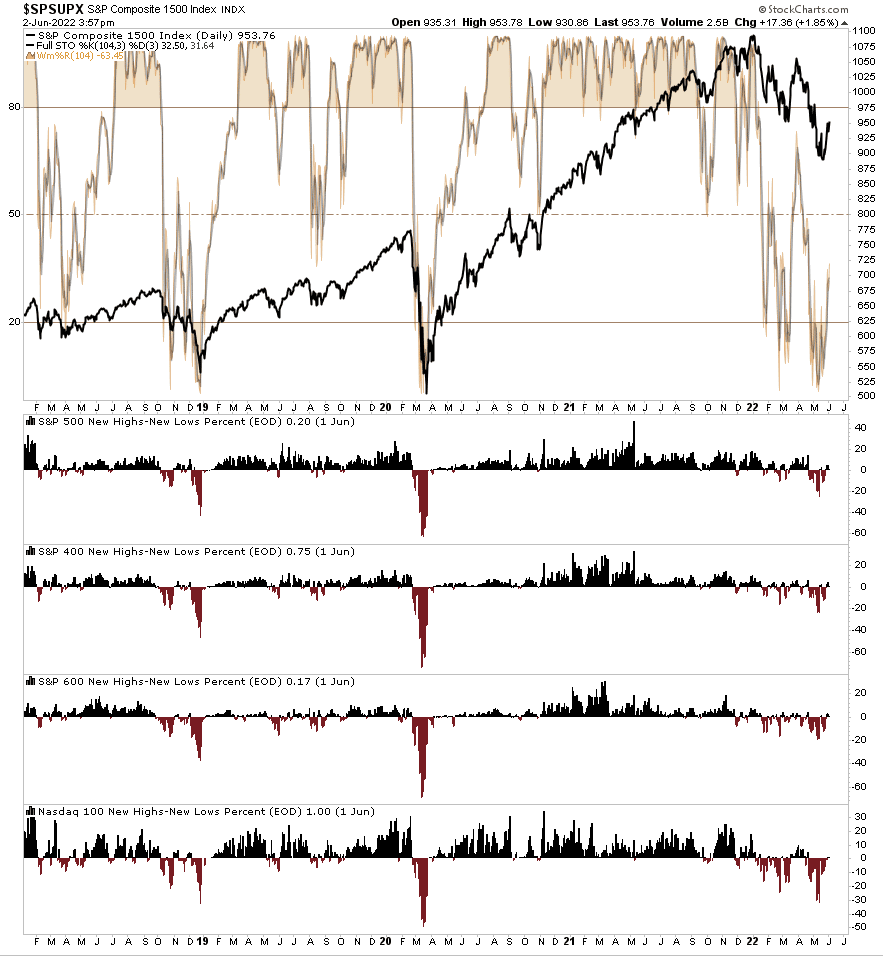
The Fibonacci retracement levels from the March peak, the 50- and 200-dma, and the downtrend line from the January highs all present a challenge to the bulls short-term. However, the recovery in buying pressure shows improvement in the number of stocks making new highs versus new lows on multiple indices.
Over the last 5-years, when buying pressure turns negative and then recovers, such marked the bottom of the selloff in the market. Furthermore, with the market still oversold (indicator behind the index), such suggests the market still has room to rally over the next week or so as long as buying pressure improves.
Both of these charts suggest the market could rally more over the next couple of weeks; however, there is a lot of overhead resistance coming.
The technical review of the “bearish view” has an equally important narrative on a longer-term basis.

Technical Review – The Bearish View
While we could certainly see a reasonably strong reflexive rally in the short-term, there are still sufficient reasons to remain cautious on the markets over the next several months.
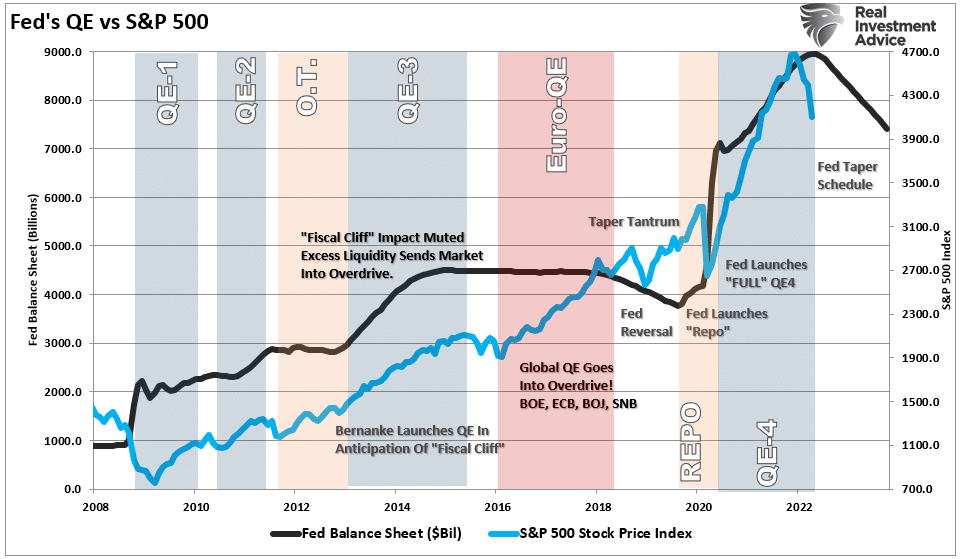
First and foremost, as opposed to previous market lows where inflation was tame, and the Fed was beginning to cut interest rates and increase “quantitative easing,” such is not the case this time. It could not be more opposed as inflation is still running near its highs, and the Fed is pushing the most aggressive monetary tightening campaign ever.
As shown below, the Fed will be removing liquidity at $90 billion a month by August.
Furthermore, previous rate hike cycles have not boded well for a bull market, particularly when valuations remain elevated.
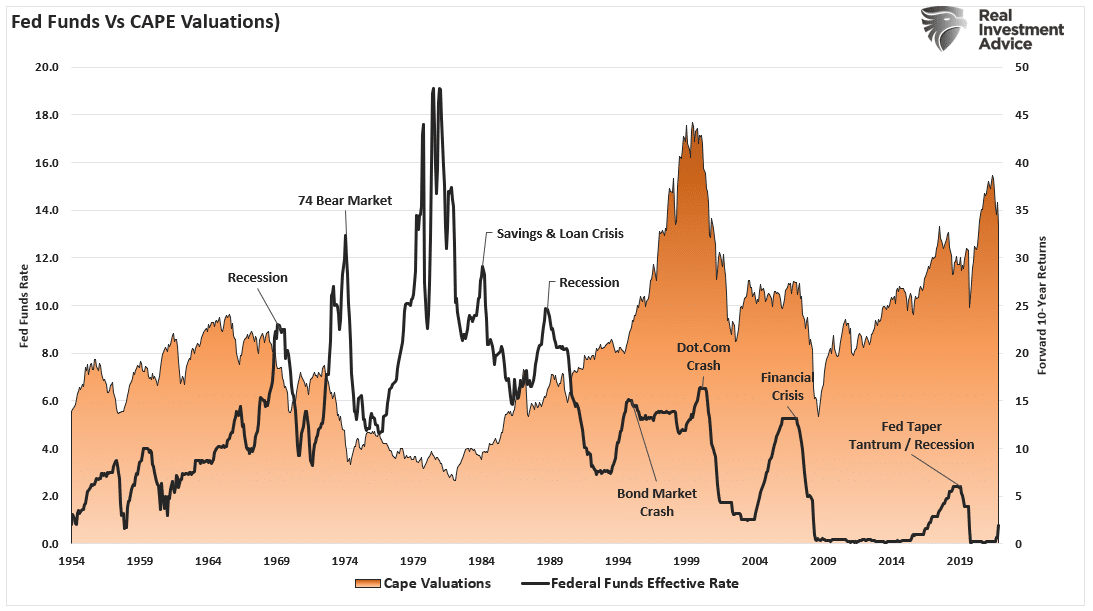
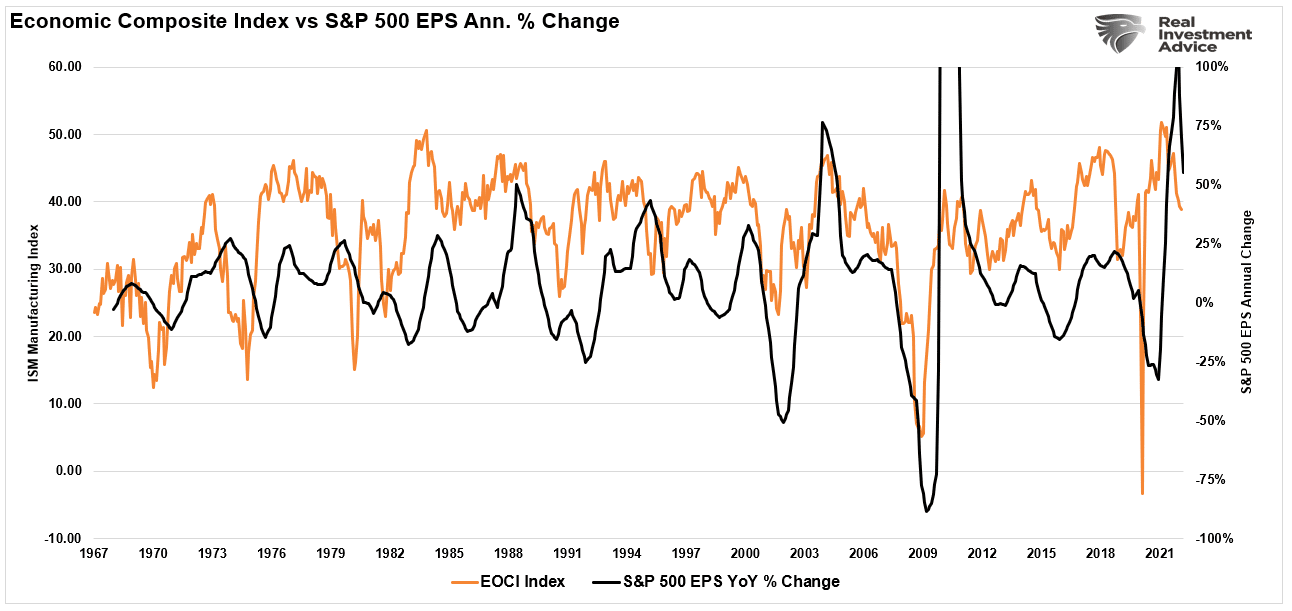
Of course, with inflation high, the “creative destruction” of high prices on consumption will weaken the economy. As the economy weakens and much less falls into recession, corporate profitability will decline, which will lead to a further repricing of equities going forward.
A longer-term market view reveals a more bearish picture given the macro backdrop.
The Bearish Chart
While the bulls may have it correct short-term, as noted above, a technical review of the macro-backdrop suggests the bears may remain in control for a while longer. The chart below is a monthly chart of the S&P 500 index.
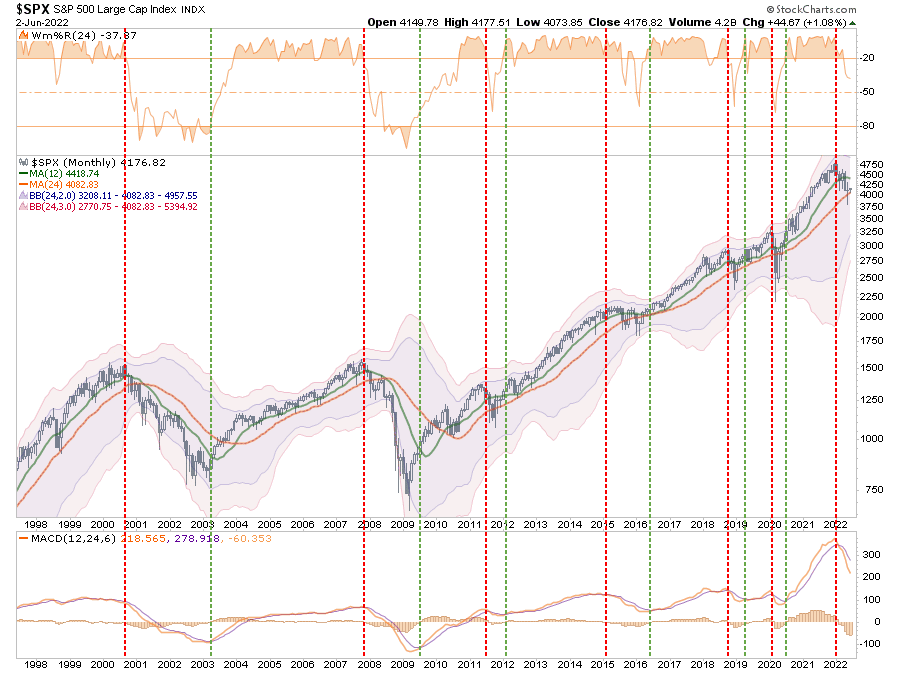
The bad news is that the market broke critical support at the 12-month moving average during May. However, the late-month rally kept the market above support at the 2-year moving average. The 24-month moving average is critical as it has been the bullish trending support line during the last 25-years.
However, the most crucial signal remains the long-term MACD indicator in the bottom panel. When that indicator has previously crossed lower, it signaled the peak of a bear market or significant correction. That cross lower occurred in January of this year. With a long-term sell signal intact, and markets well above previous bottoms, there is still downside risk ahead.
Lastly, the market’s deviation from its long-term moving averages and trend lines is still at extremes. A view of the markets back to 1925 makes this a bit more evident. Not only has the liquidity-driven surge from the 2020 lows pushed the market to extreme levels above its 5-year moving average, but the current long-term overbought conditions are only just beginning to correct.
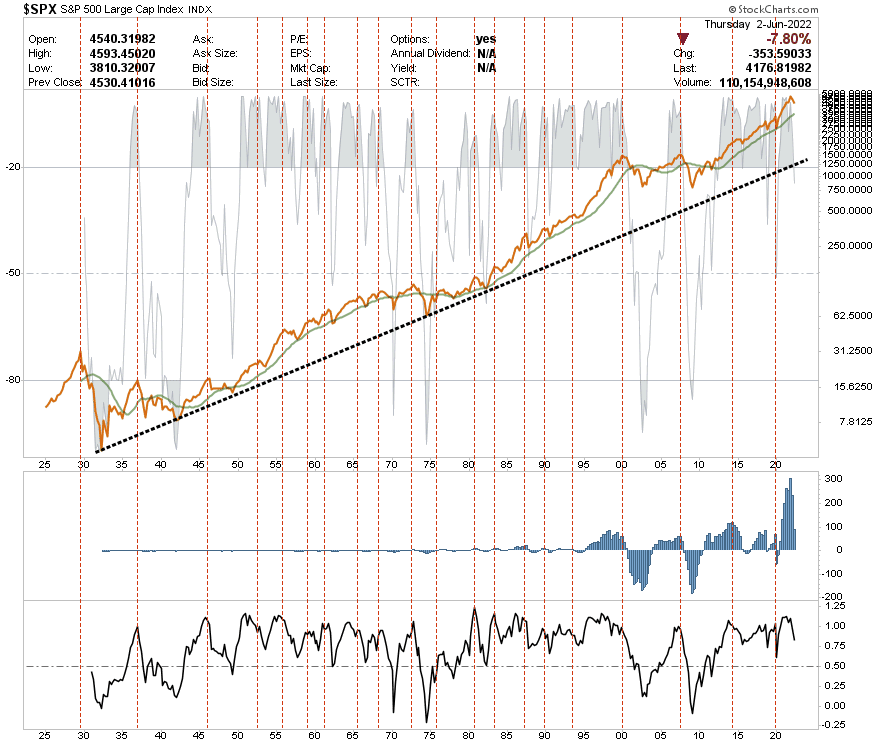
While this does NOT mean that a “market crash” is imminent, it does align with previous long-term periods of low returns.
This Week’s MacroView

No Stress On The Fed…Yet
Regardless of the technical review, the bearish case hinges on the Fed remaining aggressive in tightening monetary policy. For now, that certainly appears to be the case, as there is little market stress to deter them from continuing their focus on combatting inflation.
When it comes to the financial markets, the Fed’s primary focus is “financial stability.” After the financial crisis, the stability of credit markets became a primary focus of the Federal Reserve. As noted previously:
“With the financial ecosystem now more heavily levered than ever, the “instability of stability” is now the most significant risk. The “stability/instability paradox” assumes that all players are rational and such rationality implies avoidance of complete destruction. In other words, all players will act rationally, and no one will push “the big red button.”
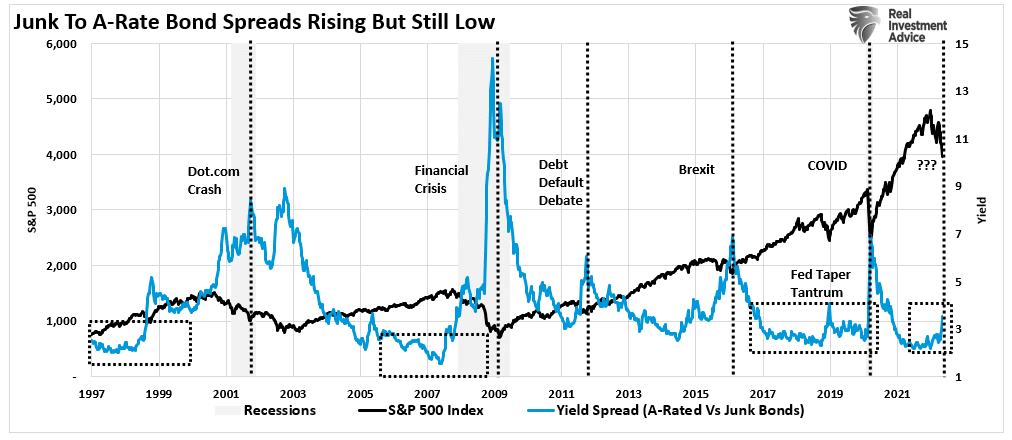
While retail investors wonder when the Fed will intervene, there is little evidence of severe market stress. Currently, credit spreads are not spiking, suggesting the bond market is functioning normally. With inflation running hot, the spread between junk and A-rated bonds gives the Fed room to hike rates for now.
While credit spreads have risen and markets declined, such has remained orderly, as shown by the subdued rise in volatility. However, the Fed is sensitive to credit markets and previously acted quickly at the first hint of turmoil.
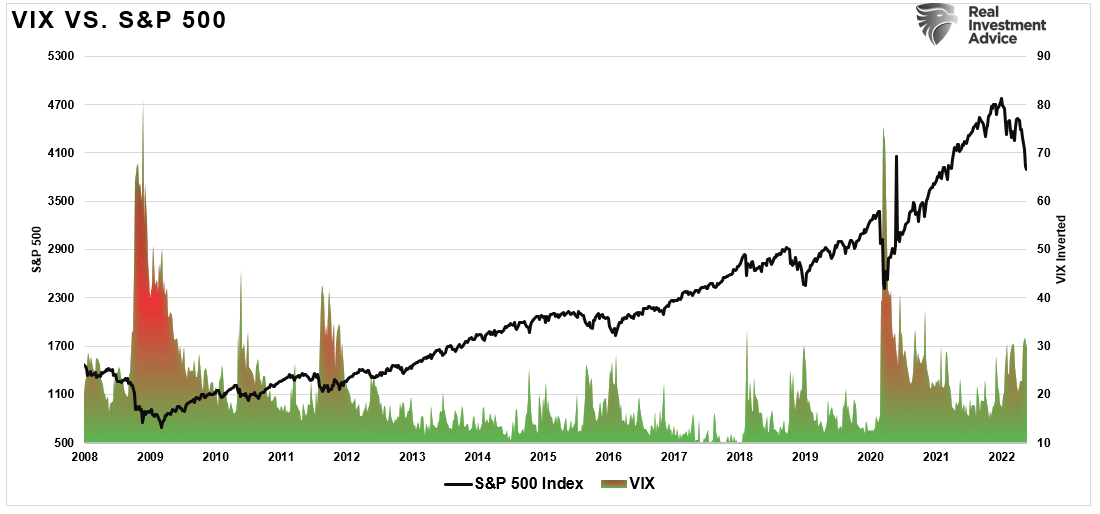
However, make no mistake, as the Fed continues to hike rates, there is an increasing risk that “orderly” markets rapidly become “disorderly. “
At that point, the bearish view will likely already be well entrenched.

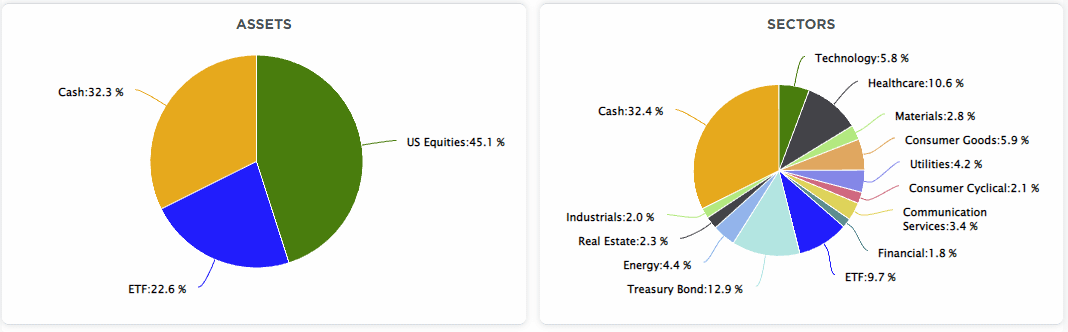
Portfolio Update
Over the last week, we made minor changes to our portfolio as the reflexive rally continued its course. However, with markets already overbought short-term, there is a likelihood of a “pause” in the advance for now.
As noted in this week’s technical review, we continue to suggest using rallies to reduce risk and increase cash levels somewhat for now. There will be plenty of time to determine if and when the current bearish cycle of the market is over. We remain pretty confident we have not reached that point just yet.
In Bullish Or Bearish, we provided some simple guidelines to follow:
- Tighten up stop-loss levels to current support levels for each position. (Provides identifiable exit points when the market reverses.)
- Hedge portfolios against significant market declines. (Non-correlated assets, short-market positions, index put options, bonds.)
- Take profits in positions that have been big winners (Rebalancing overbought or extended positions to capture gains but continue participating in the advance. Think “energy” stocks.)
- Sell laggards and losers. (If something isn’t working in a market rally, it most likely won’t work during a broad decline. Better to eliminate the risk early.)
- Raise cash and rebalance portfolios to target weightings. (Rebalancing risk regularly keeps hidden risks somewhat mitigated.)
Notice, nothing in there says, “sell everything and go to cash.”
Given the weight of evidence currently at hand, it certainly doesn’t hurt to plan and even take some actions to prepare for the next downturn.
If the environment changes, it’s a simple process to reallocate aggressively to equities. By planning, the worst that can happen is underperformance if the bull market suddenly resumes.
Have a great week.
Market & Sector Analysis
S&P 500 Tear Sheet
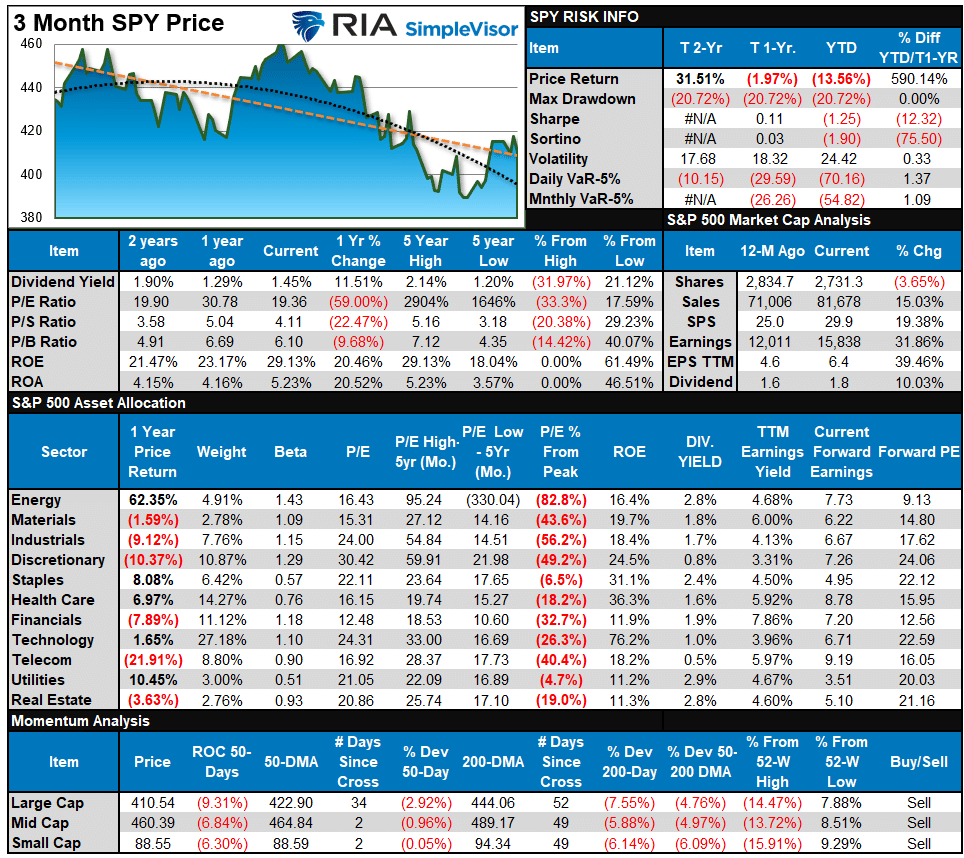
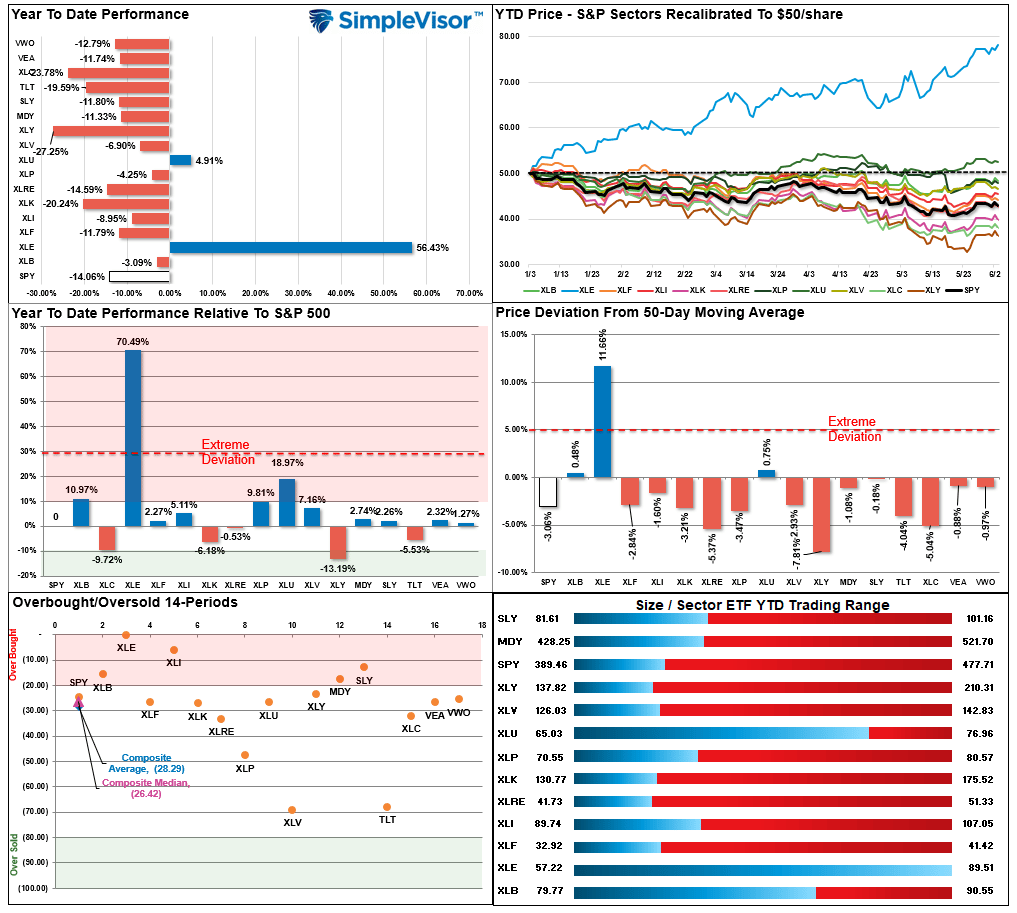
Relative Performance Analysis
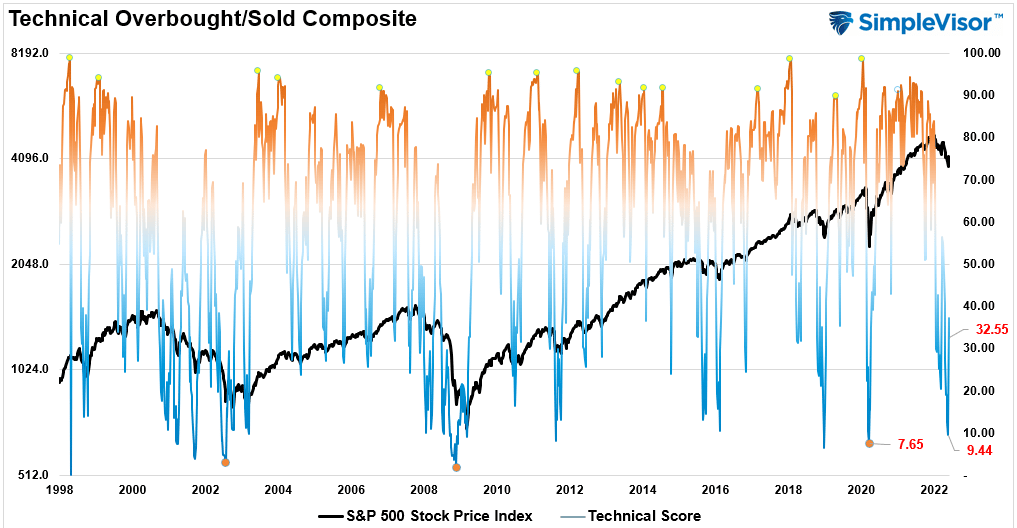
Technical Composite
The technical overbought/sold gauge comprises several price indicators (RSI, Williams %R, etc.), measured using “weekly” closing price data. Readings above “80” are considered overbought, and below “20” are oversold. The current reading is 32.55 out of a possible 100.
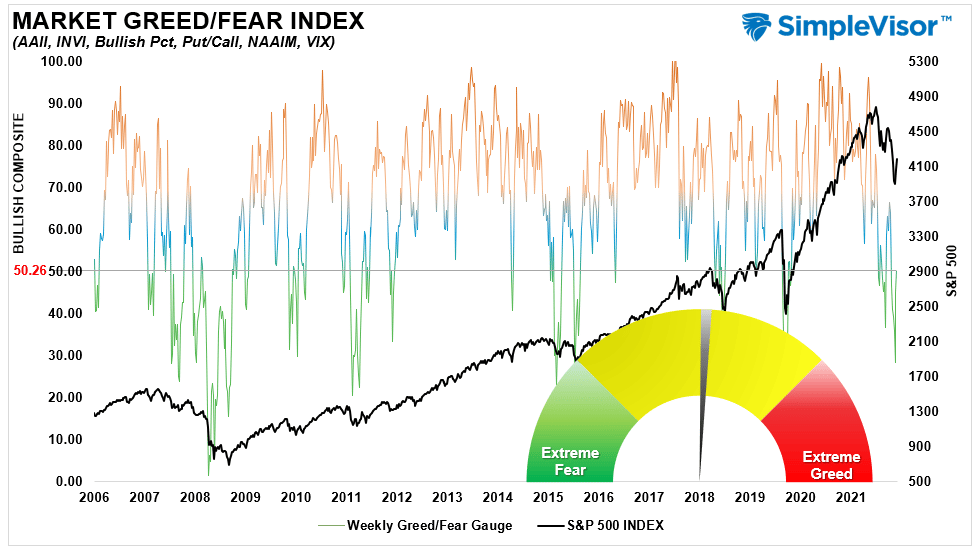
Portfolio Positioning “Fear / Greed” Gauge
The “Fear/Greed” gauge is how individual and professional investors are “positioning” themselves in the market based on their equity exposure. From a contrarian position, the higher the allocation to equities, to more likely the market is closer to a correction than not. The gauge uses weekly closing data.
NOTE: The Fear/Greed Index measures risk from 0 to 100. It is a rarity that it reaches levels above 90. The current reading is 50.26 out of a possible 100.
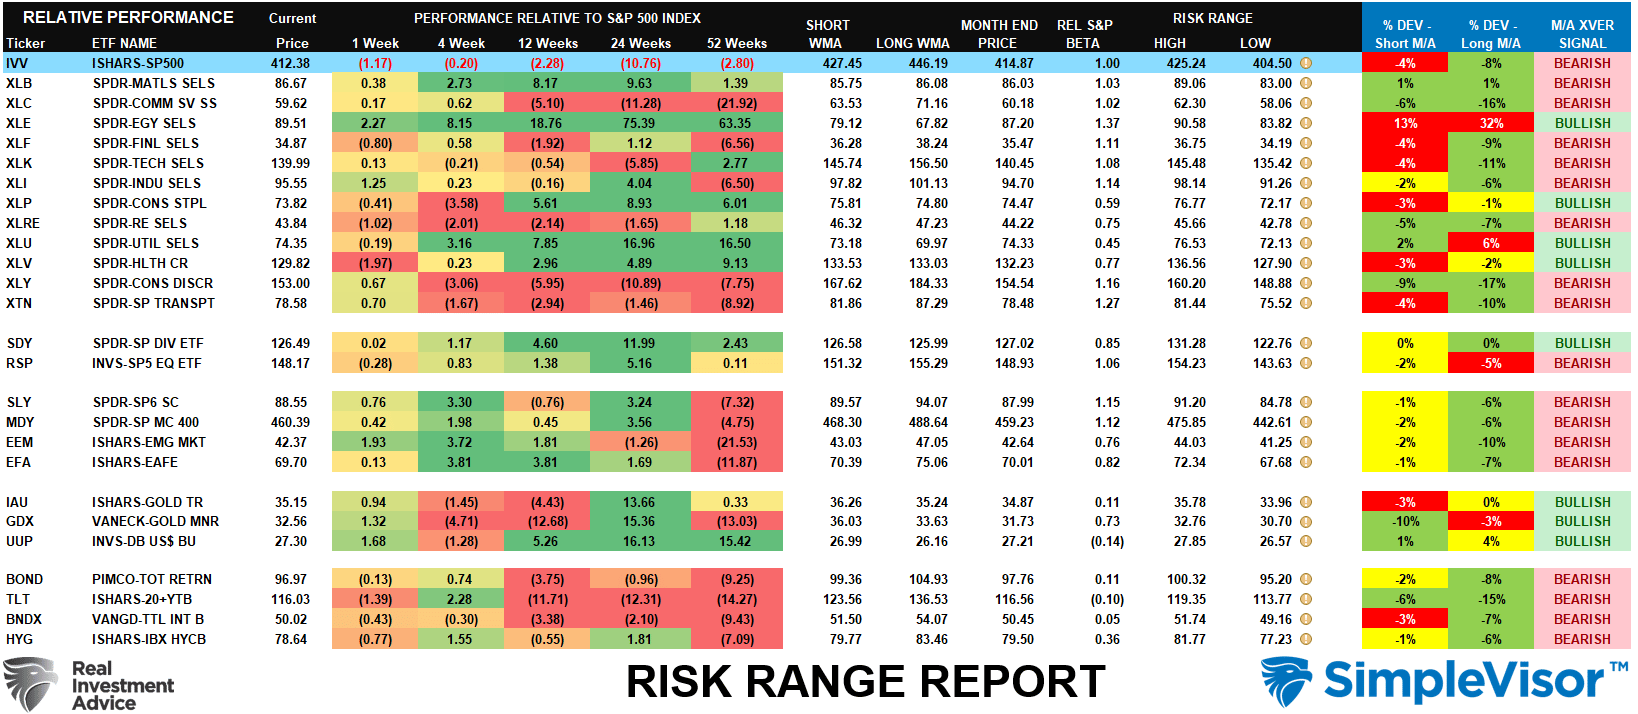
Sector Model Analysis & Risk Ranges
How To Read This Table
- The table compares the relative performance of each sector and market to the S&P 500 index.
- “M/A XVER” is determined by whether the short-term weekly moving average crosses positively or negatively with the long-term weekly moving average.
- The risk range is a function of the month-end closing price and the “beta” of the sector or market. (Ranges reset on the 1st of each month)
- The table shows the price deviation above and below the weekly moving averages.
- The complete history of all sentiment indicators is under the Dashboard/Sentiment tab at SimpleVisor.
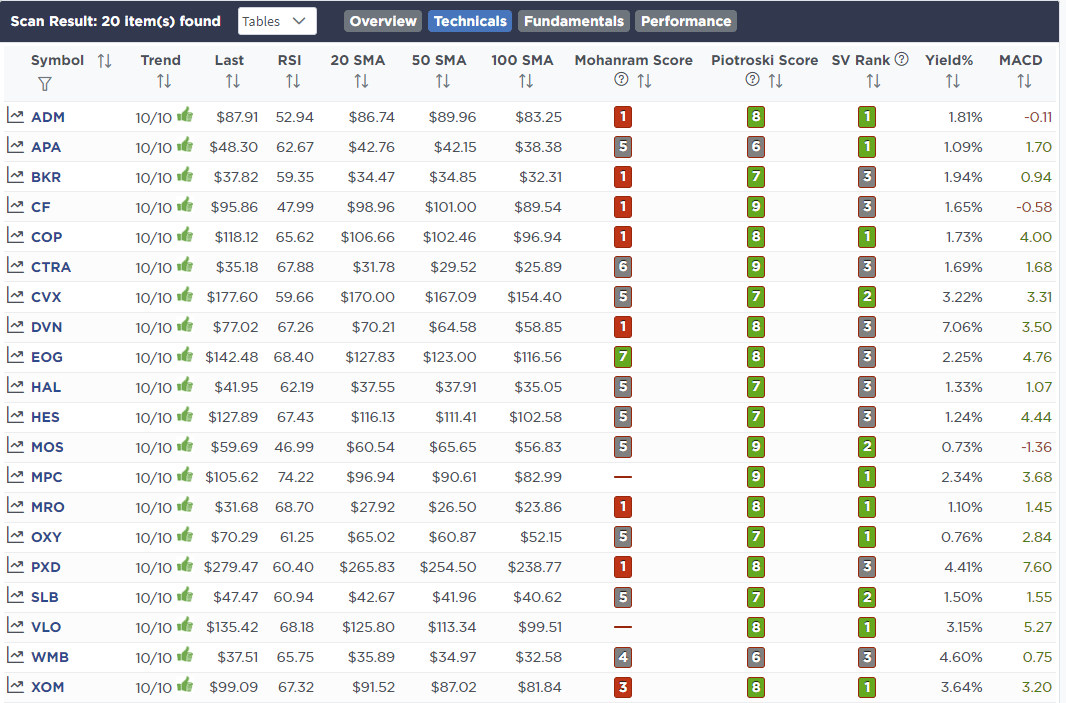
Weekly Stock Screens
Each week we will provide three different stock screens generated from SimpleVisor: (RIAPro.net subscribers use your current credentials to log in.)
This week we are scanning for the Top 20:
- Relative Strength Stocks
- Momentum Stocks
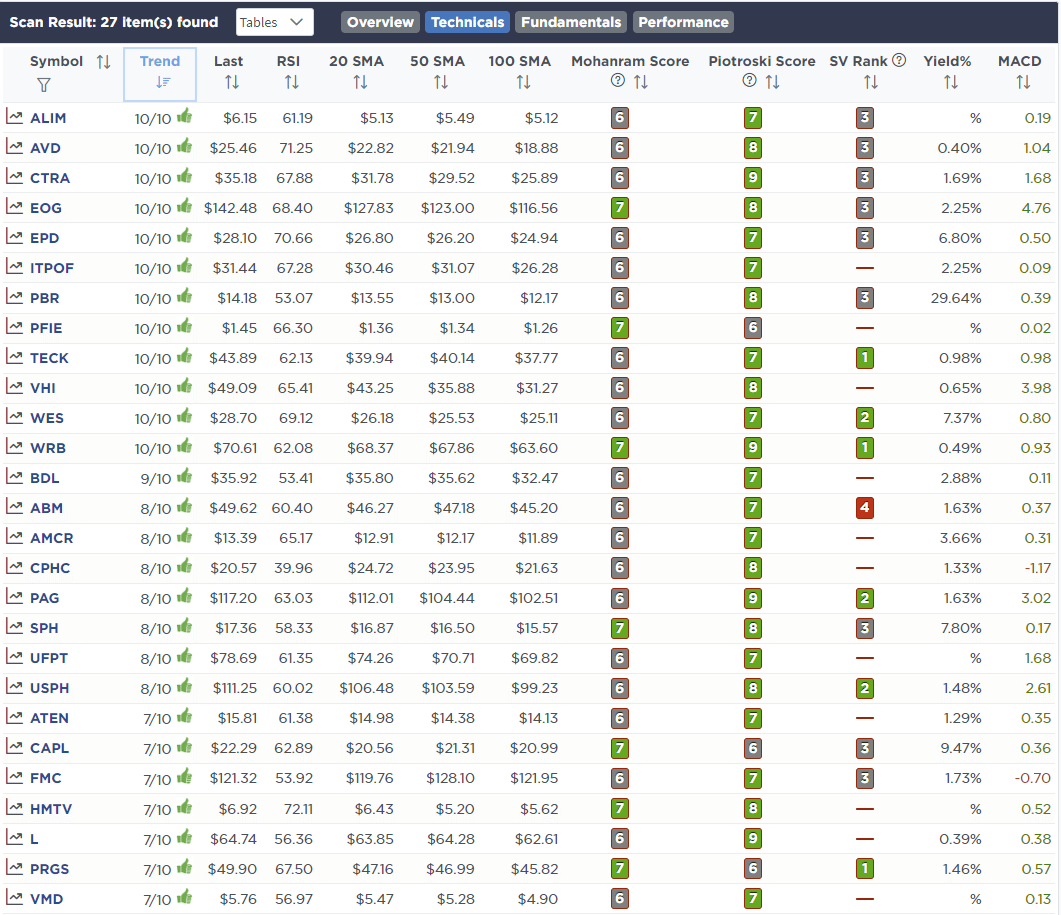
- Technically Strong With Strong Fundamentals
These screens generate portfolio ideas and serve as the starting point for further research.
(Click Images To Enlarge)
RSI Screen
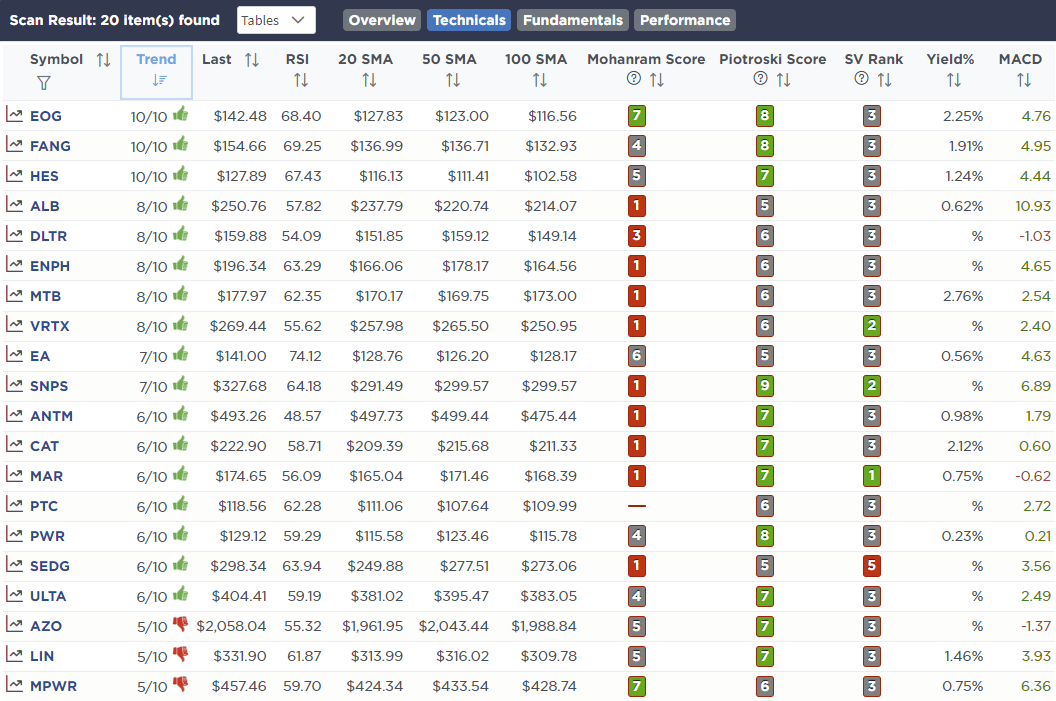
Momentum Screen
Technical & Fundamental Strength Screen
SimpleVisor Portfolio Changes
We post all of our portfolio changes as they occur at SimpleVisor:
May 31st
“As discussed recently, we are using this rally to start rebalancing portfolio risk and raising additional cash levels heading into June. While the reflexive rally has been strong, we are still dealing with a Fed hiking interest rates and beginning to tighten their balance sheet in June. We are taking some small actions today and will continue to “nip and tuck” as this rally continues to wherever it is headed.”
Equity Model
- Sell 100% of Waste Management (WM)
- Reduce Albemarle (ALB) to 3% of the portfolio
ETF Model
- Reduce SPDR Energy Sector (XLE) to 3% of the portfolio
- Reduce Global X Lithium ETF (LIT) to 1.5% of the portfolio

Lance Roberts, CIO
Have a great week!


