
Inside This Week’s Bull Bear Report
- End Of QT Sets Up Return Of QE
- How We Are Trading It
- Research Report – Full-Time Jobs Suggest Recession Risks
- Youtube – Before The Bell
- Market Statistics
- Stock Screens
- Portfolio Trades This Week
Market Review And Update
Last week’s newsletter discussed the failure of the first five days of January and what that historically means for the rest of the year. However, as we noted:
“Nonetheless, the market has remained rangebound since the highs of December. The market remains on a sell-signal while the overbought conditions, as the RSI shows, are slowly being reduced. Notably, the S&P 500 index has held support at the 20-DMA, which keeps the bullish trend intact.“
That consolidation likely ended on Friday, with the market breaking out to set a new all-time high for the S&P 500. As is always the case, the media was quick to jump on the headline as well:
“Friday’s milestone confirms that the stock market is officially in a bull market that began in October 2022, and not just a bounce within a bear market. The S&P 500 is up more than 35% since that low.” – CNBC
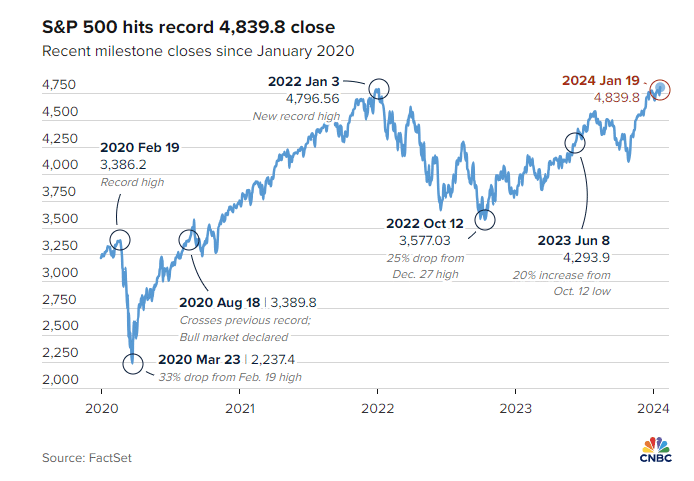
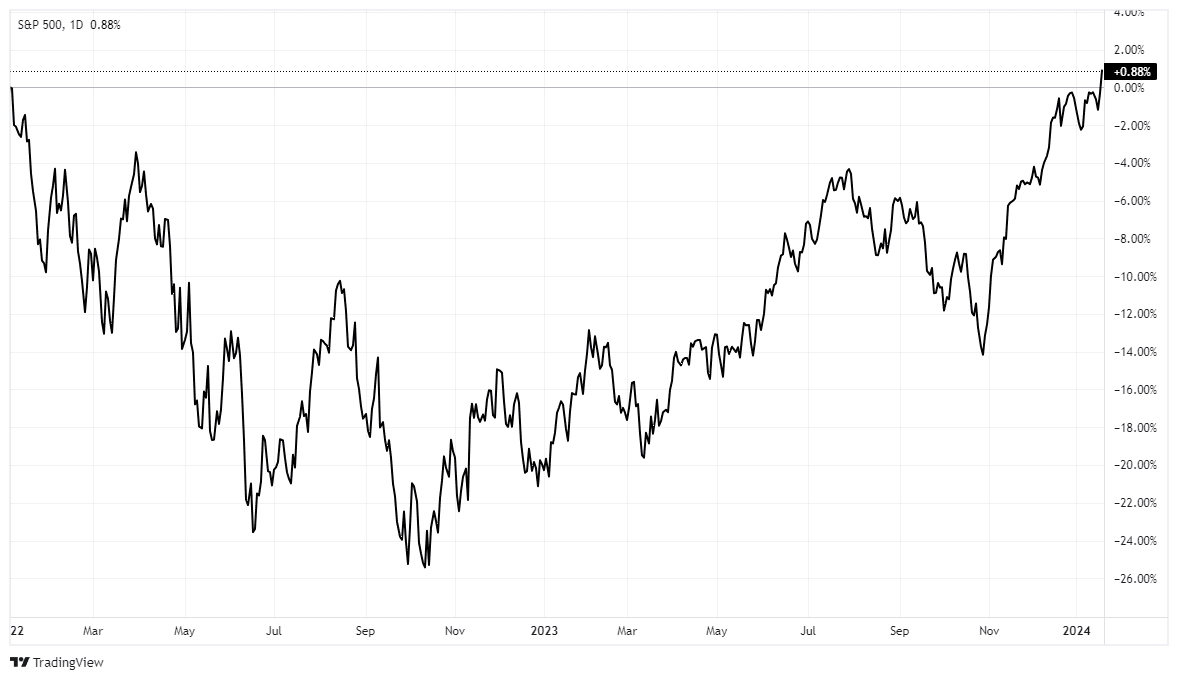
Of course, while the rally of 35% from last October’s lows was fantastic, the media never told you to sell in the first place. Therefore, for most, the 35% rally was used to get back to even. Notably, the “buy and hold” crowd has finally achieved a positive return after 24 months of just 0.88%.
Nonetheless, the breakout to new highs is encouraging and suggests the two-year market correction process is behind us. The action is bullish from a technical perspective. However, the more overbought conditions have failed to correct meaningfully, suggesting further upside from current levels may be somewhat limited. I expect we will likely see another corrective phase before the end of summer.

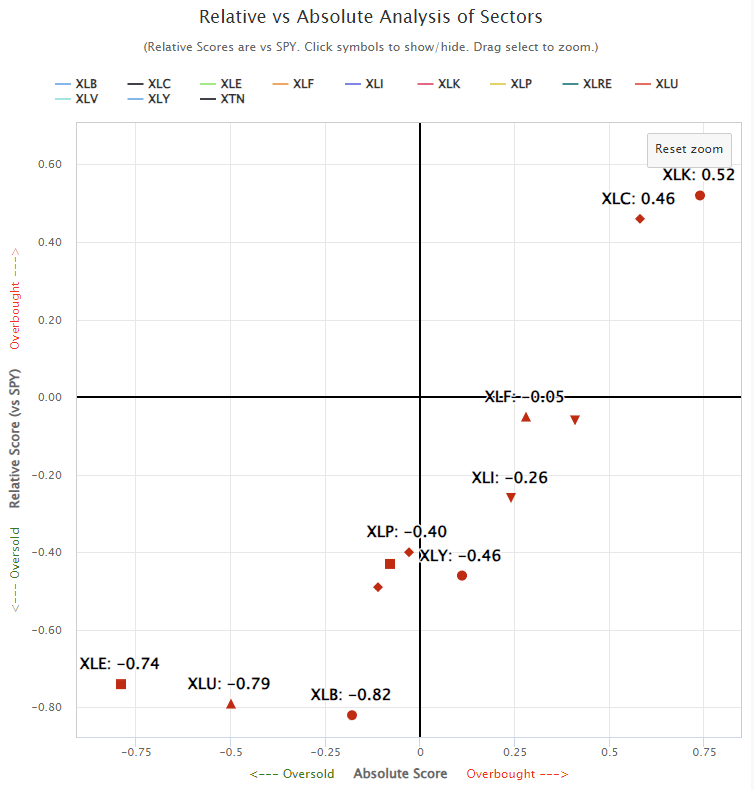
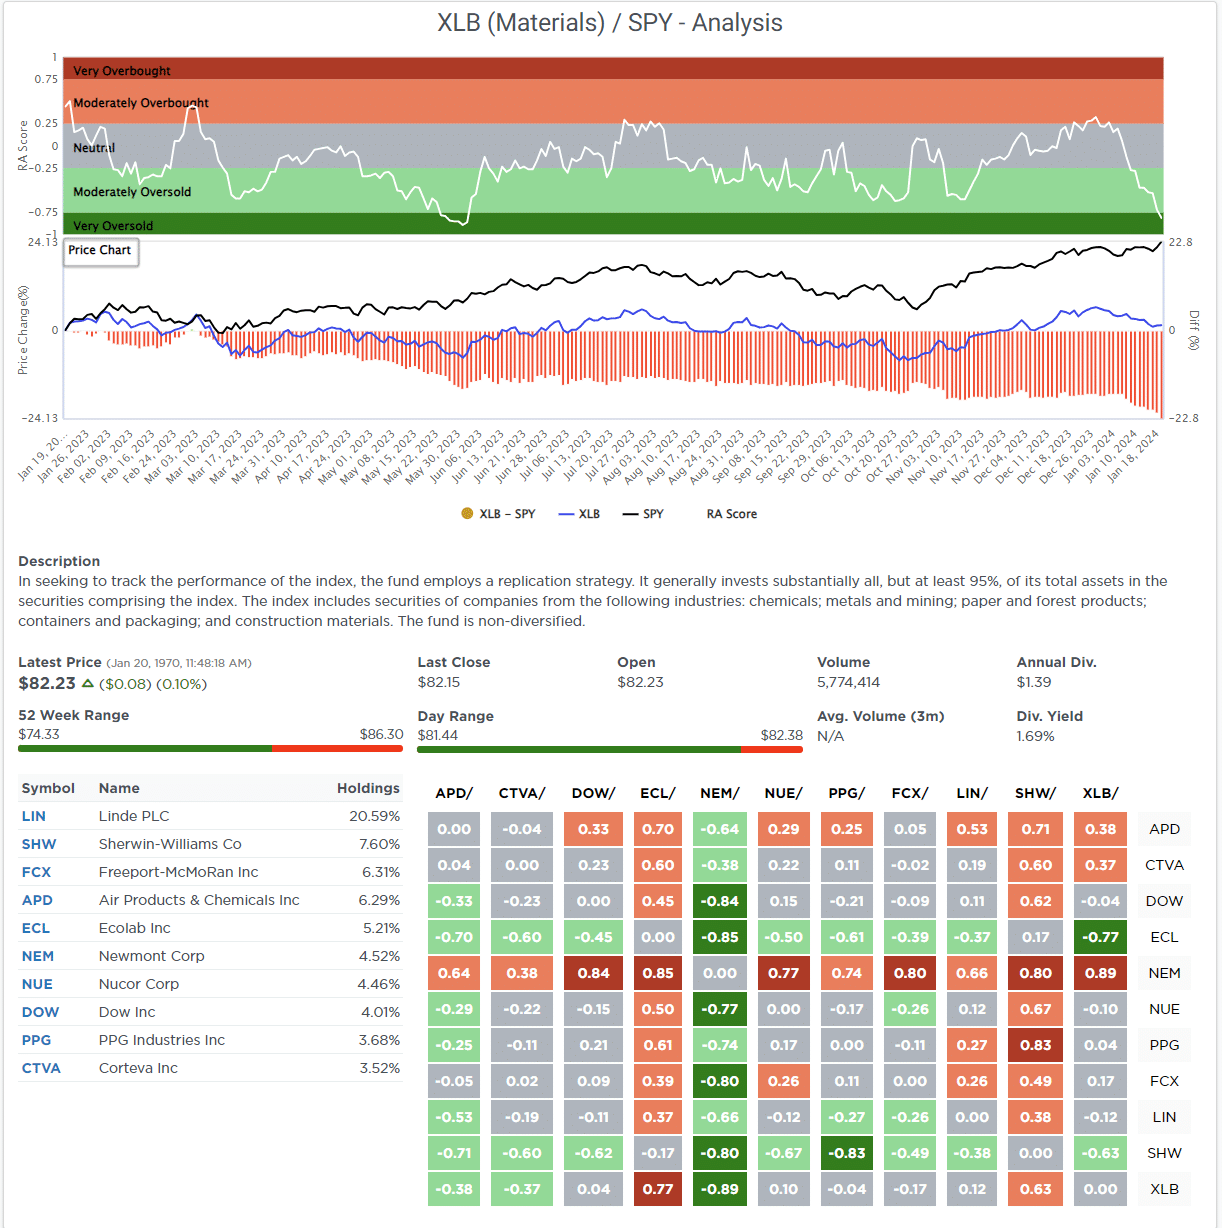
While there seems to be little concern in the market currently, particularly given the low levels of volatility, the rally has once again become very narrow, with the A.I. stocks and the “Magnificent 7” leading the charge. The Simplevisor Relative Rotation Analysis shows this issue more clearly.
And, as in 2023, we see the performance gap between the market capitalization and equal-weighted indices.

Given that the big Mega-capitalization stocks are a place of safety where major asset managers can place large amounts of capital, and the bulk of expected earnings growth will come from those companies, it is not surprising we are seeing the divergence again. Such is also unsurprising given the increased expectations for a significant easing of monetary policy this year as the Fed not only cuts rates but readies the markets for the end of QT.
But is there a risk we are unaware of?
Investing Summit: Get Your Tickets Today
January 27th, we are hosting a live event featuring Greg Valliere to discuss investing in the 2024 presidential election. What will a new president mean for the markets, the risks, and where to invest through it all? Greg will be joined by Lance Roberts, Michael Lebowitz, and Adam Taggart for morning presentations covering everything you need to know for the New Year.
Register now, as there are only 150 seats. The session is a LIVE EVENT, and no recordings will be provided.

End Of QT Looks To Be Upon Us
In “Wall Street Is Optimistic,” we stated:
“Here is our concern with the bullish scenario. It entirely depends on a “no recession” outcome, and the Fed must reverse its monetary tightening.
The issue with that view is that IF the economy does indeed have a soft landing, there is no reason for the Federal Reserve to reverse reducing its balance sheet or lower interest rates. More importantly, the rise in asset prices eases financial conditions, which reduces the Fed’s ability to bring down inflation. Such would also presumably mean employment remains strong along with wage growth, elevating inflationary pressures.”
In other words, without some sort of “financial strain,” there is little need for the Federal Reserve to reverse its course of action. However, as noted in the “Markets Are Front Running The First Cut,” we discussed the Fed’s and investor’s psychological change. To wit:
“Since 2008, the Fed has trained investors. Any financial or recessionary event jeopardizing the markets would be met with rate cuts and accommodative policy. That training was completed with the Fed’s response to the “pandemic-era shutdown” that led to massive monetary and fiscal interventions.”
With that understanding, there has recently been a notable change in the Fed’s position on both rate cuts and the end of QT (Quantitative Tightening.) In just two weeks, the Fed shocked the markets by pivoting from saying it was “premature to speculate on rate cuts” to discussing the timeline to start rate cuts.

During this same period, economic data remained robust, employment data was strong, and financial and credit markets were bullish. However, even with that strong backdrop, Goldman Sachs is speculating that not only will the Fed start cutting rates but that the end of QT is rapidly approaching.

Here is the critical question we must answer to understand the end of QT.
“If the economic data is strong, and financial conditions are improving, then what does the Fed know that we don’t?”
A Repeat Of 2019
Let me start by saying that we do NOT know with certainty why the Federal Reserve has reversed so rapidly. However, some data suggests financial risks have risen in recent months. One of those issues is overnight funding rates, which we discussed two weeks ago in “Sell-Off Starts The New Year.”
“There is some evidence of stress in the repo market, similar to that seen in 2019. The spread between the Treasury repo market and the fed funds rate has jumped sharply.”
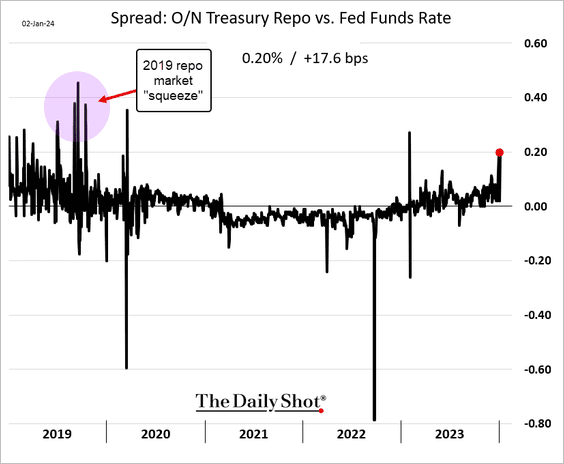
Notably, this was much the same in 2019. While employment was fine and economic growth stable, much like today, in June 2019, the Fed started cutting rates and supplementing liquidity to the repo market. By September, there was a clear liquidity issue in the overnight markets. At the same time, we discussed the many recessionary signals suggested by both the NFIB surveys and yield curve inversions. Yet, again, similar to today, there was no sign of recession, just signals.
In March 2020, the recession arrived as the pandemic was the unexpected exogenous event that finally shattered the already fragile economy and financial system.
Simultaneously, another risk to the financial stability is the rapid reduction in Treasury liquidity. This week, Michael Lebowitz, CFA, addressed this point in our Daily Market Commentary.
“Fed Tiptoes Toward Dialing Back Key Channel of Monetary Tightening,” by Nick Timiraos, appeared in Tuesday’s Wall Street Journal. Author Nick Timiraos, a.k .a. the Fed Whisperer, is often the recipient of Fed leaks. Tuesday’s article alludes that the Fed may soon slow down the pace of QT. As we have written, the Fed’s overnight repo program, designed to absorb excess liquidity, is drying up rapidly, as shown below. Pandemic-related liquidity is exiting the financial system, and risks are increasing. Consequently, as we wrote a few days ago, the combination of QT and declining repo balances is forcing repo rates higher and, with it, liquidity warnings.
The quote below from the article best articulates how dislocations in the repo markets are market signals the Fed is keying on. Given recent pricing issues in the repo market, QT is likely to be tapered well before the Fed reaches its inflation target. The Fed doesn’t want liquidity problems to force them to lower rates prematurely or flip QT to QE. They also recognize they are not good at predicting when liquidity will dry up. Accordingly, they appear willing to taper QT and possibly cut rates earlier than initially thought to ensure the financial markets remain liquid.
Officials say they are going to rely more on market signals in identifying the right level of reserves. ‘Last time, we had lots of estimates of where we thought that terminal level of reserves was, and our estimates were too low,’ Philadelphia Fed President Patrick Harker said in an October interview. ‘At the end of the day, the market will dictate where we are.’”
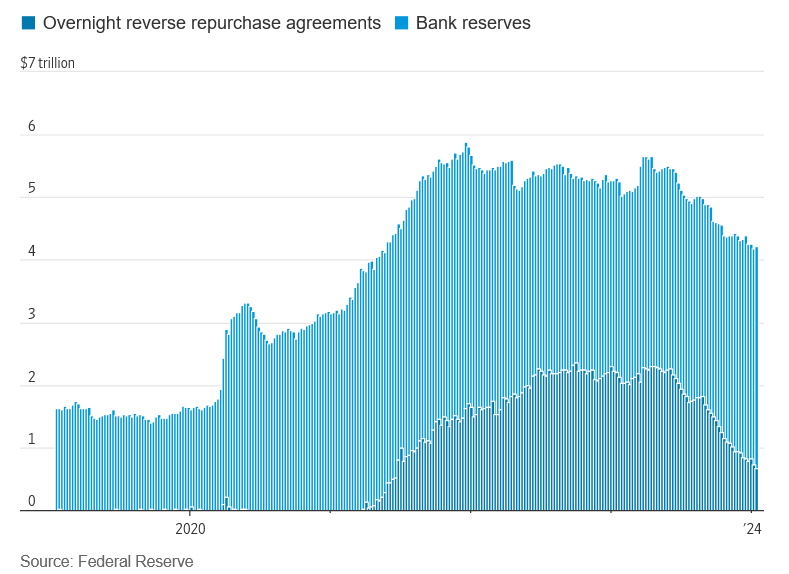
In summation, the increase in reverse repurchase rates, the decrease in bank reserves, and the decline in overnight reverse repurchase agreements suggest a more rapid drain in financial system liquidity. Such indicates that the financial system is not nearly as stable as many believe and also explains the reversal of the Fed’s view on “higher for longer.”
End Of QT = Beginning Of QE
What does all this mean for the financial markets?
The Fed will have to cut rates and eventually increase its balance sheet to reverse the liquidity drain and release the pressure on overnight lending rates. Since zero-interest policy and the beginning and end of QT and QE are phenomena of only the past decade, we have a pretty clear picture of what this means for stocks and bonds.
In that regard, BofA’s recent survey of investment professionals asked about the biggest driver of equity prices in 2024. While fundamentals and corporate earnings should have been the top answer, 52 percent said “The Fed.” However, since “Liquidity” is controlled by the Fed, it was 59%.

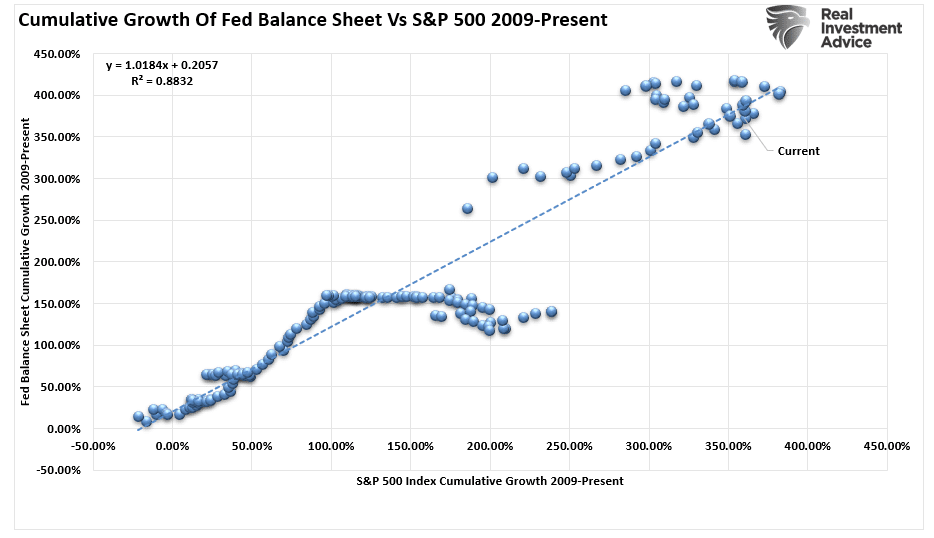
From a stock market perspective, the change in Fed policy, which will lead to an increase in liquidity, correlates with the rise in asset prices. Of course, since the market anticipates future outcomes, it is rising ahead of any actual changes by the Fed.
While many discount the linkage between the end of QT, the start of QE, and the markets, there is most definitely a psychological one, as discussed in “Pavlov’s Experiment.”
Classical conditioning (also known as Pavlovian or respondent conditioning) refers to a learning procedure in which a potent stimulus (e.g., food) is paired with a previously neutral stimulus (e.g., a bell). Pavlov discovered that when the neutral stimulus was introduced, the dogs would begin to salivate in anticipation of the potent stimulus, even though it was not currently present. This learning process results from the psychological “pairing” of the stimuli.
In 2010, then Fed Chairman Ben Bernanke introduced the “neutral stimulus” to the financial markets by adding a “third mandate” to the Fed’s responsibilities – the creation of the “wealth effect.”
Importantly, for conditioning to work, the “neutral stimulus,” when introduced, must be followed by the “potent stimulus” for the “pairing” to be completed. For investors, as each round of “Quantitative Easing” was introduced, the “neutral stimulus,” the stock market rose, the “potent stimulus.”
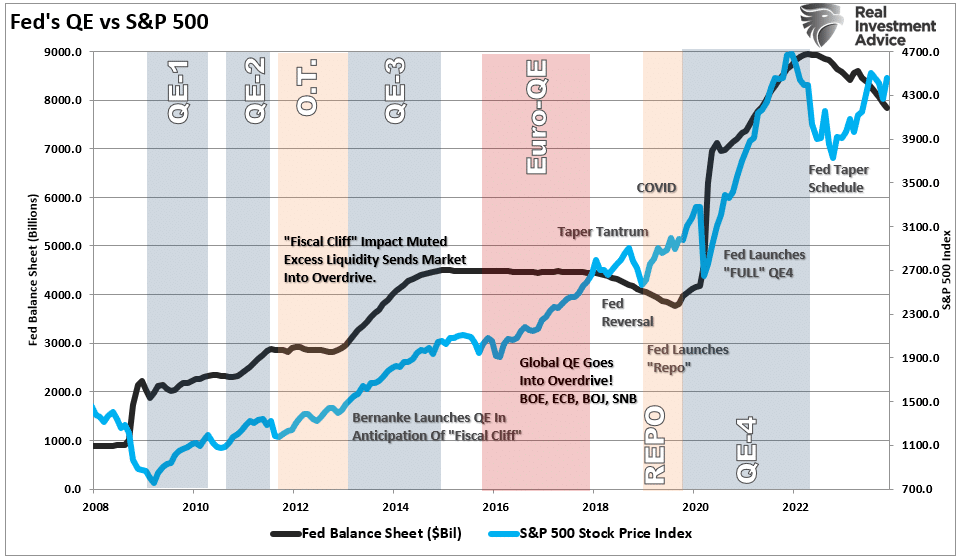
While there has been previous debate on the impact of the Fed’s balance sheet changes on the markets, there is a very high correlation between the two, as shown in the first chart above, suggesting it is more than a coincidence. Secondly, longer-term rates decline when the Federal Reserve cuts rates on the short end of the curve to reduce pressure on the financial system.

While the end of QT and initial rate cuts may be viewed negatively and may coincide with some level of economic or financial disruption, stocks and bonds should appreciate in the longer term due to the increased financial liquidity.
How We Are Trading It
While there is no significant evidence of financial fragility, the recent change in policy stance by the Federal Reserve is undoubtedly a warning. As in 2019, we did not know until after the fact that the Fed was bailing out banks and hedge funds. Such may well be the case this time. We won’t know for sure until after the fact, but something has worried the Federal Reserve. As such, we remain vigilant to increased market and portfolio risks. Historically, asset prices and yields decline during initial rate cuts in response to an economic recession or financial event. The question is whether the Fed is acting early enough to stave off that potential risk.
However, as noted above, the breakout to new highs keeps us bullishly biased toward the markets. The number of stocks trading above the 50- and 200-DMA remains healthy, and volatility remains low, suggesting little reason to be overtly concerned about financial conditions. As such, we will look for opportunities to increase our exposure to full target weightings.
That said, we also understand that the market is not devoid of risks that could evolve quickly and lead to a significant reduction of principal when least expected. The recent condensation of leadership is a warning in and of itself and has been present at previous market peaks. Is that the case today? Maybe. But that is why we adhere to our technical analysis and trading rules accordingly.
Have a great week.
Research Report

Subscribe To “Before The Bell” For Daily Trading Updates
We have set up a separate channel JUST for our short daily market updates. Please subscribe to THIS CHANNEL to receive daily notifications before the market opens.
Click Here And Then Click The SUBSCRIBE Button
Subscribe To Our YouTube Channel To Get Notified Of All Our Videos
Bull Bear Report Market Statistics & Screens

SimpleVisor Top & Bottom Performers By Sector

S&P 500 Weekly Tear Sheet
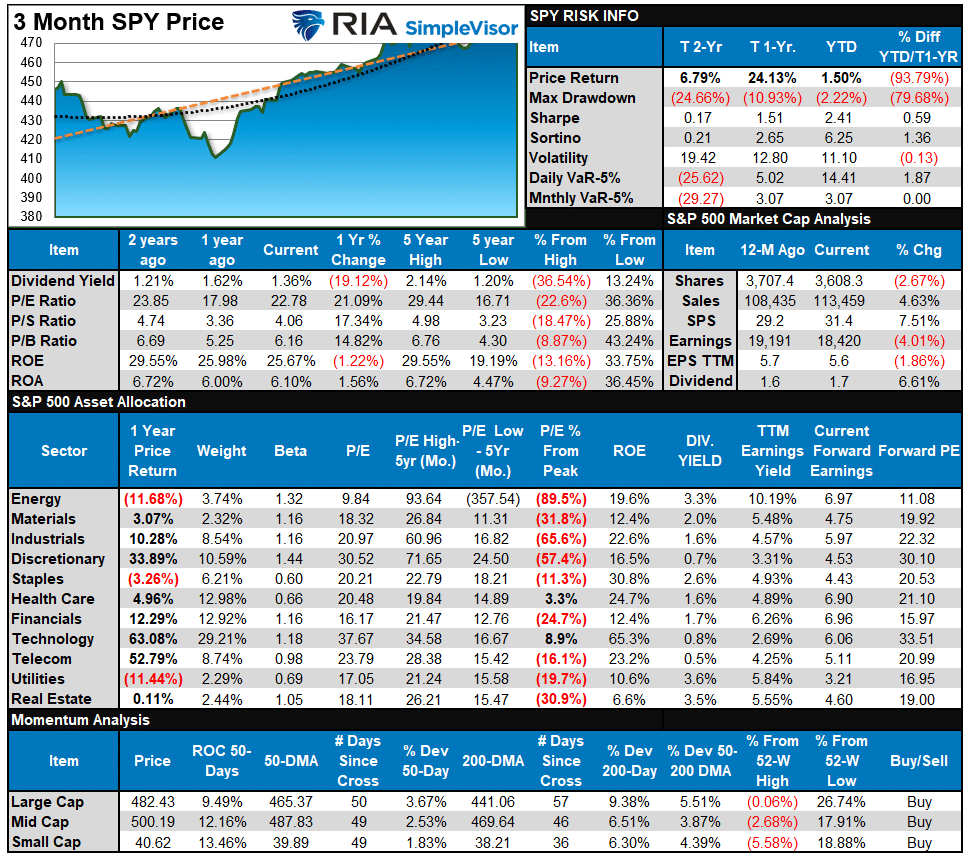
Relative Performance Analysis
On Friday, the market finally set an all-time closing high. That’s the good news. The not-so-good news is that the high was set by just a handful of stocks leading the way. As shown, the only sectors to have a positive return on a YTD basis are Technology (AAPL, MSFT, NVDA), Communications (META, GOOG), and a handful of Healthcare and Financial stocks. Outside of that, the vast majority of sectors and markets are dragging.
As such, the “capitalization-weighted index” is overbought, but the Composite index average and median are not. We would not be surprised to see a bit of rotation from leaders to laggards. Still, given the Fed’s reversal to more liquidity, we will likely continue to see high-beta names continue to lead the charge until, or unless, we start to see a significant slowdown in economic activity.
Technical Composite
The technical overbought/sold gauge comprises several price indicators (R.S.I., Williams %R, etc.), measured using “weekly” closing price data. Readings above “80” are considered overbought, and below “20” are oversold. The market peaks when those readings are 80 or above, suggesting prudent profit-taking and risk management. The best buying opportunities exist when those readings are 20 or below.
The current reading is 88.22 out of a possible 100.

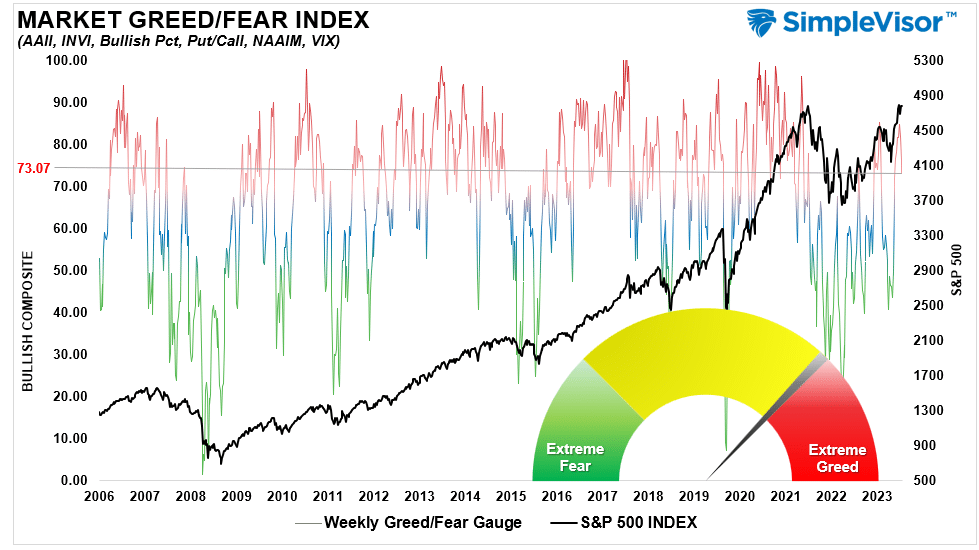
Portfolio Positioning “Fear / Greed” Gauge
The “Fear/Greed” gauge is how individual and professional investors are “positioning” themselves in the market based on their equity exposure. From a contrarian position, the higher the allocation to equities, the more likely the market is closer to a correction than not. The gauge uses weekly closing data.
NOTE: The Fear/Greed Index measures risk from 0 to 100. It is a rarity that it reaches levels above 90. The current reading is 73.07 out of a possible 100.
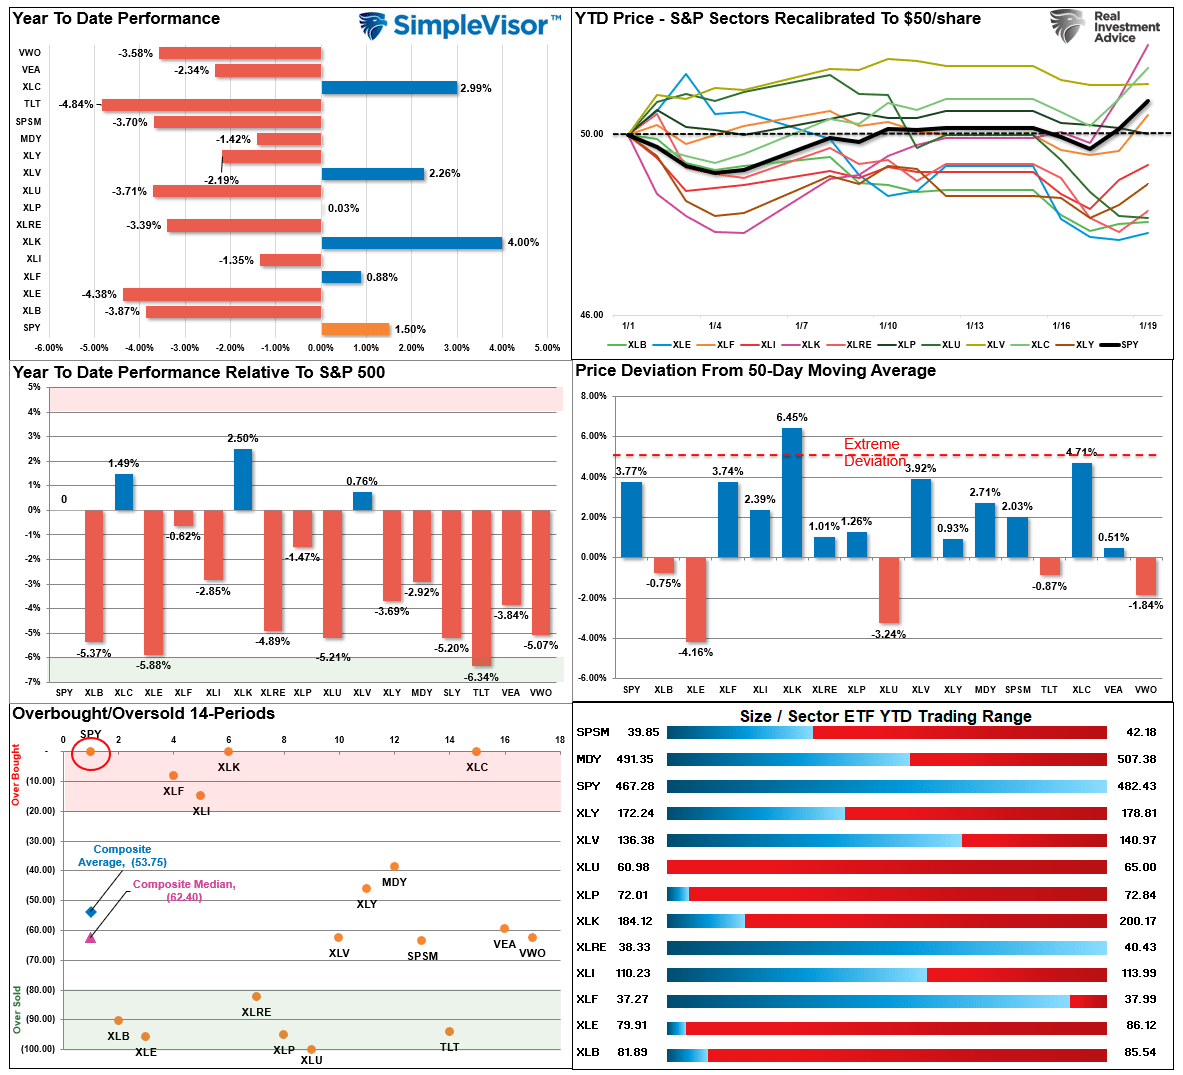
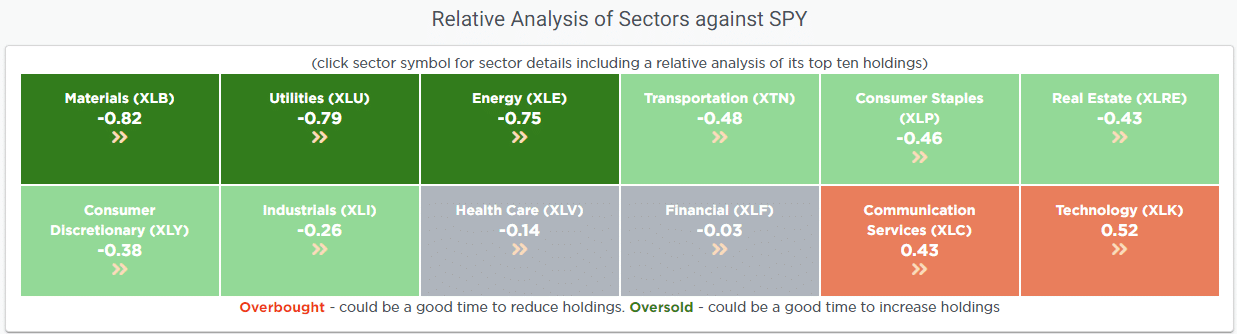
Relative Sector Analysis
Most Oversold Sector Analysis
Sector Model Analysis & Risk Ranges
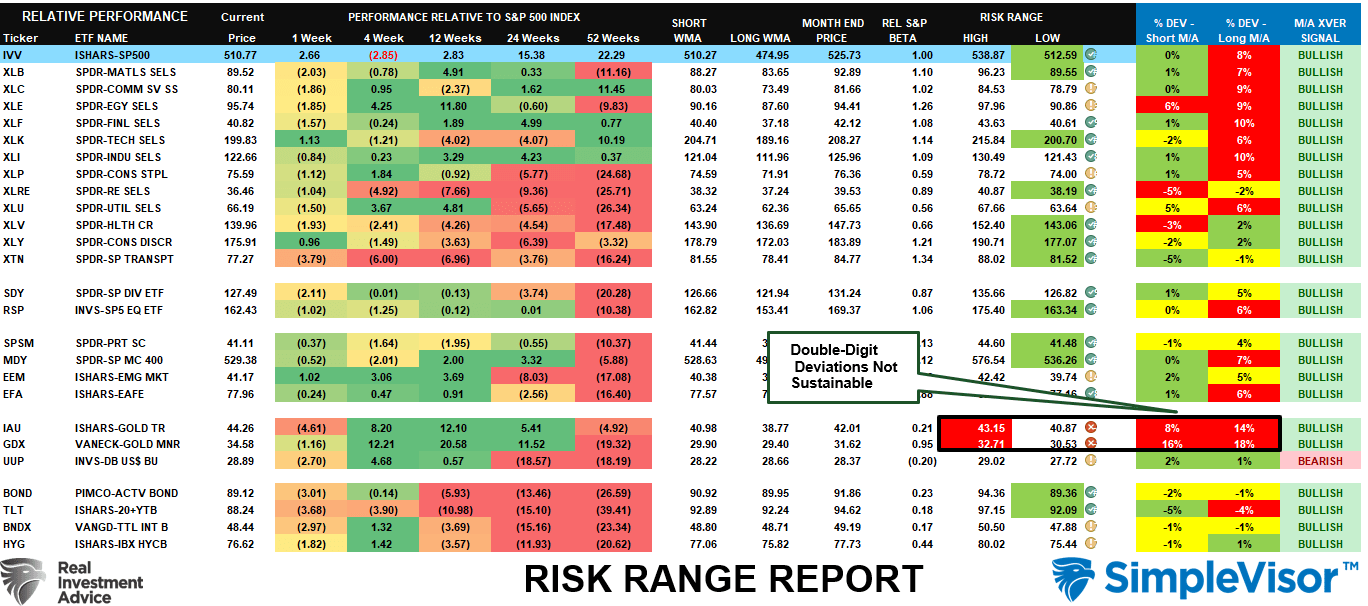
How To Read This Table
- The table compares the relative performance of each sector and market to the S&P 500 index.
- “MA XVER” (Moving Average Crossover) is determined by the short-term weekly moving average crossing positively or negatively with the long-term weekly moving average.
- The risk range is a function of the month-end closing price and the “beta” of the sector or market. (Ranges reset on the 1st of each month)
- The table shows the price deviation above and below the weekly moving averages.
As noted last week:
“So far this year, as noted in the Relative Market Sector Analysis above, it remains a reasonably narrow advance, with only a handful of sectors leading the charge. Transportation, Small Caps, and Gold Miners, all economically sensitive sectors, have been lagging sharply since the beginning of the year. This contrasts last year’s leaders, who remain highly deviated above their short- and long-term weekly moving averages.”
That lead/lag analysis is becoming more evident in the latest analysis as Technology is overbought while the economically sensitive sectors and bonds are oversold. While I would not be surprised to see a rotation occur, given the current backdrop of liquidity, momentum, and weakening economic data, we could continue to see this bifurcation last a while longer.
Weekly SimpleVisor Stock Screens
We provide three stock screens each week from SimpleVisor.
This week, we are searching for the Top 20:
- Relative Strength Stocks
- Momentum Stocks
- Fundamental & Technical Strength W/ Dividends
(Click Images To Enlarge)
R.S.I. Screen

Momentum Screen

Fundamental & Technical Strength

SimpleVisor Portfolio Changes
We post all of our portfolio changes as they occur at SimpleVisor:
No Trades This Week

Lance Roberts, C.I.O.
Have a great week!

