
Inside This Week’s Bull Bear Report
- S&P 500 Index Fails Initial Test
- How We Are Trading It
- Research Report – Full-Time Jobs Suggest Recession Risks
- Youtube – Before The Bell
- Market Statistics
- Stock Screens
- Portfolio Trades This Week
Market Review And Update
Last week’s newsletter discussed how the S&P 500 index failed the Santa Claus Rally. To wit:
“With the Santa Claus Rally a no-show, we will now focus on the return for the first five days and the entire month. The old Wall Street axiom says, ‘So goes the first five days of January, so goes the month, so goes the year.’ Since 1950, there have been only three occurrences when the Santa Rally failed, and the first five days and the month of January were positive. Two out of three years were up over 20%, and 1994 was flat, at -1.5%. The average gain for those 3-years was 14.8%.
Next week, we will know how the first five days turn out.“
Unfortunately, the S&P 500 Index failed that initial test of the New Year by providing a negative return over those first five trading days. As shown in the chart below, the implications of the failure are potentially lower returns for the entire year.

When the S&P 500 index is negative during the first 5 days of the year, it substantially lowers the odds of the year being favorable. Not only do the odds of a positive year decrease, but also the average annual rates of return. However, with that said, while the start of the year has been challenging, we still have a long way to go this year, and many possible outcomes still lie ahead. As such, the markets will focus on the return for January, which, historically, can save the dismal start to the New Year. As Stocktraders Almanac notes:
“Here’s what we found going back to 1938. There were only 13 major errors. Using these 13 major errors, the accuracy ratio is 84.9% for the full 86-year period. Including the 9 flat year errors (less than +/– 5%) the ratio is 74.4% — still effective. For the benefit of the skeptics, the accuracy ratio calculated on the performance of the following 11 months is still solid. Including all errors — major and flat years — the ratio is still a decent 67.4%.
Now for the even better news: In the 52 up Januarys there were only 4 major errors for a 92.3% accuracy ratio. These years went on to post 16.2% average full-year gains and 11.6% February-to-December gains.”

Nonetheless, the market has remained rangebound since the highs of December. The market remains on a sell-signal while the overbought conditions, as the RSI shows, are slowly being reduced. Notably, the S&P 500 index has held support at the 20-DMA, which keeps the bullish trend intact.

So, with that bit of optimism, let’s review the technical backdrop for both the S&P 500 index and Treasury bonds as we kick off the Q4 earnings season.
Investing Summit: Early Bird Registration Available Now
January 27th, we are hosting a live event featuring Greg Valliere to discuss investing in the 2024 presidential election. What will a new president mean for the markets, the risks, and where to invest through it all? Greg will be joined by Lance Roberts, Michael Lebowitz, and Adam Taggart for morning presentations covering everything you need to know for the New Year.
Register now, as there are only 150 seats. The session is a LIVE EVENT, and no recordings will be provided.

S&P 500 Index Q4 Earnings Season Coming Soon
On Tuesday, we will discuss the beginning of the Q4-2023 earnings season. As is always the case, Wall Street analysts were particularly aggressive in cutting estimates for Q4 during the last two months of the year.
Such is interesting, given the sharp rally in stocks during the last two months of the year. Unsurprisingly, we will see many companies “beat” Wall Street estimates. Of course, the high beat rate is always the case due to the sharp downward revisions in analysts’ estimates as the reporting period begins. The chart below shows the changes for the Q4 earnings period from when analysts provided their first estimates.
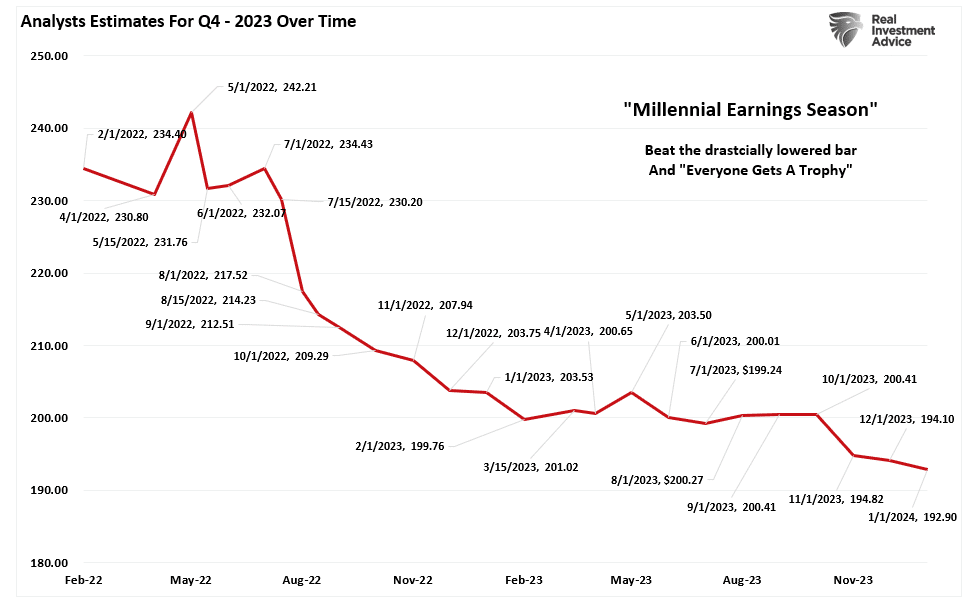
This is why we call it “Millennial Earnings Season.” Wall Street continuously lowers estimates as the reporting period approaches so “everyone gets a trophy.” An easy way to see this is the number of companies beating estimates each quarter, regardless of economic and financial conditions. Since 2000, roughly 70% of companies regularly beat estimates by 5%. Again, that number would be lower if analysts were held to their original estimates.
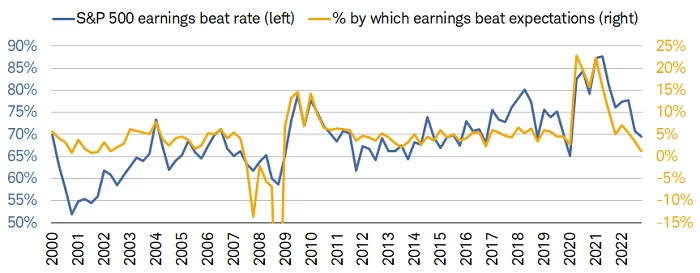
However, such was the case all last year as earnings were regularly lowered to generate a high beat rate. Even with more dramatic cuts to those estimates, the beat rate fell from 85% in 2020 to 65% last year. At the same time, valuations surged as the market’s dramatic price increases outstripped more modest earnings growth.

In other words, investors were willing to pay more for less earnings growth in anticipation of it being made up in the future. However, with economic growth slowing, as seen in much of the economic data as of late, as shown by the Citi Surprise index, those hopes may be disappointed.

Nonetheless, in the short term, the consistent drumbeat of “earnings beats” by companies will help lift the spirits of the markets. While many companies will beat their lowered estimates, investors will focus on the guidance for the rest of the year. As noted in Friday’s blog, CEO confidence is not exactly confident.

So, after a rough start to the year, what are the technicals telling us now?
S&P 500 Index Technical Review
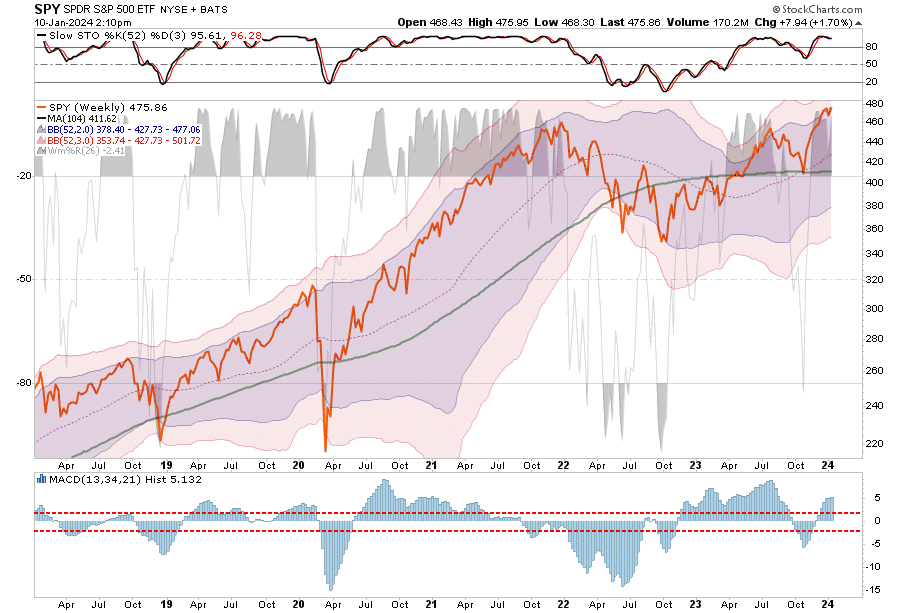
On a technical basis, the market has been consolidating since December. As we noted previously, the more egregious overbought condition of the market would limit upside gains. Such has indeed been the case. However, the good news is that the market consolidation allows the moving averages to catch up, thereby reducing the deviation in early December. While more work is needed, further consolidation can be accomplished over the next few weeks. Notably, the 50-DMA has turned sharply, supporting more bullish price action in the near term.

Our money-flow indicators are also moving through its correctional process and reversing much of the previous overbought condition. Again, while there appears to be more work ahead, we are likely closer to an opportunity to increase equity exposure than not. Furthermore, as noted above, earnings season could catalyze investors to step back into the markets for now.

On a weekly basis, which smooths out the day-to-day volatility, the market remains overbought on many levels. While such does NOT mean the market can not experience a short-term rally, it suggests that gains may be somewhat limited until those excesses are reversed. That is unless there is another massive injection of capital into the markets, as seen in 2020-21.
Notably, the market trend remains positive, and there is little reason to be overly cautious. While risks lay ahead, the markets will signal if a more defensive positioning is needed. Over the next few weeks, we are looking for what sectors or markets will begin to define themselves as the leaders for this year. Will it be the “Magnificent 7” again, or will last year’s laggards, like Healthcare, take center stage?
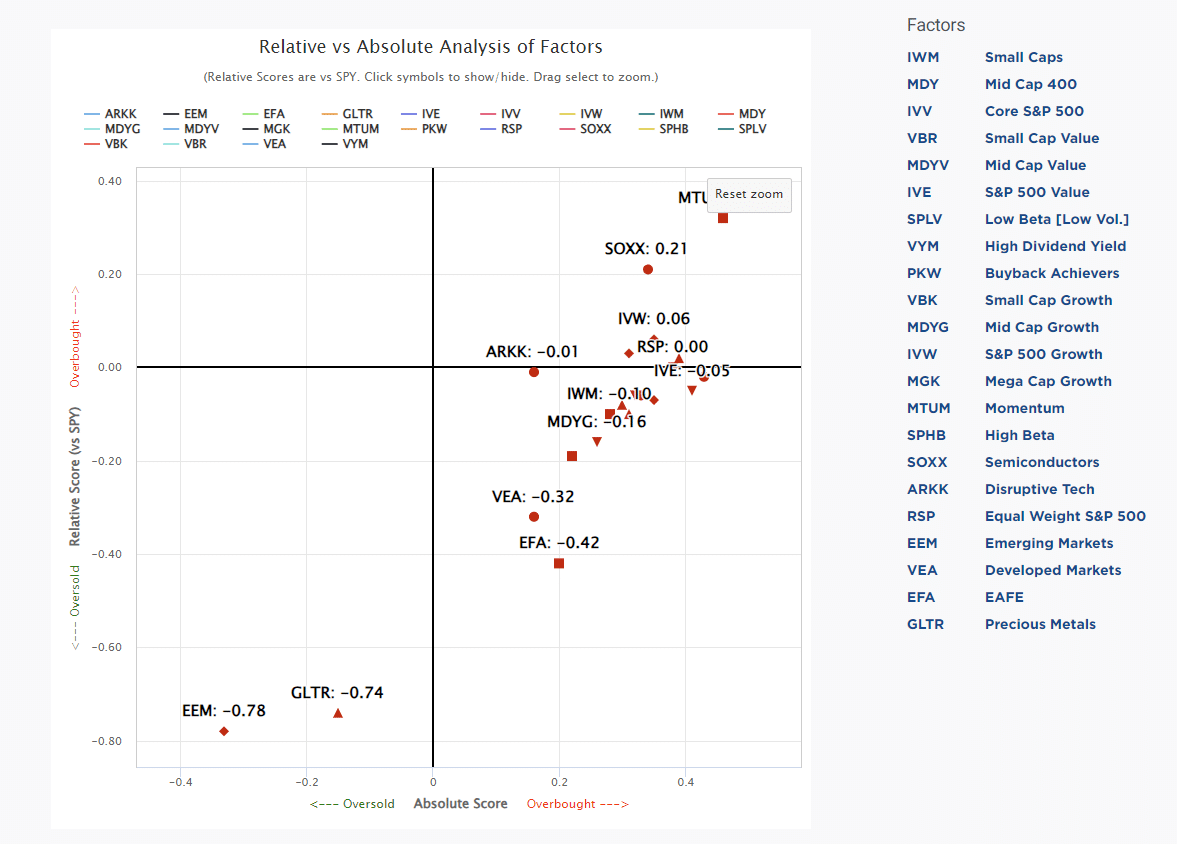
We are watching the rotation of various factors, courtesy of SimpleVisor.com, to see which will emerge as the next leaders. As is often the case, it most likely won’t be what many expect.
Bonds Also Looking Better
After a stellar run into year-end, we warned that we could see a pullback in Treasury prices due to more extreme overbought conditions. With the onset of the MACD “sell signal,” the Treasury bond market is becoming more appealing for adding exposure. The more severe overbought condition has been worked off to a degree, and we are about halfway through the MACD “sell signal.” As represented by TLT below, Treasury bonds are wrestling with the 200-DMA, but the 50-DMA remains in an uptrend.
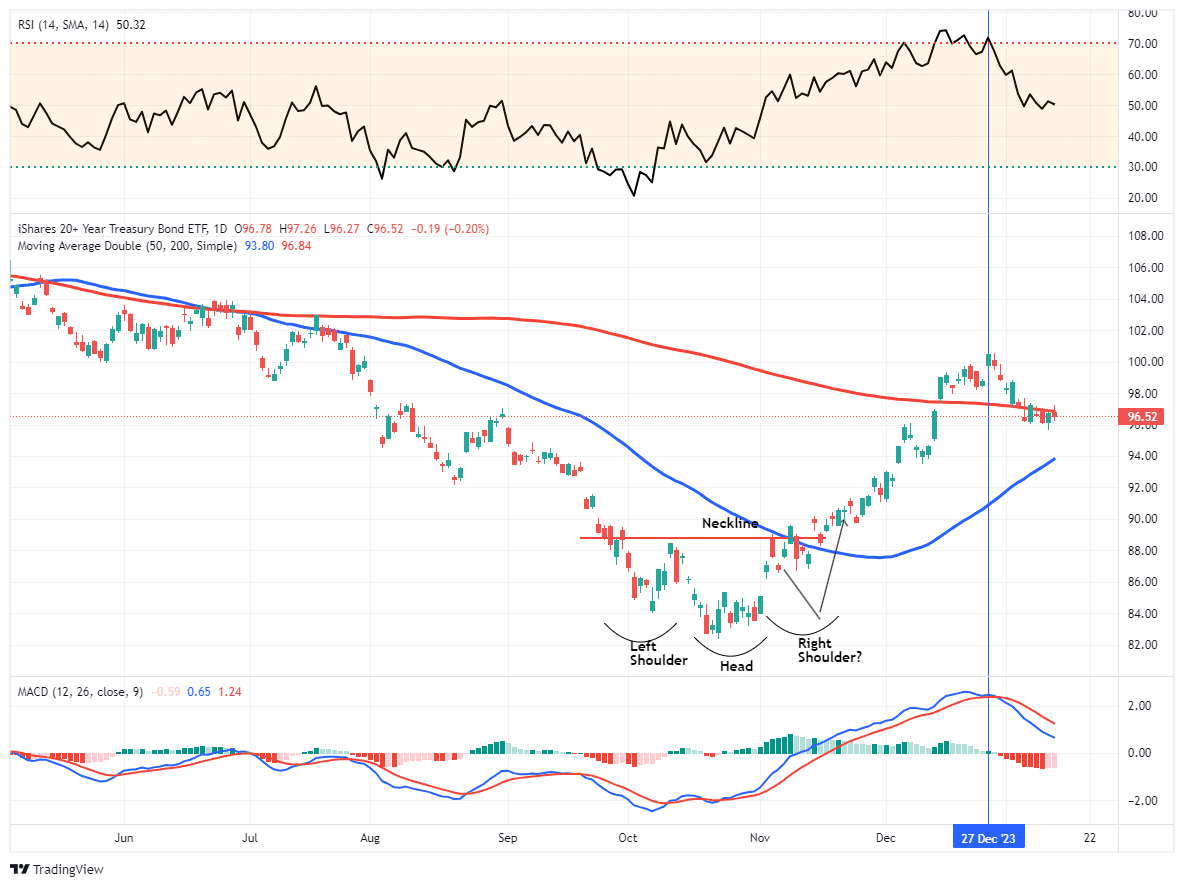
Notably, the setup for bonds remains bullish as inflation cools and economic growth slows. More importantly, the Federal Reserve suggests they will cut rates this year, putting further downside pressure on yields. The surge in deficit spending and a declining economic composite (GDP, Wages & Inflation) suggest lower yields in the future. Such is particularly true considering that most economic growth has been financed by cheap debt.
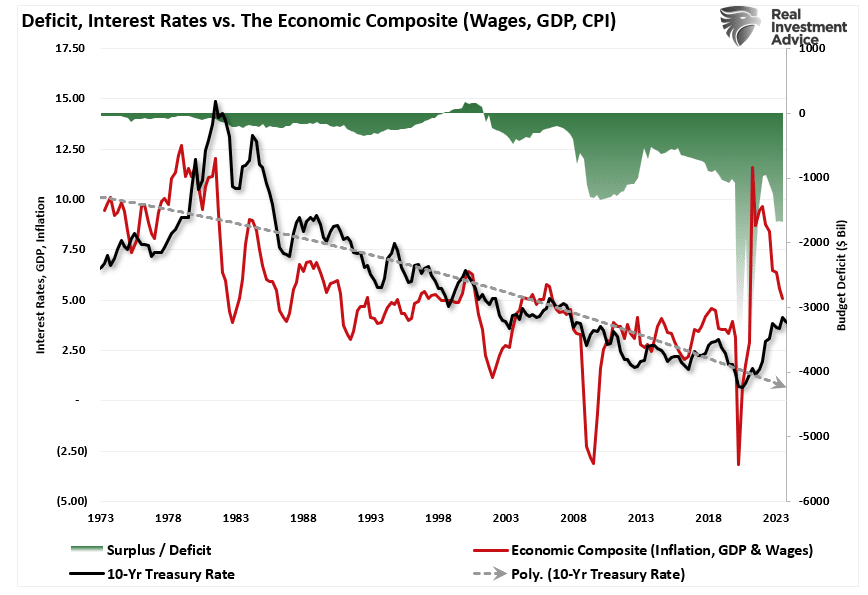
Unsurprisingly, the correlation between interest rates, GDP, and inflation is a significant 84%.

As such, our thesis on owning bonds in 2024 remains. As we stated in “Bonds or Stocks,”
“As monetary liquidity reverses and the lag effect of higher interest rates collides with economic realities, the risk of a recession indeed remains prevalent. But, even if the economy does avoid a recession and only slows down, with stocks overvalued and Government bonds deeply undervalued, there is an opportunity for those who can look ahead rather than behind.
The hope is that the Fed will again start dropping interest rates. However, as we have noted previously, the only reason for the Fed to cut rates would be to offset the risk of an economic recession or a financially related event. Should such occur, the “risk off” rotation would cause a drop in rates toward the pandemic-era lows. Such a decline would imply an increase in bond prices of approximately 50%.”
In other words, it is possible that given the economic backdrop as we move further into the year, bonds could wind up outperforming the S&P 500 index.
How We Are Trading It
While the sell-off started the year on a soft footing, we have no idea how things will turn out this year. As we noted in “Analysts Are Optimistic,” there is a broad range of potential outcomes based on earnings and valuations. As we kick off the New Year, this is a great time to refocus our attention on what the market is doing rather than what we think it should. This is often where we make the most mistakes.
There are undoubtedly many reasons to be pessimistic, but as we discussed previously, we must focus on the range of possibilities and probabilities of macro outcomes. To wit:
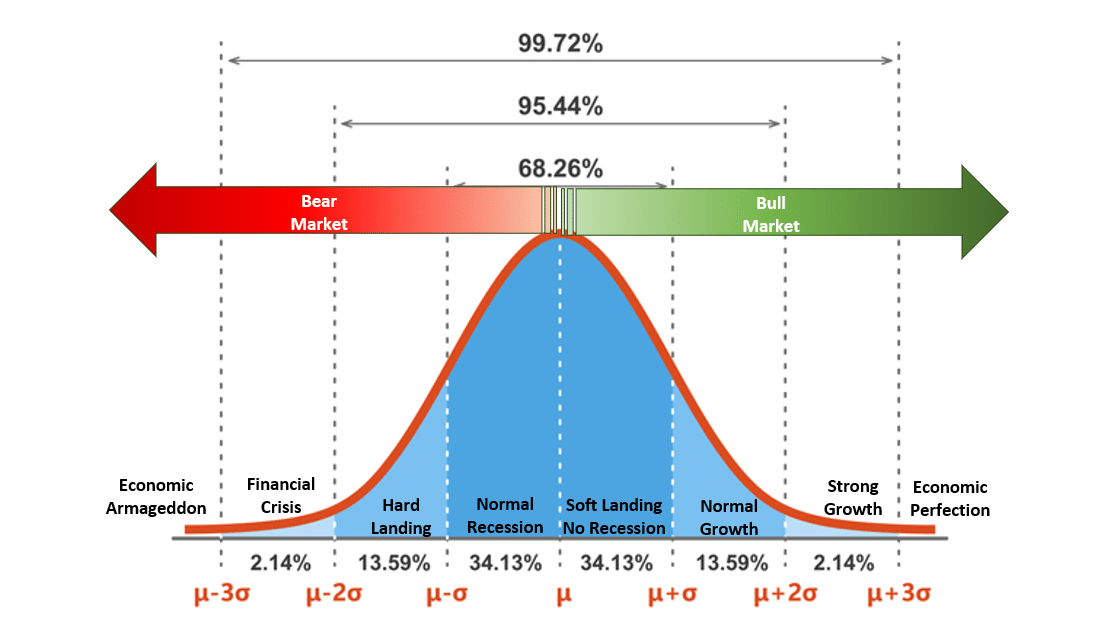
“The chart below is a normally distributed ‘bell curve’ of potential events and outcomes. In simple terms, 68.26% of the time, typical outcomes occur. Economically speaking, such would be a normal recession or the avoidance of a recession. 95.44% of the time, we are most likely dealing with a range of outcomes between a reasonably deep recession and average economic growth rates. However, there is a 2.14% chance that we could see another economic crisis like the 2008 Financial Crisis.
But what about ‘economic armageddon?’ An event where nothing matters but “gold, beanie weenies, and bunker.” is just a 0.14% possibility.”
While “fear sells,” we must assess the “probabilities” versus “possibilities” of various outcomes.
The reality is that we can’t control outcomes; the most we can do is influence the probability of specific outcomes, which is why the day-to-day management of risks and investing based on probabilities rather than possibilities is essential not only to capital preservation but to investment success over time.
As discussed this week, there is little reason to be overly pessimistic about the markets. Such is why we are currently slowly adding to equity exposures opportunistically. However, at the same time, we are controlling our risks and watching the markets for any evidence of a turn in outcomes.
If such occurs, we will begin raising cash immediately.
Have a great week.
Research Report
Subscribe To “Before The Bell” For Daily Trading Updates
We have set up a separate channel JUST for our short daily market updates. Please subscribe to THIS CHANNEL to receive daily notifications before the market opens.
Click Here And Then Click The SUBSCRIBE Button
Subscribe To Our YouTube Channel To Get Notified Of All Our Videos
Bull Bear Report Market Statistics & Screens

SimpleVisor Top & Bottom Performers By Sector

S&P 500 Weekly Tear Sheet

Relative Performance Analysis
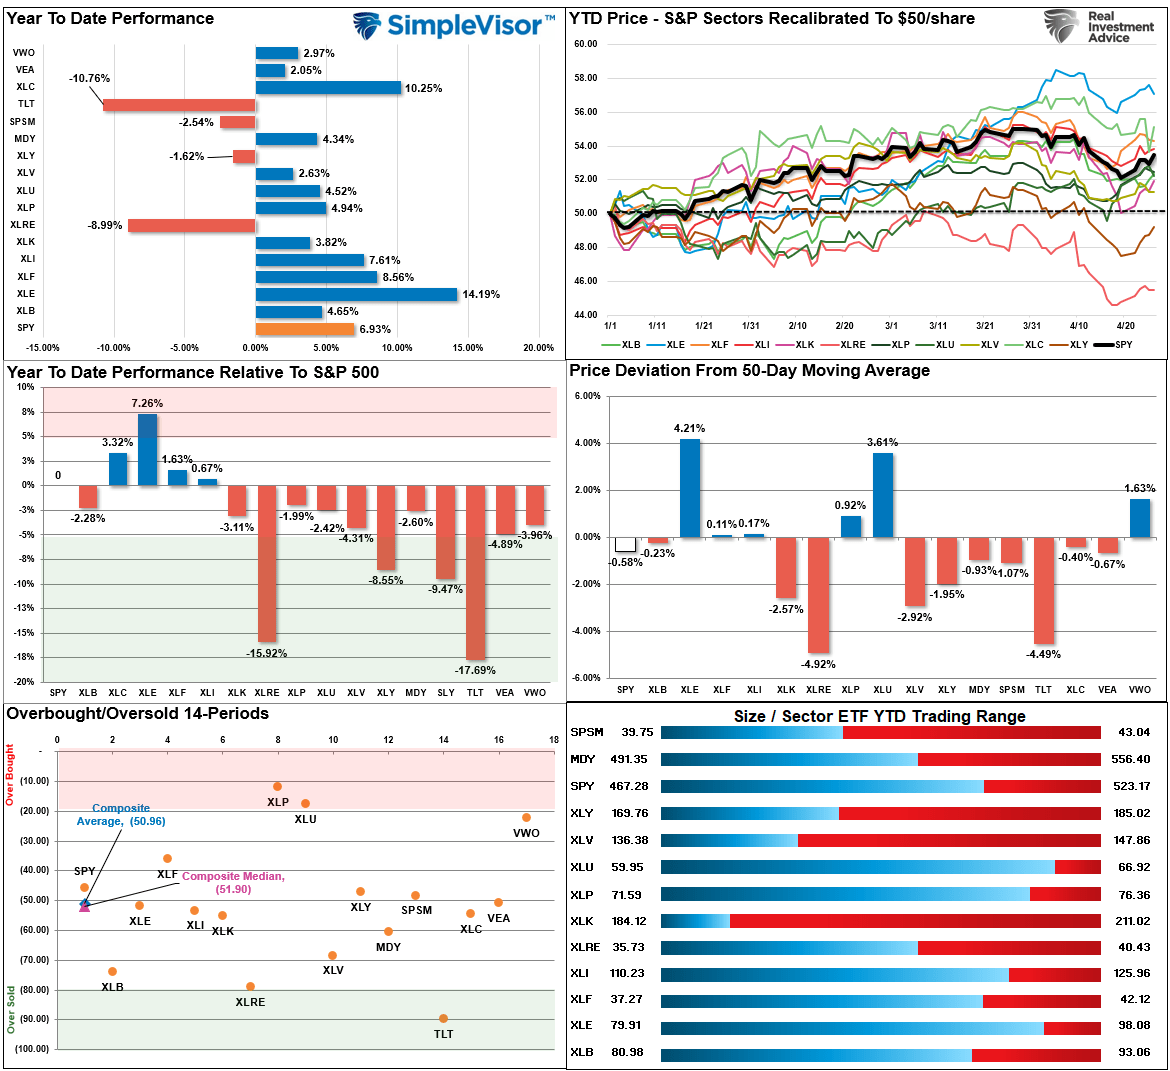
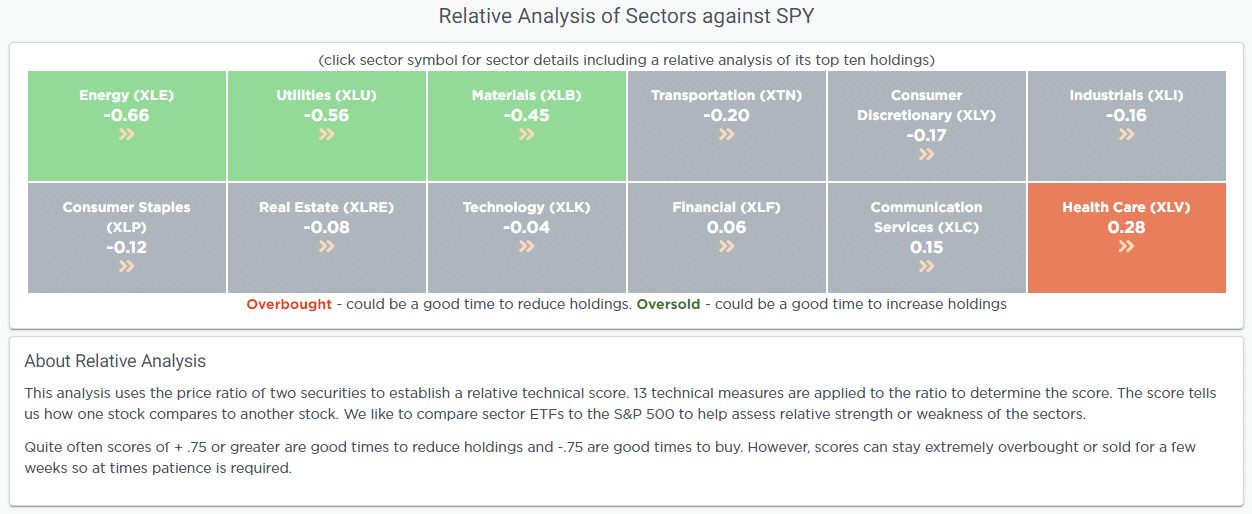
The market has continued to trade poorly since the beginning of the year. While the market is now positive for the year, it is only barely so, and there is a split between Technology, Staples, Healthcare, and Communications, which make up a significant chunk of the S&P index, which is now overbought, and everything else that isn’t. As such, the “capitalization-weighted index” is overbought, but the Composite index average and median are not. We would not be surprised to see a bit of rotation next week from leaders to laggards UNLESS we are setting up to repeat 2023, where just a handful of stocks will lead the way most of the year.
Technical Composite
The technical overbought/sold gauge comprises several price indicators (R.S.I., Williams %R, etc.), measured using “weekly” closing price data. Readings above “80” are considered overbought, and below “20” are oversold. The market peaks when those readings are 80 or above, suggesting prudent profit-taking and risk management. The best buying opportunities exist when those readings are 20 or below.
The current reading is 86.71 out of a possible 100.

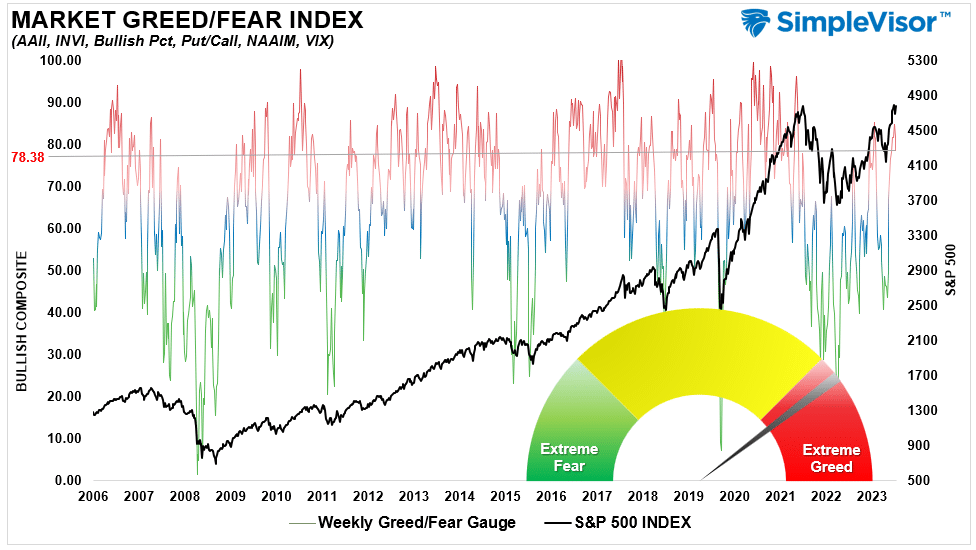
Portfolio Positioning “Fear / Greed” Gauge
The “Fear/Greed” gauge is how individual and professional investors are “positioning” themselves in the market based on their equity exposure. From a contrarian position, the higher the allocation to equities, the more likely the market is closer to a correction than not. The gauge uses weekly closing data.
NOTE: The Fear/Greed Index measures risk from 0 to 100. It is a rarity that it reaches levels above 90. The current reading is 78.38 out of a possible 100.
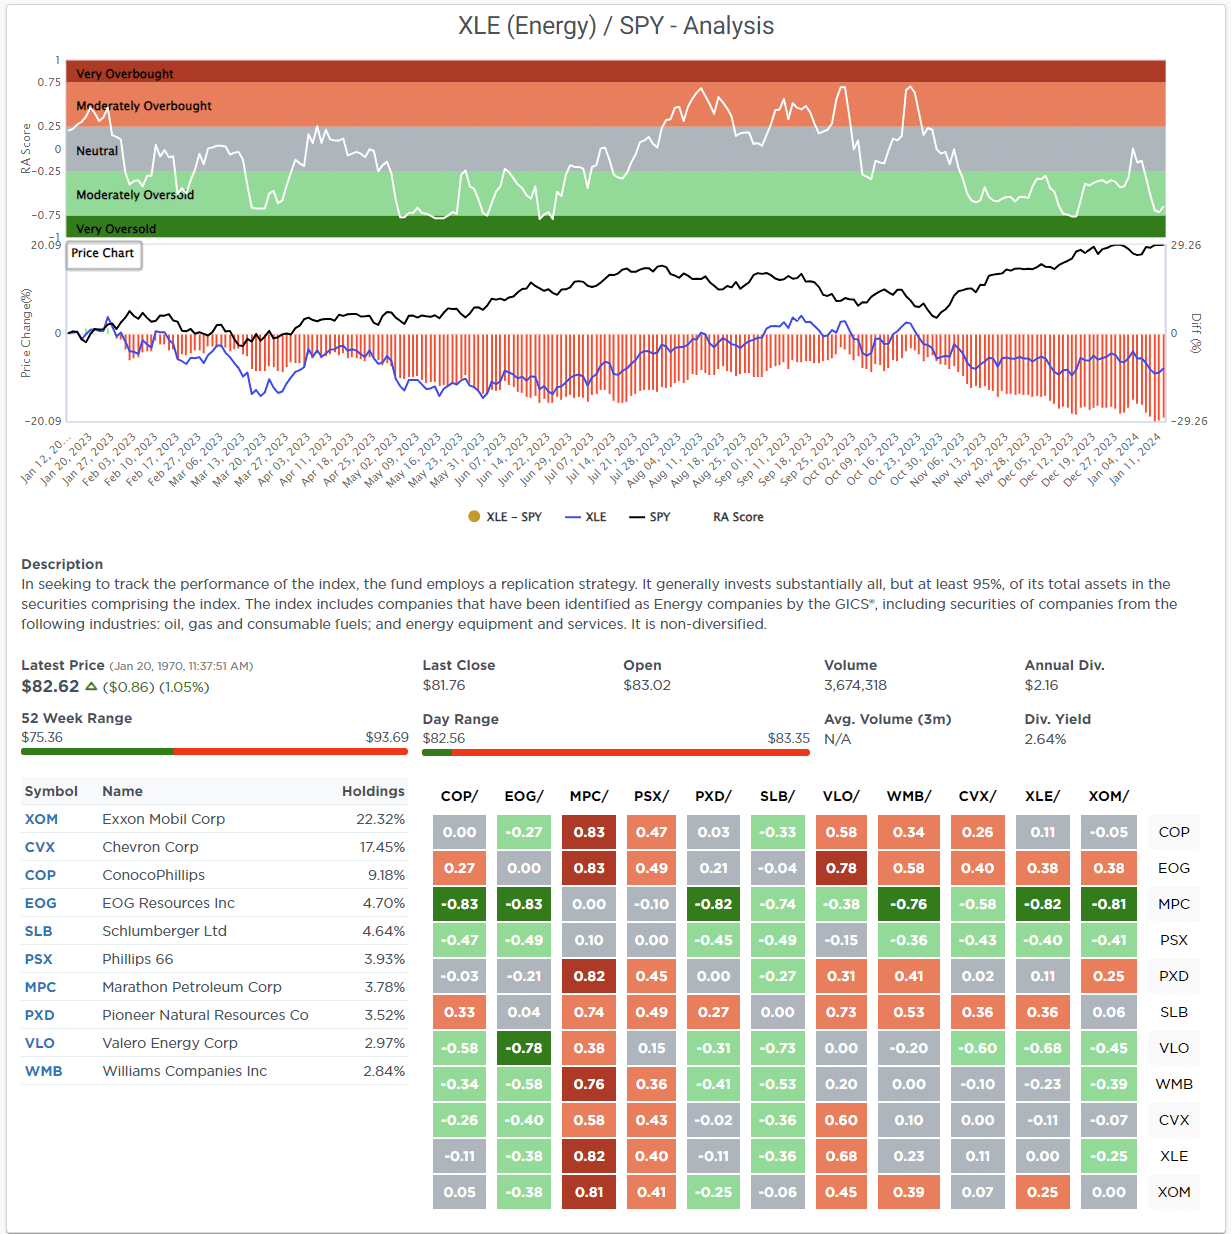
Relative Sector Analysis
Most Oversold Sector Analysis
Sector Model Analysis & Risk Ranges
How To Read This Table
- The table compares the relative performance of each sector and market to the S&P 500 index.
- “MA XVER” (Moving Average Crossover) is determined by the short-term weekly moving average crossing positively or negatively with the long-term weekly moving average.
- The risk range is a function of the month-end closing price and the “beta” of the sector or market. (Ranges reset on the 1st of each month)
- The table shows the price deviation above and below the weekly moving averages.
As noted last week:
“The start of the year has been sloppy. However, as we look forward to 2024, numerous sectors and markets are trading bearishly despite the market’s 24% advance last year. Furthermore, multiple sectors continue to remain deviated well above their longer-term moving averages. Over the next couple of weeks, we should begin to get clarity as to where money is flowing. Will it be another narrow advance year, or will this finally be a year where the laggards finally have their day?”
So far this year, as noted in the Relative Market Sector Analysis above, it remains a reasonably narrow advance, with only a handful of sectors leading the charge. Transportation, Small Caps, and Gold Miners, all economically sensitive sectors, have been lagging sharply since the beginning of the year. This contrasts last year’s leaders, who remain highly deviated above their short- and long-term weekly moving averages.

Weekly SimpleVisor Stock Screens
We provide three stock screens each week from SimpleVisor.
This week, we are searching for the Top 20:
- Relative Strength Stocks
- Momentum Stocks
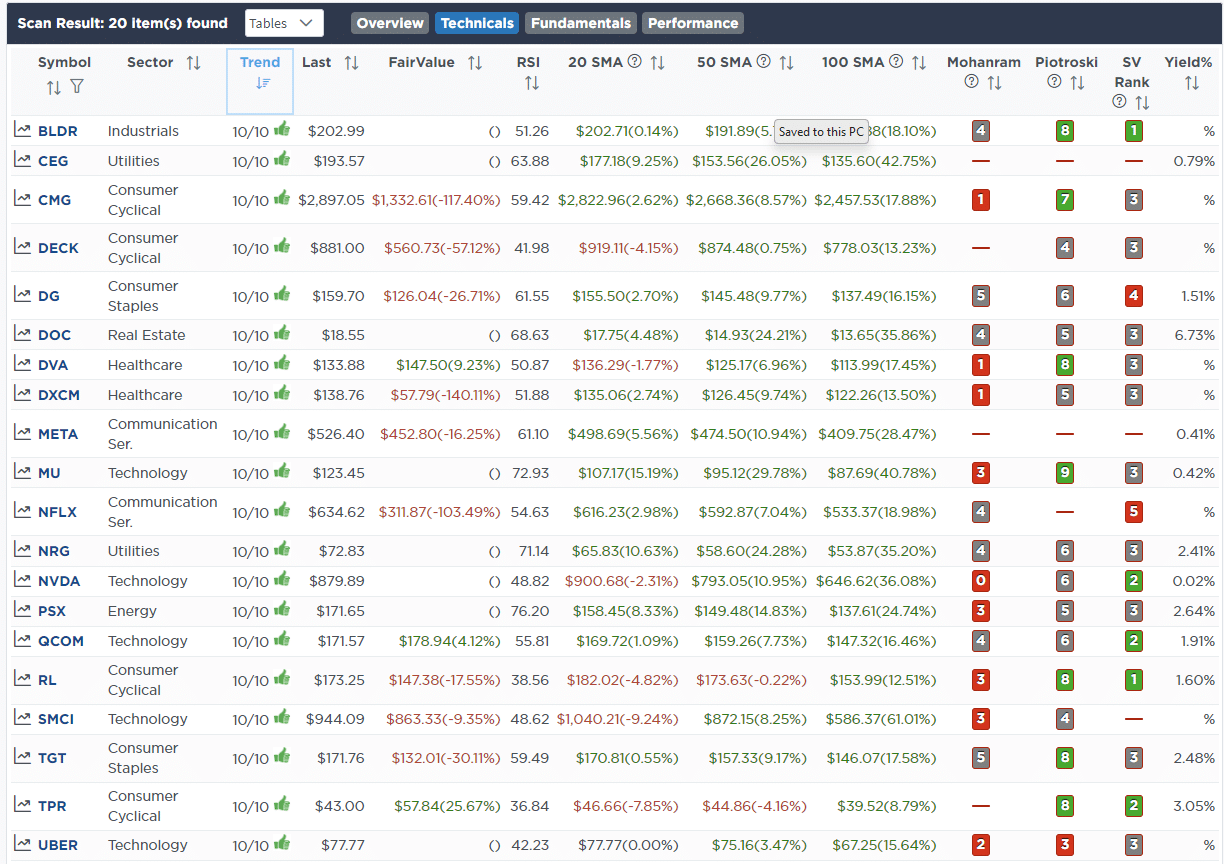
- Fundamental & Technical Strength
(Click Images To Enlarge)
R.S.I. Screen
Momentum Screen

Fundamental & Technical Strength

SimpleVisor Portfolio Changes
We post all of our portfolio changes as they occur at SimpleVisor:
January 12th
“This morning, United Healthcare (UNH) reported stronger-than-expected earnings and revenue. Despite the good news, the stock opened lower by 5%. The decline is a function of rising costs. Despite rising expenses, their profit guidance is unchanged. This morning’s sell-off allowed us to add to our position, as we have wanted to. We added 1% of UNH to the equity model.”
Equity Model
- Add 1% of the Portfolio to United Healthcare (UNH)

Lance Roberts, C.I.O.
Have a great week!

