
Inside This Week’s Bull Bear Report
- Market Rallies As Fed Is Done Hiking Rates
- How We Are Trading It
- Research Report – The Most Overlooked Economic Indicator
- Youtube – Before The Bell
- Market Statistics
- Stock Screens
- Portfolio Trades This Week
Market Review And Update
Last week, we discussed the decline in interest rates as recession fears resurfaced. As we noted then:
“The market pullback on Thursday was well-needed after the longest ‘win streak‘ for stocks since 2021. After regaining the 200-DMA, the market surged through the 20- and 50-DMA. As we have discussed, pullbacks to support will be buying opportunities. Such was the case on Friday, as the test of the 50-DMA brought buyers into the market and rallied stocks sharply.”
Market rallies are common heading into year-end, and this rally is no different. However, we are now reaching more extreme levels of typical reflexive rallies, and a consolidation or correction to support should be expected. As we noted previously:
“We pushed through the 50% retracement level, which is also the 50-DMA. As noted above, that clears the way for a rally higher with a more bullish tone. That now sets the next targets at the 61.8% and 78.6% levels, then this year‘s highs.”
We are currently wrestling with the 78.6% retracement level, which is also resistance from the September highs. Given the more overbought conditions, it is not surprising the market has had trouble advancing over the last several days. Given we are entering a holiday-shortened week, trading volume will be light, and volatility will likely pick up. If the market does correct soon, supports will be the previous 61.8% and 50% retracement levels, respectively.
Continue following the basic investment rules and take advantage of tax loss selling as needed.
- Tighten up stop-loss levels to current support levels for each position.
- Hedge portfolios against more significant market declines.
- Take profits in positions that have been big winners.
- Sell laggards and losers.
- Raise cash and rebalance portfolios to target weightings.
From a portfolio management perspective, we have to trade the market we have rather than the one we think should be. This can make the challenge of battling emotions difficult from week to week. However, the rally we expected has arrived, providing a better risk/reward opportunity to rebalance equity exposure.
Need Help With Your Investing Strategy?
Are you looking for complete financial, insurance, and estate planning? Need a risk-managed portfolio management strategy to grow and protect your savings? Whatever your needs are, we are here to help.

Inflation Cools In The Latest Report
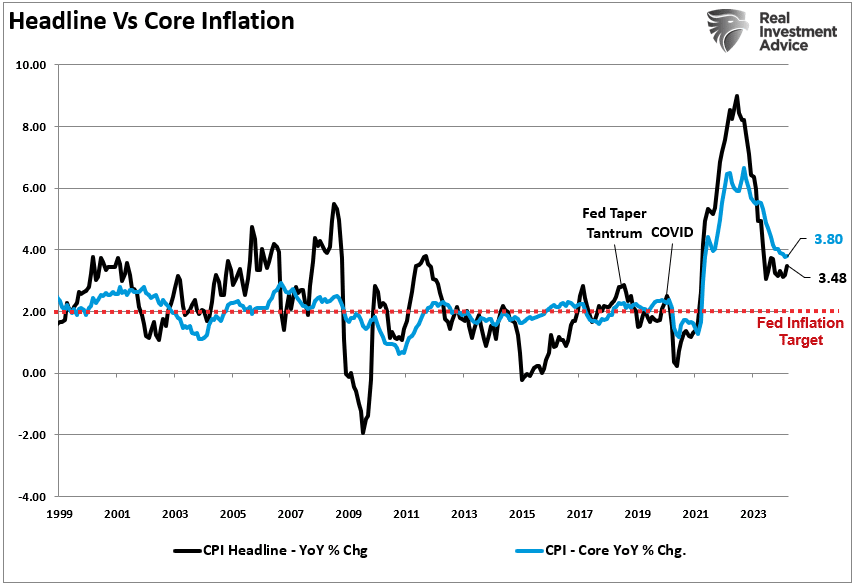
On Tuesday, the market exploded higher as the latest Consumer Price Index (CPI) report showed considerable softening in most components. The table below breaks out the inflation report into its subcomponents and shows the trend over the last 5-months.

Notably, the largest weighted components reflected the decline in the overall inflation report, pushing the headline and core inflation indices lower. As we stated numerous times, such should be the expectation as year-over-year comparisons ease and the excess money supply fades from the system. However, the more critical “core” reading remains elevated and not far off its previous peak.
More importantly, the “sticky price” index, which excludes food, energy, and shelter, fell below 3% for the first time since 2021. This is one of the reasons why the market rallied so hard on Tuesday, as expectations increased that the Fed is done hiking rates.
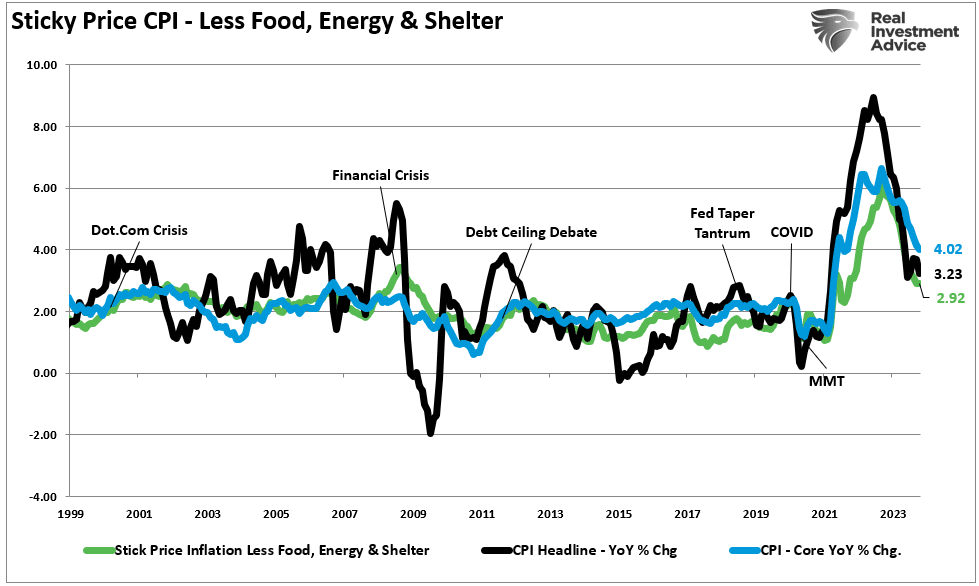
As we noted previously, for most, housing and healthcare costs get contractually fixed for a set period. Therefore, if we look at the inflation households deal with monthly, that rate has dropped to 2.6% annually.
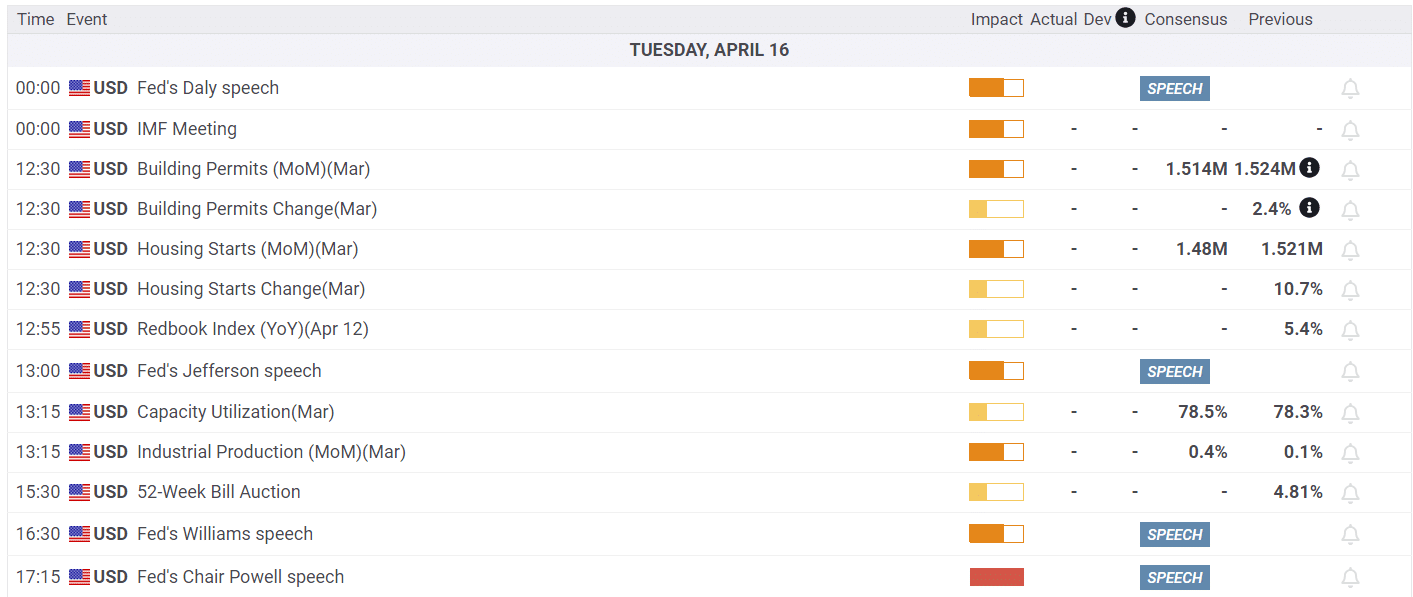
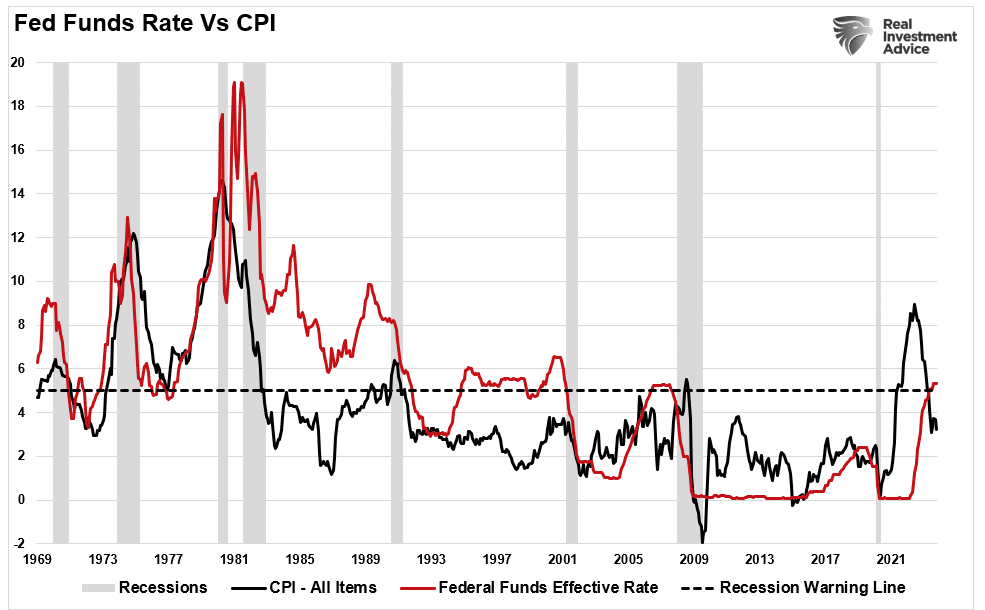
With the weak employment and inflation reports, there is clear evidence that the broader economy is slowing. Such is why, as we will discuss, the Federal Reserve has reached maximum restrictive policies. The Fed funds rate tends to follow inflationary trends with a lag. Therefore, it is unsurprising the markets are betting the Fed is done hiking rates for this cycle.
As Nick Timiraos, the WSJ reporter for the Federal Reserve, tweeted following the report this morning:
“The October payroll and inflation report strongly suggest the Fed‘s last rate rise was in July. The big debate at the next Fed meeting is shaping up to be over whether and how to modify the postmeeting statement to reflect the obvious: the Central Bank is on hold.”
The market agrees with that assessment as the “terminal rate” pricing aligns with the current Fed funds rate.
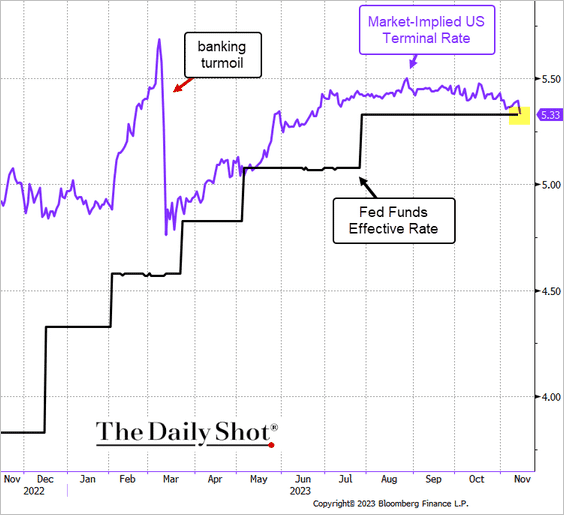
That shift in sentiment from “higher for longer” to “how soon will the Fed cut rates” sent the market scorching higher this week.
Market Rallies From Deep Oversold Conditions
The negative sentiment and positioning in the market had reached rather extreme levels in October. As we noted in “Possibilities versus Probabilities:”
“The drubbing the market took this week was undoubtedly disappointing. However, the market is approaching deep oversold conditions with some minor support heading into next week. Since March, a reflexive rally has ensued when the market reached such oversold levels.
Given the very negative levels of investor sentiment and oversold technical conditions, the possibility of a counter-trend rally is decent. Our weekly technical composite indicator has not been this oversold since October 2022 and is near levels that have historically always marked correction and bear market bottoms.” – October 28th
“Investor sentiment is also negative, which, when it reverses, provides the fuel for a rally.”
Ironically, the market began rallying the following week as “bad economic data” fueled the bullish mantra. Of course, in reality, bad economic data is just that…bad. If economic weakness prevails, earnings will need to be revised lower, and valuations must adjust to accommodate a lower “E” in the “P/E” ratio.
The current spread between the Producer Price Index (PPI) and CPI is negative, suggesting manufacturers have difficulty passing on higher input costs. Such supports the notion that earnings will likely have trouble growing until that situation reverses.

Nonetheless, the market has rallied strongly since the beginning of November and reached our target of 4500. Our technical indicators have entirely reversed the previous oversold readings, suggesting that the upside is likely limited in the near term.
With the bulls becoming ebullient over the specter of rate cuts coming, we must remind you that when the Fed cuts rates, it has historically not been a great outcome from owning stocks. As shown, markets tend to correct during rate-cutting cycles, and market rallies occur once the Fed stops cutting rates. If recent history is any guide, the Fed will stop cutting rates when they return to the zero bound.
The Fed Still Has An Inflation Problem
Could this time be different? Absolutely. The Federal Reserve has been training investors over the last 13 years that when they cut rates, the monetary accommodation sends stocks higher.
Will the bulls front-run the Fed when they begin cutting rates? Maybe. Or, given that the Fed will be cutting rates and reinstating QE only if there is a recession, then market prices will likely decline to accommodate lower earnings.
It is all speculation, but we will likely have an opportunity to buy stocks cheaper next year.
Of course, market rallies are also a problem for the Federal Reserve in combatting inflationary pressures. As noted last week:
“The problem with market rallies and yields dropping is that it undoes the financial constriction they provided on the economy. Higher asset prices boost consumer confidence, and lower yields provide buying power. Both actions create the possibility of a resurgence in inflation, putting the Fed back into “hawkish” mode to ensure inflation falls.“
Mr. Powell addressed those concerns last week when he responded to the recent loosening of financial conditions.
“[The FOMC] is committed to achieving a stance of monetary policy that is sufficiently restrictive to bring inflation down to 2 percent over time; we are not confident that we have achieved such a stance. We know that ongoing progress toward our 2 percent goal is not assured: Inflation has given us a few head fakes. If it becomes appropriate to tighten policy further, we will not hesitate to do so.” – Jerome Powell
As noted, the recent drop in bond rates and surge in the stock market works against the Fed’s goal of tightening monetary conditions. The Fed’s goal remains “tighter” conditions to reduce consumer spending and increase unemployment to reduce economic demand. The demand reduction is how inflation, which is solely a function of supply and demand, gets reduced. A couple of measures of financial conditions suggest the market is working against the Fed.
2-Measures Of Financial Conditions
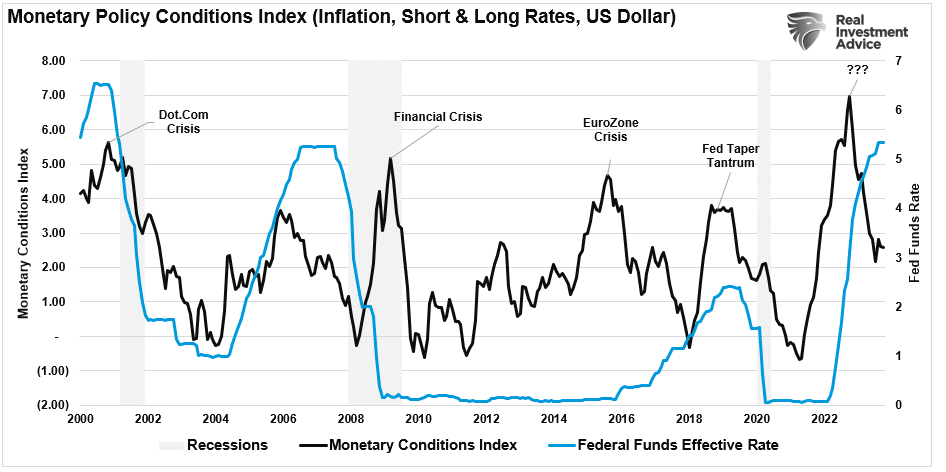
The first is our monetary policy conditions index.
The “monetary policy conditions index” measures the 2-year Treasury rate, which impacts short-term loans; the 10-year rate, which affects longer-term loans; inflation, which impacts the consumer; and the dollar, which impacts foreign consumption. Historically, when the index has reached higher levels, it has preceded economic downturns, recessions, and bear markets. Unsurprisingly, when monetary policy conditions have become tight, and the event occurs, the Fed generally cuts rates or keeps them at zero, providing liquidity to the markets.
Secondly, as we noted in “Bond Bear Market,” there are implications for the Federal Reserve as bond rates are repriced lower, particularly when it remains focused on inflation. Lower yields and potentially higher asset prices reverse the financial conditions the Fed hoped to tighten. As shown below, our economic conditions index has loosened over the past week.
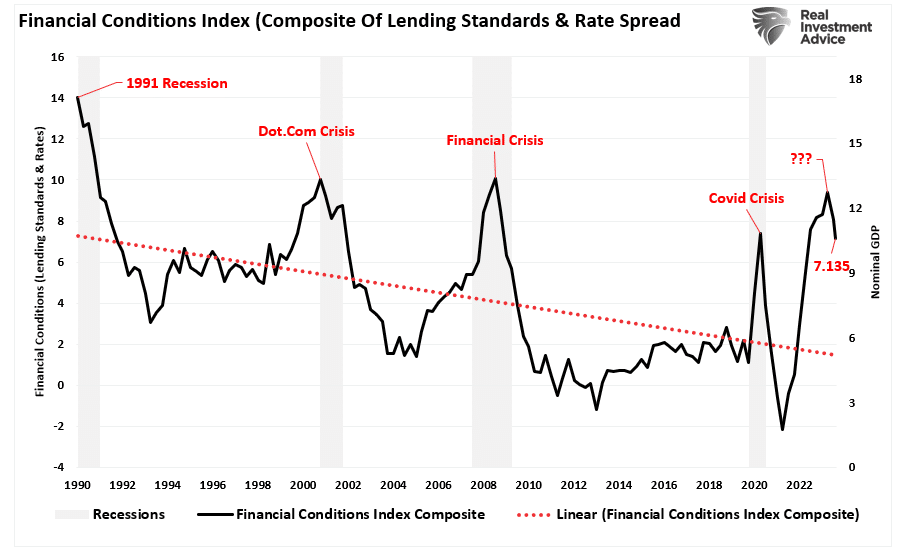
Loosening financial conditions is problematic for the Fed, which needs tighter conditions to bring down inflation towards their target rate.
From the market‘s perspective, it has been rallying since October, hoping the Fed would pause its rate-hiking campaign and start cutting rates next year. However, the bullish case hinges upon:
- The economy avoiding a recession.
- Employment remains strong, and wages will support consumption.
- Corporate profit margins will remain elevated, thereby supporting higher market valuations.
- The Fed will “pause” the tightening campaign as inflation falls.
So far, those supports have allowed investors to chase higher stock prices despite higher Fed rates. However, there is also a problem with those supports.
If the economy avoids a recession and employment remains strong, the Fed has no reason to cut rates. Yes, the Fed may stop hiking rates, but if the economy is functioning normally and inflation is falling, there is no reason for rate cuts.
However, sustained economic growth and low unemployment will keep inflation elevated, which leaves the Fed little choice but to become more aggressive in tightening monetary accommodation further.
I don‘t know who eventually wins this tug-of-war, but loosening financial conditions suggests the Fed‘s fight isn‘t over.
How We Are Trading It
As discussed last week, we completed our tax-loss selling in portfolios as part of the risk rebalancing heading into year-end. With the market overbought short-term, continue aligning your portfolio with your risk tolerance.

I know many got caught flat-footed by the magnitude of the recent rally. Therefore, if you are underweight equities and feel pressured to add positions, do so carefully. As an individual investor, there is no need to chase markets. Use pullbacks opportunistically to add exposure as needed to match your risk profile. The following rules are helpful in adding exposure in a tenuous environment.
- Move slowly. There is no rush to make dramatic changes. Doing anything in a moment of “panic” tends to be the wrong thing.
- If you are underweight equities, DO NOT try and fully adjust your portfolio to your target allocation in one move. Again, after significant market moves, individuals feel like they “must” do something.
- Begin by selling laggards and losers.
- Add to sectors or positions performing with or outperforming the broader market if you need risk exposure.
- Move “stop-loss” levels up to recent lows for each position.
- Be prepared to sell into the rally and reduce overall portfolio risk. You will sell many positions at a loss simply because you overpaid for them. Selling at a loss DOES NOT make you a loser. It just means you made a mistake.
- If none of this makes sense, please consider hiring someone to manage your portfolio. It will be worth the additional expense over the long term.
Everyone approaches money management differently. Our process isn‘t perfect, but it works more often than not. The important message is that the bearish cycle will end, and the next bull cycle will begin.
Have a great week.
Research Report
Subscribe To “Thoughtful Money” For The Weekly Market Recaps
The weekly market recaps with Adam Taggart have returned on his NEW channel “Thoughtful Money.”
Be sure to click the link below to subscribe to the channel for notifications when the market recap drops each week.
Click Here And Then Click The SUBSCRIBE Button
Subscribe To Our YouTube Channel To Get Notified Of All Our Videos
Bull Bear Report Market Statistics & Screens

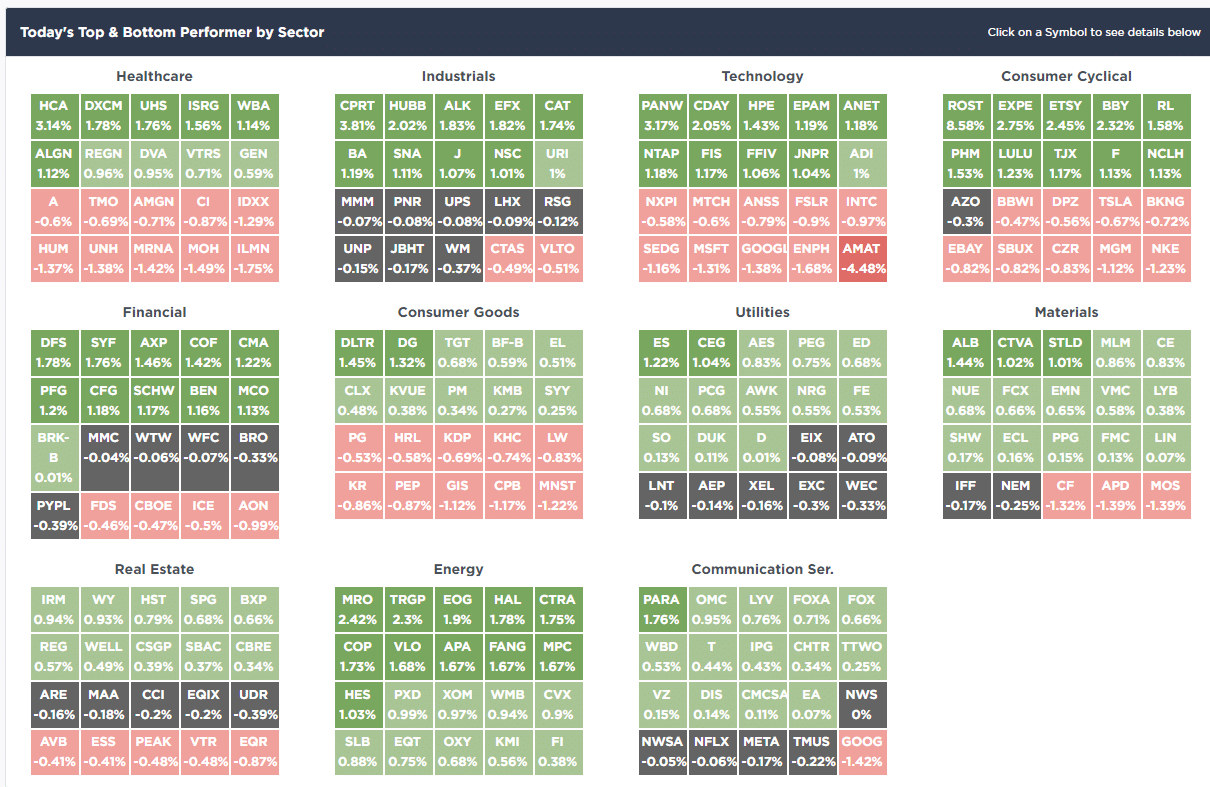
SimpleVisor Top & Bottom Performers By Sector
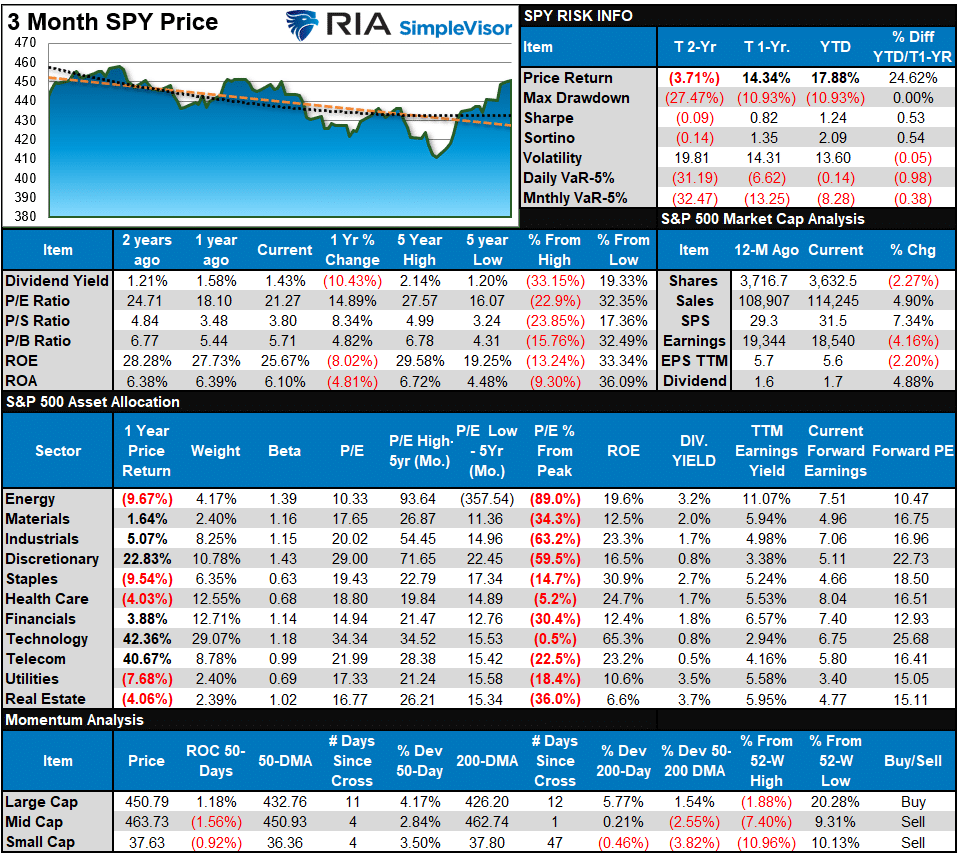
S&P 500 Weekly Tear Sheet
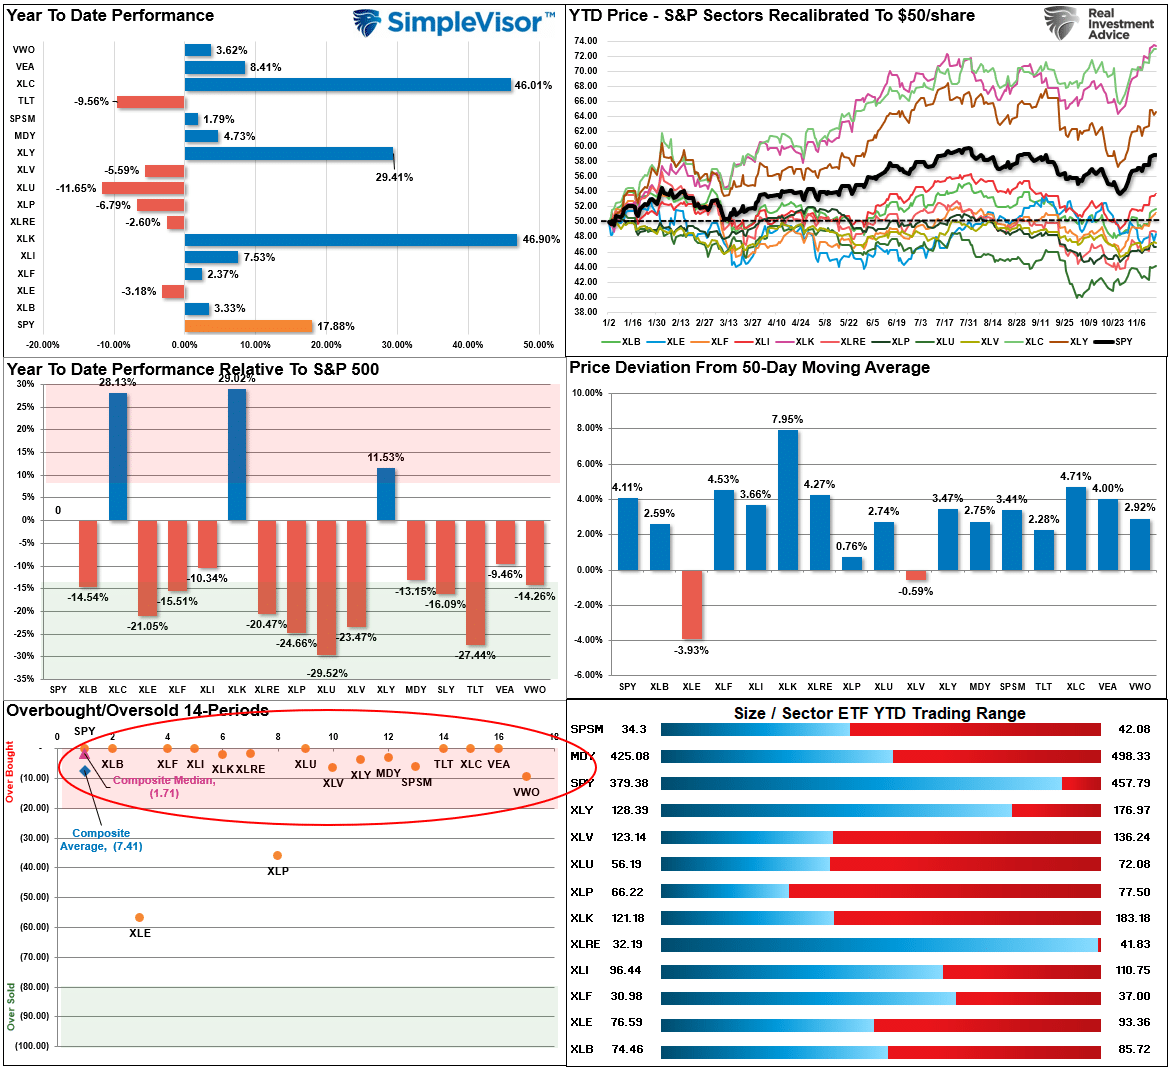
Relative Performance Analysis
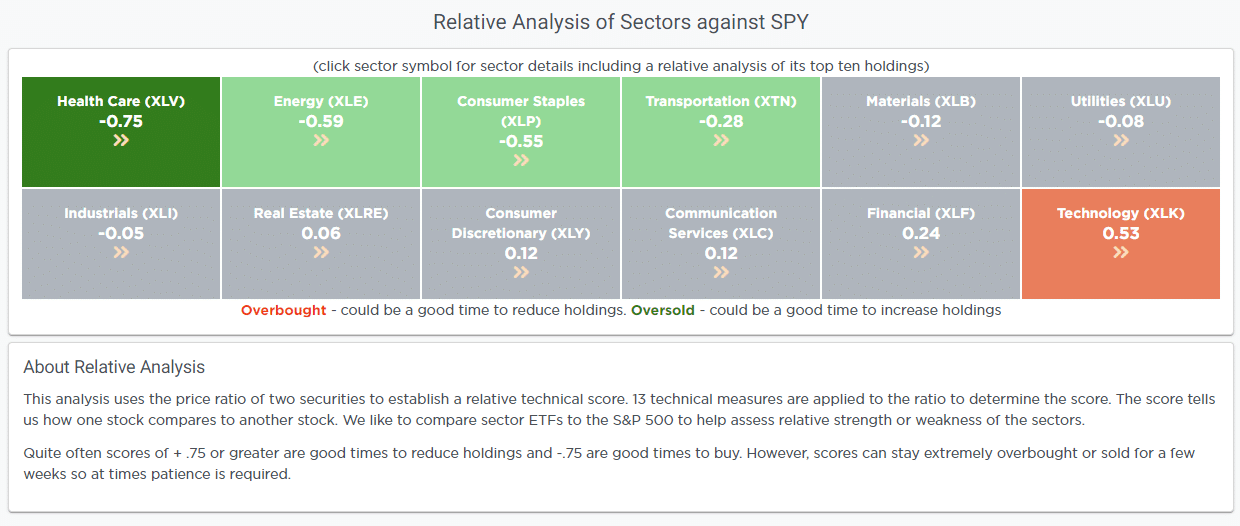
As shown, except for Energy and Financials, everything else is short-term overbought. Expect a short-term correction. Such will provide a better entry point to add exposure. While the market can remain overbought longer than expected, such extreme conditions rarely last long. Be patient. You will have a better opportunity to add exposure before the year-end rally concludes.
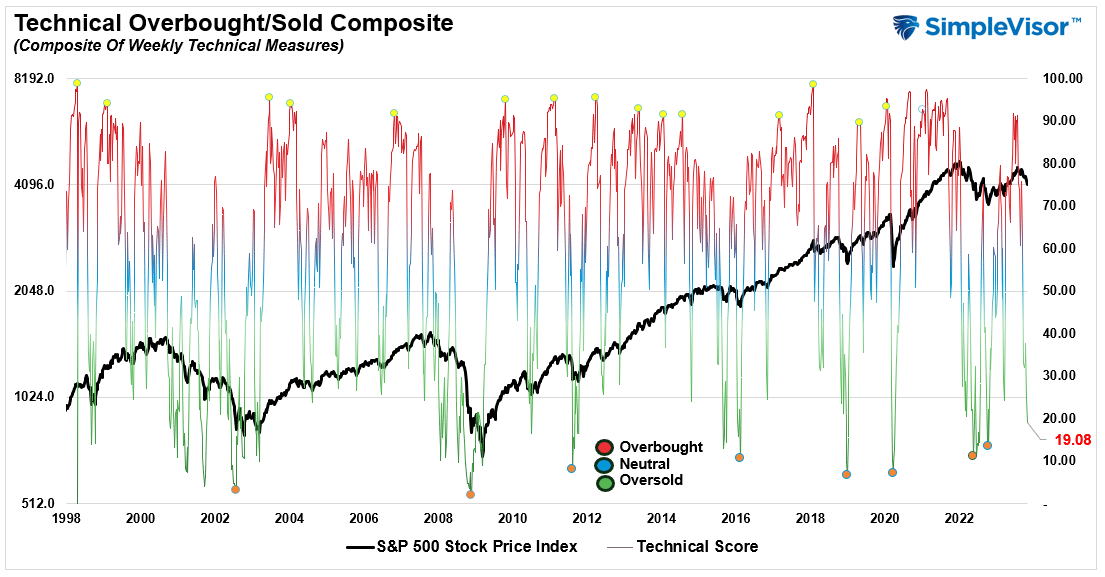
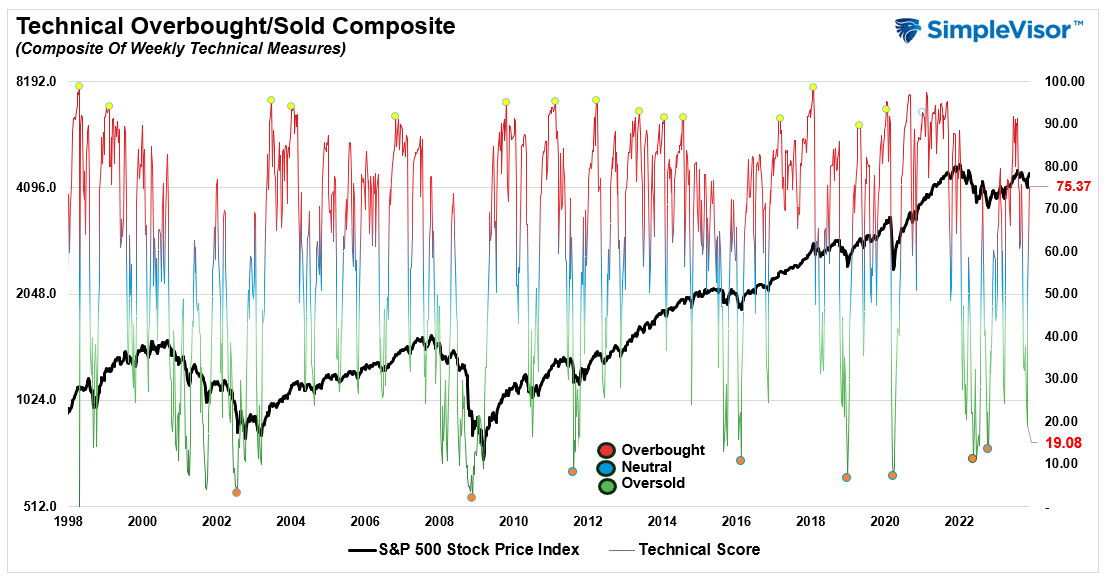
Technical Composite
The technical overbought/sold gauge comprises several price indicators (R.S.I., Williams %R, etc.), measured using “weekly” closing price data. Readings above “80” are considered overbought, and below “20” are oversold. The market peaks when those readings are 80 or above, suggesting prudent profit-taking and risk management. The best buying opportunities exist when those readings are 20 or below.
The current reading is 75.37 out of a possible 100.
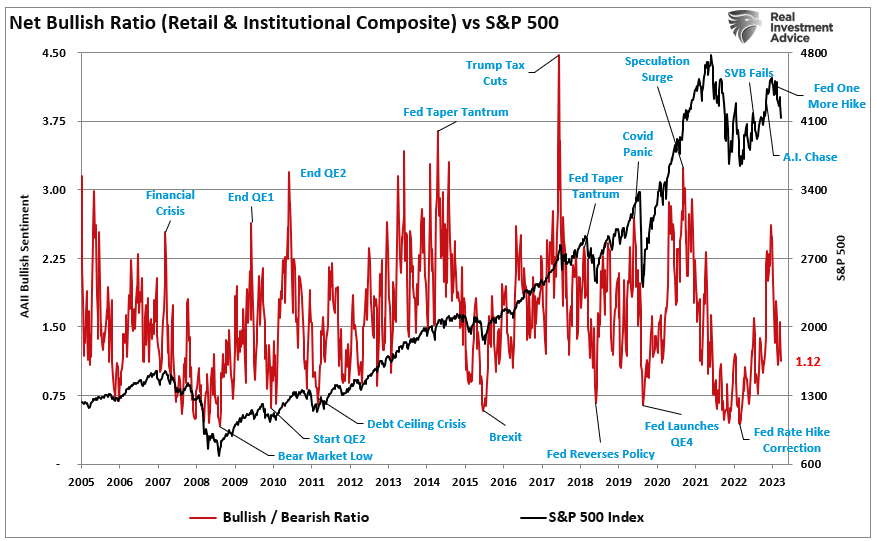
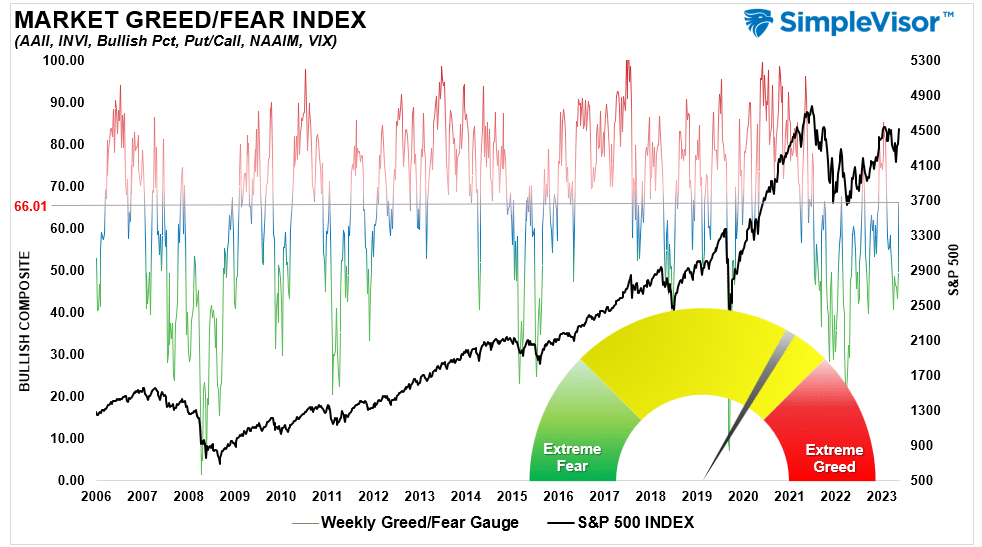
Portfolio Positioning “Fear / Greed” Gauge
The “Fear/Greed” gauge is how individual and professional investors are “positioning” themselves in the market based on their equity exposure. From a contrarian position, the higher the allocation to equities, the more likely the market is closer to a correction than not. The gauge uses weekly closing data.
NOTE: The Fear/Greed Index measures risk from 0 to 100. It is a rarity that it reaches levels above 90. The current reading is 66.01 out of a possible 100.
Relative Sector Analysis
Most Oversold Sector Analysis

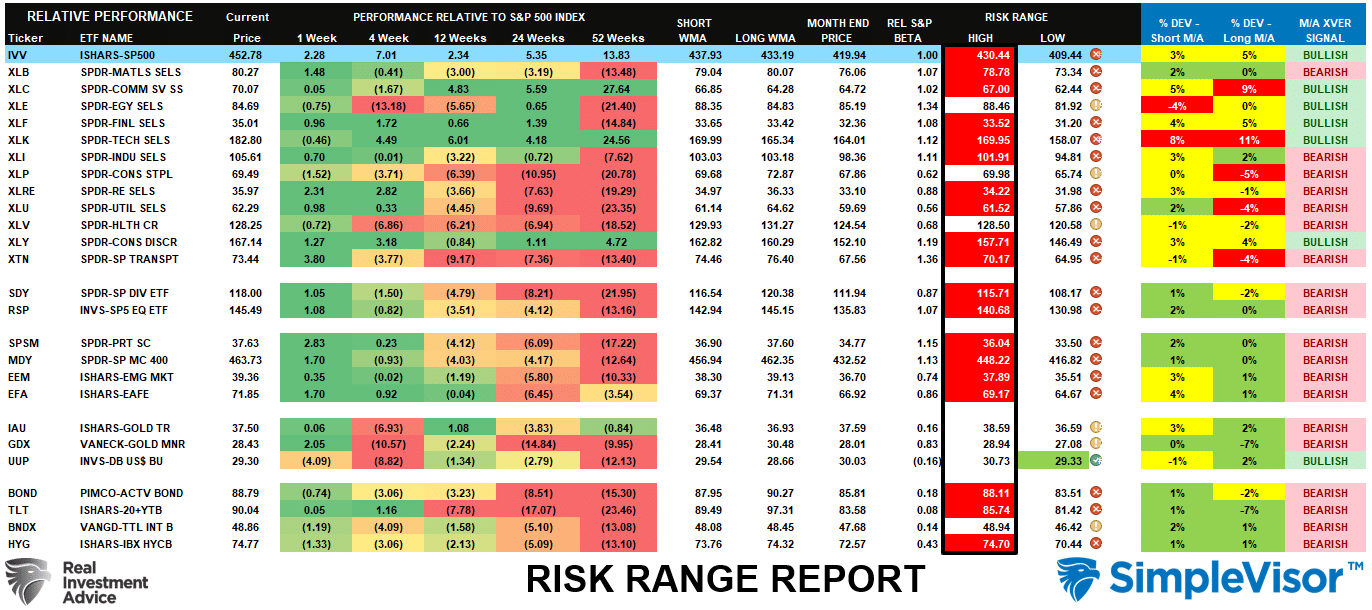
Sector Model Analysis & Risk Ranges
How To Read This Table
- The table compares the relative performance of each sector and market to the S&P 500 index.
- “MA XVER” (Moving Average Crossover) is determined by the short-term weekly moving average crossing positively or negatively with the long-term weekly moving average.
- The risk range is a function of the month-end closing price and the “beta” of the sector or market. (Ranges reset on the 1st of each month)
- The table shows the price deviation above and below the weekly moving averages.
As noted above in the Market Sector Relative Performance table, almost every major sector and market is currently overbought and outside of normal monthly trading ranges. Such extremes are unsustainable, and a reversal will occur. Take profits as needed and sell laggards for tax loss harvesting as we approach year-end. Note that the Communications, Technology, Industrials, Utilities, and Transportation sectors are trading well above their long-term moving averages. These will likely be the areas that will pull back to provide a better entry point.
Weekly SimpleVisor Stock Screens
We provide three stock screens each week from SimpleVisor.
This week, we are searching for the Top 20:
- Relative Strength Stocks
- Momentum Stocks
- Fundamental & Technical Strength
(Click Images To Enlarge)
R.S.I. Screen

Momentum Screen
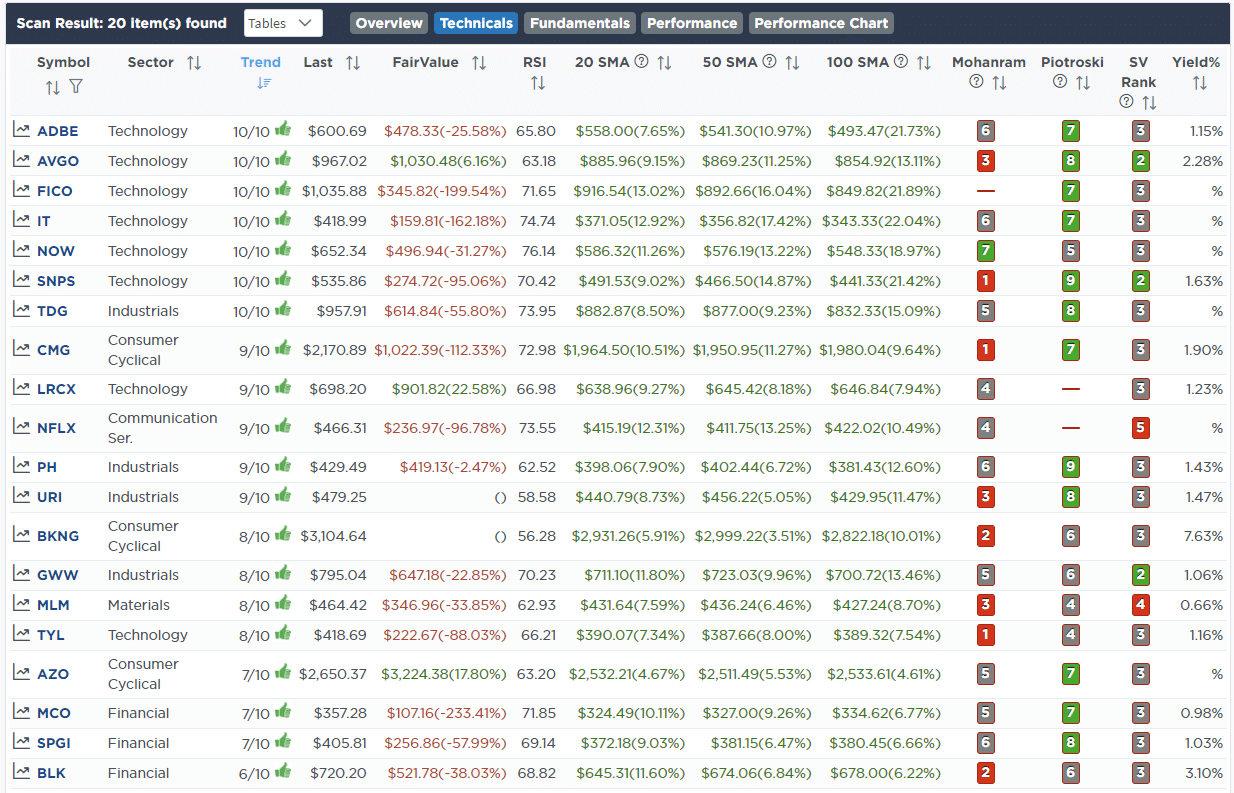
Fundamental & Technical Strength

SimpleVisor Portfolio Changes
We post all of our portfolio changes as they occur at SimpleVisor:
Nov 13th
We are continuing our portfolio tax loss selling this morning with the remainder of Public Storage (PSA). Longer-term we like this company and will look to buy it back at some point after our 30-day tax loss selling period. This stock, in particular, should perform well in a lower interest rate environment next year, so we are looking for time to work on our side to provide a better entry point in 2024.
Equity Model
- Sell 100% of Public Storage (PSA)
Nov 14th
This morning, we added 1.5% BRK-B to the equity model. We did nothing in the sector model as it has about 5% more weight because we have not needed to be as active in our portfolio management adjustments. BRK-B shows strong momentum with a value/quality tilt and positive technicals. We were also decently underweight financial holdings in the equity model.
Equity Model
- Initiate a 1.5% position in Berkshire Hathaway B-Shares (BRK-B)
Nov 16th
Walmart beat earnings and sales estimates but was cautious on holiday spending. They did raise their EPS forecast, but it is slightly below Wall Street estimates. Today‘s decline brings the stock back to the lower end of its upward channel. Again, this will replace some of the laggards we sold last week.
Equity Model
- Cisco Systems (CSCO) will be sold on a bounce from oversold levels.
- Initiating a 1.5% position in Walmart (WMT)
Nov 17th
We previously discussed that oil had gotten extremely overbought and was due for a correction. Over the last month or so, that correction came and has gotten overdone, with oil prices dropping below $75/barrel. Given the oversold condition of oil, we are adding back to our Exxon Mobil (XOM) after previously taking profits and increasing our stake in the iShares Energy ETF (XLE).
Equity Model
- Add 1% to Exxon Mobil (XLE), increasing the portfolio weight to 3%
ETF Model
- Add 1% to the iShares Energy ETF (XLE)

Lance Roberts, C.I.O.
Have a great week!

