
Inside This Week’s Bull Bear Report
- Looser Financial Conditions Are A Problem
- How We Are Trading It
- Research Report – Why You Have Poor Performance This Year
- Youtube – Before The Bell
- Market Statistics
- Stock Screens
- Portfolio Trades This Week
Market Review And Update
We hope that you and your families had a wonderful and blessed Thanksgiving with your families. We are also taking a much-needed break but wanted to provide you with an update on this week‘s market action.
Last week, we noted that:
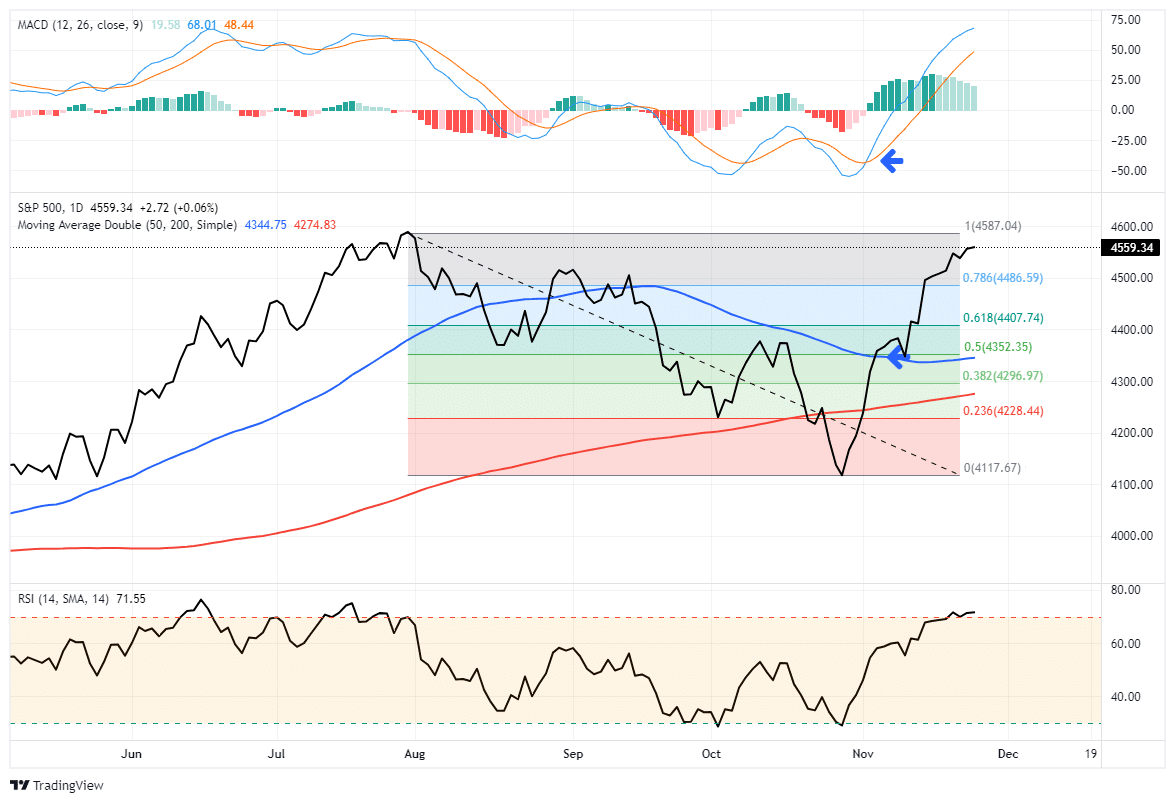
“Market rallies are common heading into year-end, and this rally is no different. However, we are now reaching more extreme levels of typical reflexive rallies, and a consolidation or correction to support should be expected.
We are currently wrestling with the 78.6% retracement level, which is also resistance from the September highs. Given the more overbought conditions, it is not surprising the market has had trouble advancing over the last several days. Given we are entering a holiday-shortened week, trading volume will be light, and volatility will likely pick up. If the market does correct soon, supports will be the previous 61.8% and 50% retracement levels, respectively. “
That rally continued this past week, and we are approaching the 100% retracement of the July highs. Such changes the dynamics of a pullback to the previous resistance levels of 78.6%, 61.8%, and 50% retracements. With the 50-DMA coinciding with the last 50% retracement level, we expect the maximum drawdown of any correction to hold that level going into year-end.
As we will discuss in more detail on Tuesday, the typical seasonal trends of the market suggest that a pullback in early December should be expected. (Notice the early December dip in the chart below.)
“Before “Santa Claus” makes his anticipated visit to “Broad and Wall,“ mutual funds must distribute their capital gain, dividends, and interest income for the year. These distributions start in late November, but a large number of distributions occur in the first two weeks of December. Again, notice that dip in the seasonality chart above.”
While the setup for a year-end rally remains intact, such does not preclude a short-term “dip“ to reduce the market’s more extreme overbought and deviated conditions currently. Such will provide a much better entry point to increase equity risk accordingly.
However, heading into next year, the stock and bond rally creates a problem for the Fed as looser financial conditions will potentially help sustain inflationary pressures in the economy.
That is a problem the Federal Reserve doesn’t want at the moment.
Need Help With Your Investing Strategy?
Are you looking for complete financial, insurance, and estate planning? Need a risk-managed portfolio management strategy to grow and protect your savings? Whatever your needs are, we are here to help.

Looser Financial Conditions Are A Problem
In last week’s newsletter, we discussed how the rally was problematic for the Fed. To wit:
“The problem with market rallies and yields dropping is that it undoes the financial constriction they provided on the economy. Higher asset prices boost consumer confidence, and lower yields provide buying power. Both actions create the possibility of a resurgence in inflation, putting the Fed back into “hawkish” mode to ensure inflation falls.“
Given tight bank lending standards, that discussion sparked many emails about why a rally in stocks and bonds mattered.
It is a good question and worth discussing in more detail.
First, we must go back to a statement by Fed Chairman Ben Bernanke in 2010 when he launched a second round of “quantitative easing.“
“This approach eased financial conditions in the past and, so far, looks to be effective again. Stock prices rose, and long-term interest rates fell when investors began to anticipate this additional action. Easier financial conditions will promote economic growth. For example, lower mortgage rates will make housing more affordable and allow more homeowners to refinance. Lower corporate bond rates will encourage investment. And higher stock prices will boost consumer wealth and help increase confidence, which can also spur spending. Increased spending will lead to higher incomes and profits that, in a virtuous circle, will further support economic expansion.“
– Ben Bernanke, Washington Post Op-Ed, November, 2010.
There it is in black and white.
A zero Federal funds rate and a bond-buying program resulted in higher asset prices and lower long-term interest rates. In other words, the rally in stocks and bonds eased financial conditions by creating a “wealth effect.” That “wealth effect“ boosted spending, which led to “higher incomes and profits that, in a virtuous circle, will further support economic expansion.“
At the time, this was the result the Federal Reserve wanted as economic growth and inflation were running at very low annualized rates and were at risk of slipping into recessionary territory.

However, currently, that is not the case. Both economic growth and inflation are still well above the Federal Reserve’s “comfort zone.“ If the current economic data continues to strengthen, as Wall Street expects next year to support increased earnings growth, then inflation will potentially rise from the pickup in demand.
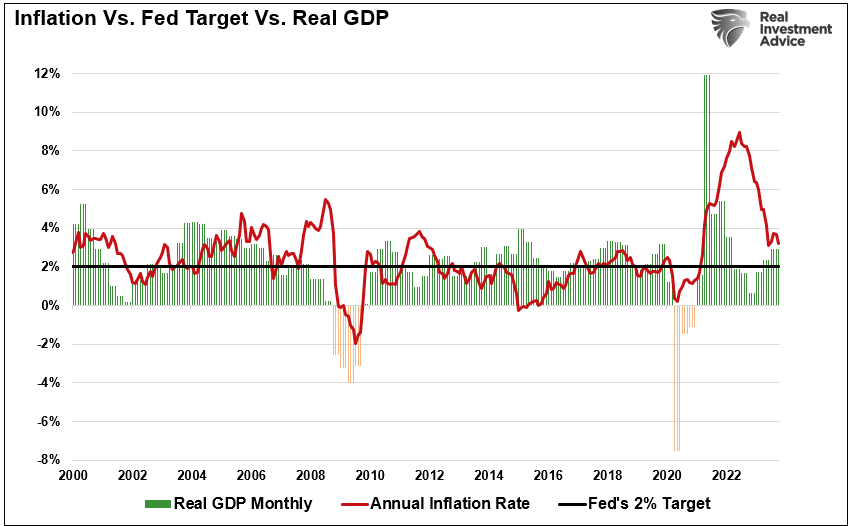
Given that the inflation spike was due to the artificial surge in demand created by government stimulus, the Fed countered that demand by tightening financial conditions. However, looser financial conditions from rising asset prices and falling yields, thereby increasing consumer sentiment, undermine the Fed’s goal.
The biggest fear of the Federal Reserve is a repeat of the 1970s.
That 70s Show
In “That 70s Show,” we discussed the problem facing the Fed, where monetary policy actions only temporarily quelled inflationary pressures.
“When the US Federal Reserve embarked on an aggressive campaign to quash inflation last year, it did so with the goal of avoiding a painful repeat of the 1970s, when inflation spun out of control and economic malaise set in.“ – CNN
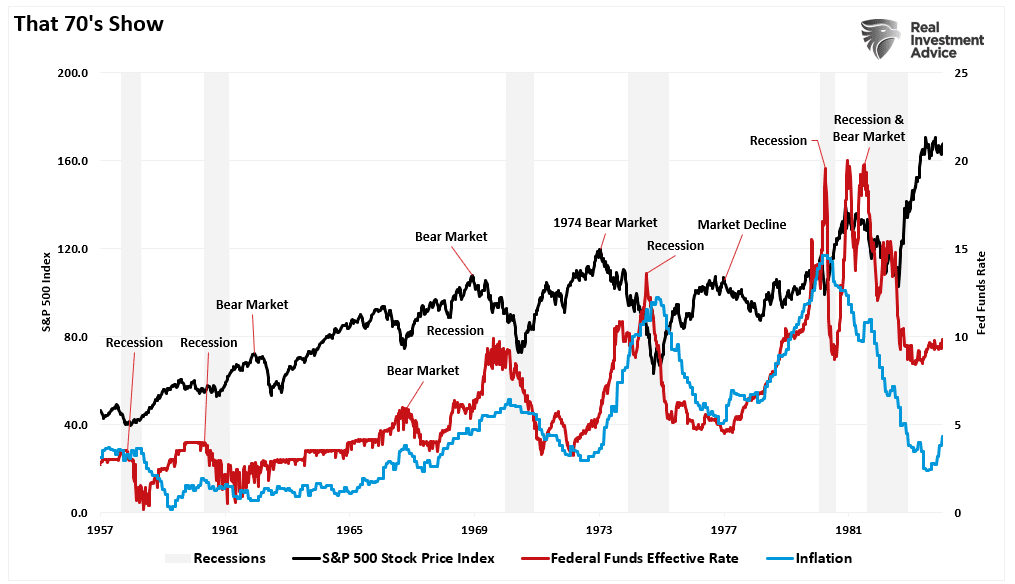
That concern of “spiraling inflation” remains the key concern of the Federal Reserve in its current monetary policy decisions.
You will also notice in the chart above that each period of rising inflation coincided with increased stock prices. As discussed in that article, Authur Burns and Paul Volker, then Chairmen of the Federal Reserve, would engage in an aggressive rate-hiking campaign. Such eventually resulted in a bear market, a recession, or both.
“The chair of the Federal Reserve at the time, Arthur Burns, hiked interest rates dramatically between 1972 and 1974. Then, as the economy contracted, he changed course and started cutting rates.
Inflation later roared back, forcing the hand of Paul Volcker, who took over at the Fed in 1979, Richardson said. Volcker brought double-digit inflation to heel — but only by raising borrowing costs high enough to trigger back-to-back recessions in the early 1980s that at one point pushed unemployment above 10%.
‘If they don’t stop inflation now, the historical analogy [indicates] it‘s not going to stop, and it‘s going to get worse,‘ said Richardson, an economics professor at the University of California, Irvine.“ – CNN
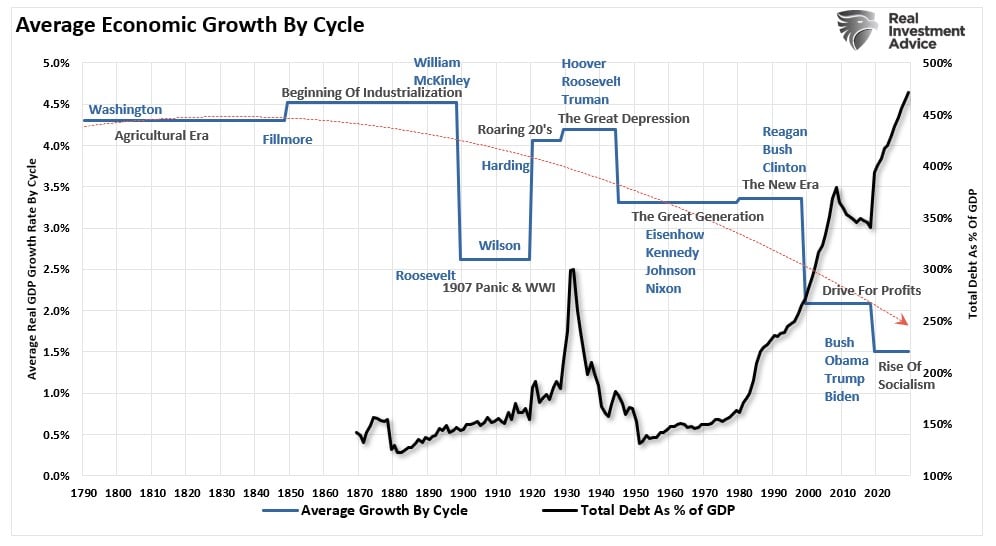
However, there are many reasons why today differs from the 1970s and why such an environment can not exist today. The most notable reason is the current level of debt.
“While the Fed is currently engaged “in the fight of its life,“ trying to quell inflation, The economic differences are vastly different today. Due to the heavy debt burden, the economy requires lower interest rates to sustain even meager economic growth rates of 2%. Such levels were historically seen as “pre-recessionary,” but today, they are something economists hope to maintain.”
However, such does not mean inflation can’t pick up modestly if consumer confidence increases economic demand. That was the problem with the 70s, as stock and bond market rallies created looser financial conditions.
2-Measures Of Financial Conditions
As noted, the recent drop in bond rates and surge in the stock market works against the Fed’s goal of tightening monetary conditions. The Fed’s goal remains “tighter” conditions to reduce consumer spending and increase unemployment to reduce economic demand. The only way to quell inflation, which is solely a function of supply and demand, is to cripple the demand side of the equation. As discussed last week, two measures of financial conditions suggest the market is working against the Fed.
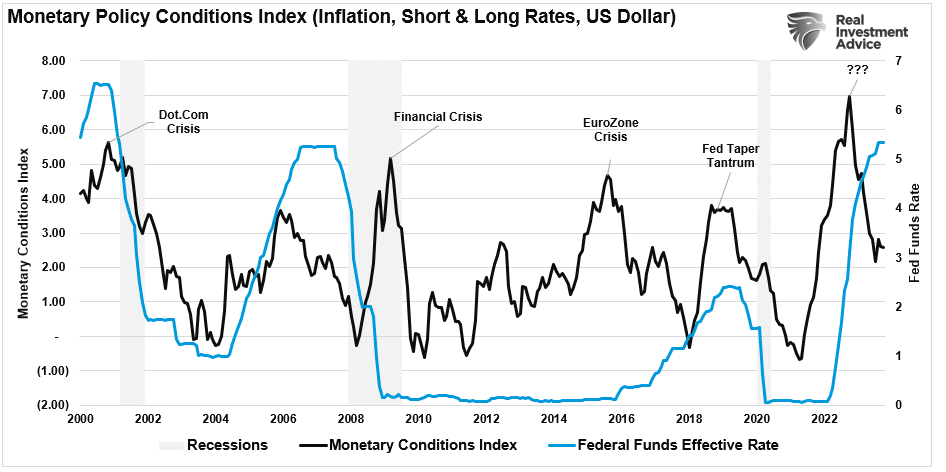
The first is our monetary policy conditions index.
“The ‘monetary policy conditions index‘ measures the 2-year Treasury rate, which impacts short-term loans; the 10-year rate, which affects longer-term loans; inflation, which impacts the consumer; and the dollar, which impacts foreign consumption. Historically, when the index has reached higher levels, it has preceded economic downturns, recessions, and bear markets. Unsurprisingly, when monetary policy conditions have become tight, and the event occurs, the Fed generally cuts rates or keeps them at zero, providing liquidity to the markets.”
“Secondly, as we noted in ‘Bond Bear Market,’ there are implications for the Federal Reserve as bond rates are repriced lower, particularly when it remains focused on inflation. Lower yields and potentially higher asset prices reverse the financial conditions the Fed hoped to tighten. As shown below, our economic conditions index has loosened over the past week.”
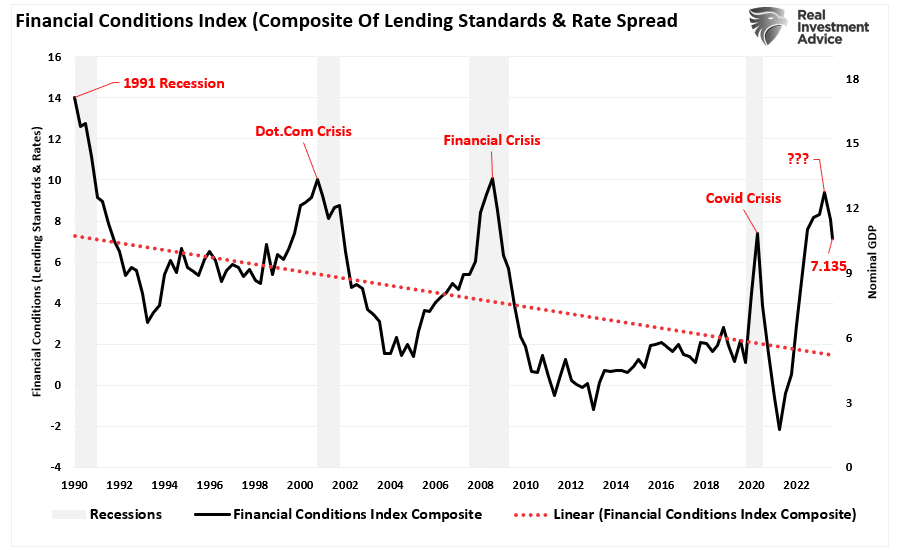
Looser financial conditions are problematic for the Fed, which needs tighter conditions to bring down inflation towards their target rate. As Michael Lebowitz noted this week, the market may not like what the Fed says next month.
A December Fed Shocker?
“The Fed’s tone markedly changed in the weeks preceding the November 1 FOMC meeting. Many Fed speakers offered that higher interest rates will tighten financial conditions, thus allowing them to take a break from rate increases. The messaging was solidified at the November 1 FOMC meeting. To wit, the following statement from Jerome Powell.
“In this case, the tighter financial conditions we’re seeing from higher long-term rates and other sources like the stronger dollar and lower equity prices could matter for future rate decisions as long as the two conditions are satisfied. The first is that the tighter conditions would need to be persistent and that is something that remains to be seen. But that‘s critical. Things are fluctuating back and forth. That‘s not what we’re looking for. With financial conditions, we’re looking for persistent changes that are material. The second thing is that the longer-term rates that have moved up can’t simply be a reflection of expected policy moves from us that we would then, that if we didn’t follow through on them, then the rates would come back down.” – Michael Lebowitz
What Powell stated was overlooked by the market last week. Powell clarifies that recent interest rate increases, a stronger dollar, and weaker stock prices could keep them from hiking rates. However, he qualifies the statement by emphasizing they want to see the persistence of said market conditions. What they do not desire, as shown above, is a reversal to looser financial conditions. In other words, the Fed does NOT want to see stock prices and bond yields “fluctuating back and forth.“
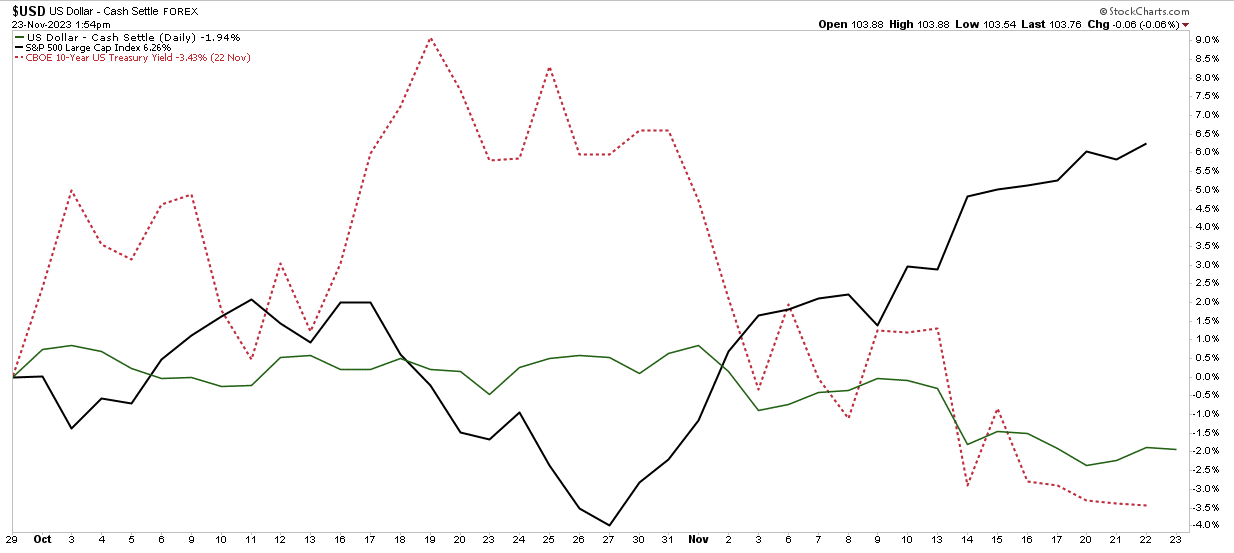
Of course, since the Fed meeting, stocks have risen about 10%, ten-year note yields are nearly 0.50% lower, and the dollar index has fallen 3%. Looser financial conditions are precisely the opposite of the Fed’s stated goals.
With the next FOMC meeting coming in mid-December, looser financial conditions will likely force the Fed to revert to its more hawkish tone to once again tighten financial conditions.
The question is how the stock and bond markets will react to the disappointment of “coming rate cuts” when “higher for longer” remains the Fed’s mantra.
We suspect that if the Fed fails to change its message, the stock and bond markets are set up for short-term disappointment.
How We Are Trading It
As we noted in Thursday’s Daily Market Commentary:
“With both the stock and bond markets reaching more extreme overbought conditions, this is a good opportunity to temporarily take profits and wait for a correction to add back into these positions. Whatever triggers a correction in stocks will also trigger a correction in bonds, given their high correlation this year. Most likely, comments from the Federal Reserve about needing to remain vigilant on inflation will likely do the trick as they try to push out current expectations of near-term rate cuts.”
That remains good advice heading into December, and as stated above, before any potential disappointment from the Federal Reserve. Let me repeat the following from last week’s newsletter:
“I know many got caught flat-footed by the magnitude of the recent rally. Therefore, if you are underweight equities and feel pressured to add positions, do so carefully. As an individual investor, there is no need to chase markets. Use pullbacks opportunistically to add exposure as needed to match your risk profile. The following rules are helpful in adding exposure in a tenuous environment.”
- Move slowly. There is no rush to make dramatic changes. Doing anything in a moment of “panic” tends to be the wrong thing.
- If you are underweight equities, DO NOT try to fully adjust your portfolio to your target allocation in one move. Again, after significant market moves, individuals feel like they “must” do something.
- Begin by selling laggards and losers.
- Add to sectors or positions performing with or outperforming the broader market if you need risk exposure.
- Move “stop-loss” levels up to recent lows for each position.
- Be prepared to sell into the rally and reduce overall portfolio risk.
- If none of this makes sense, please consider hiring someone to manage your portfolio. It will be worth the additional expense over the long term.

Have a great week.
Research Report
Subscribe To “Before The Bell” For Daily Trading Updates
We have set up a separate channel JUST for our short daily market updates. Please subscribe to THIS CHANNEL to receive daily notifications before the market opens.
Click Here And Then Click The SUBSCRIBE Button
Subscribe To Our YouTube Channel To Get Notified Of All Our Videos
Bull Bear Report Market Statistics & Screens

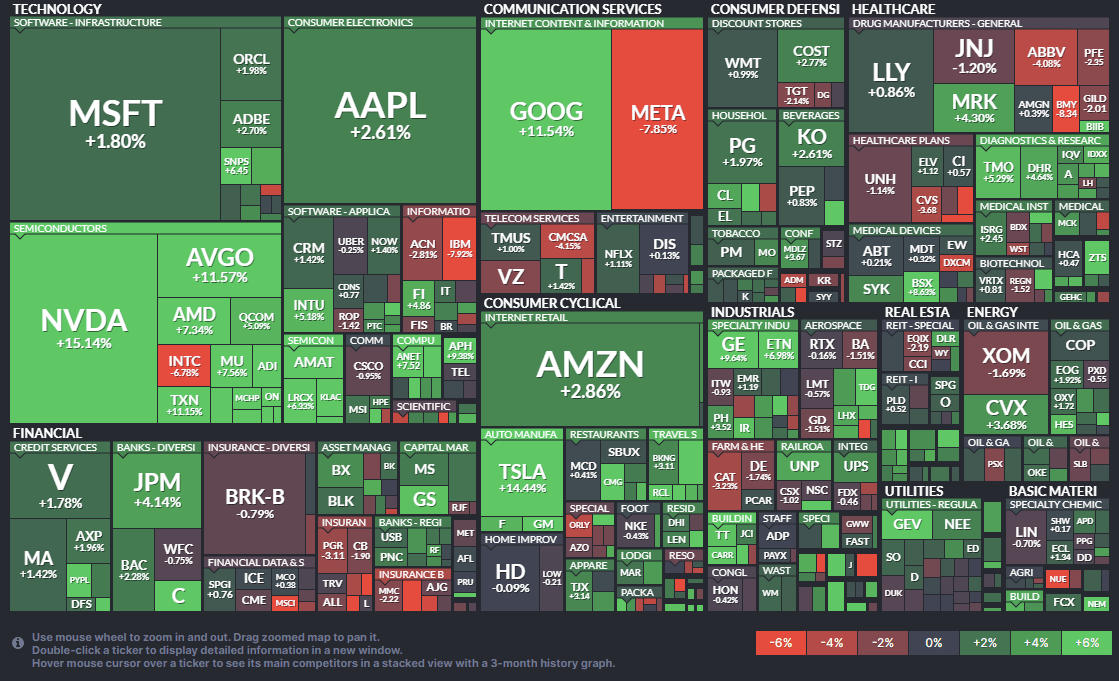
SimpleVisor Top & Bottom Performers By Sector
S&P 500 Weekly Tear Sheet

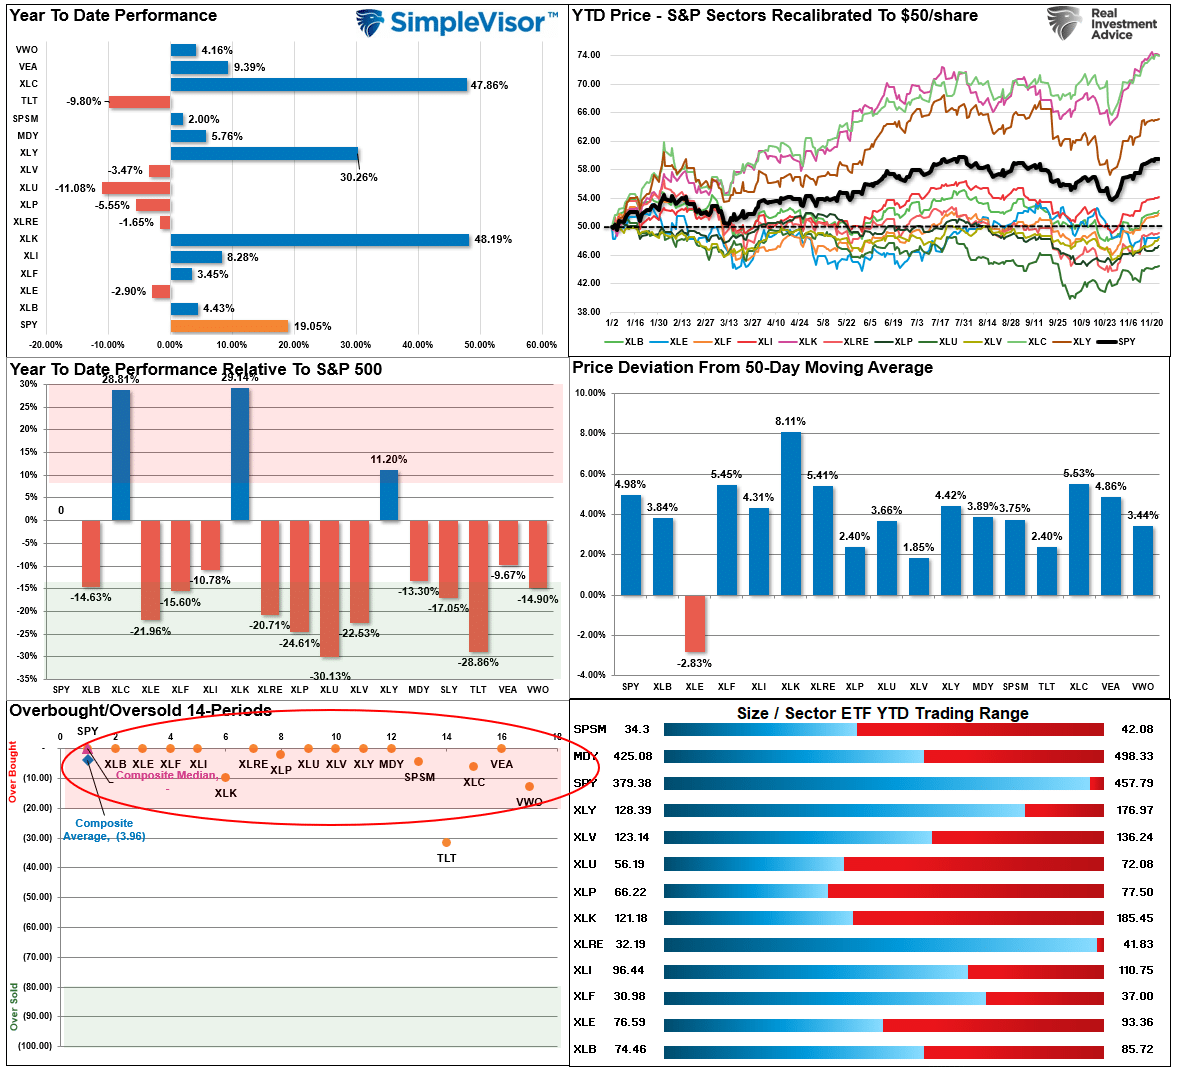
Relative Performance Analysis
Nothing changed last week in terms of the more extreme short-term overbought conditions. The market will experience a short-term correction sooner rather than later to relieve the more extreme conditions. Such will provide a better entry point to add exposure. While the market can remain overbought longer than expected, extreme conditions rarely last long. Be patient. You will have a better opportunity to add exposure before the year-end rally concludes.
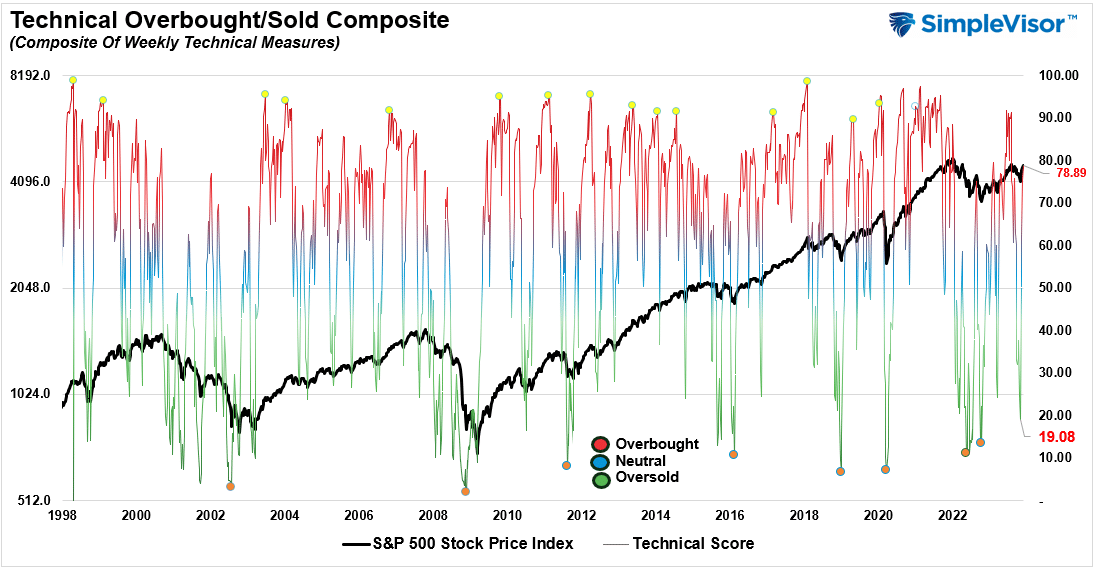
Technical Composite
The technical overbought/sold gauge comprises several price indicators (R.S.I., Williams %R, etc.), measured using “weekly” closing price data. Readings above “80” are considered overbought, and below “20” are oversold. The market peaks when those readings are 80 or above, suggesting prudent profit-taking and risk management. The best buying opportunities exist when those readings are 20 or below.
The current reading is 78.89 out of a possible 100.
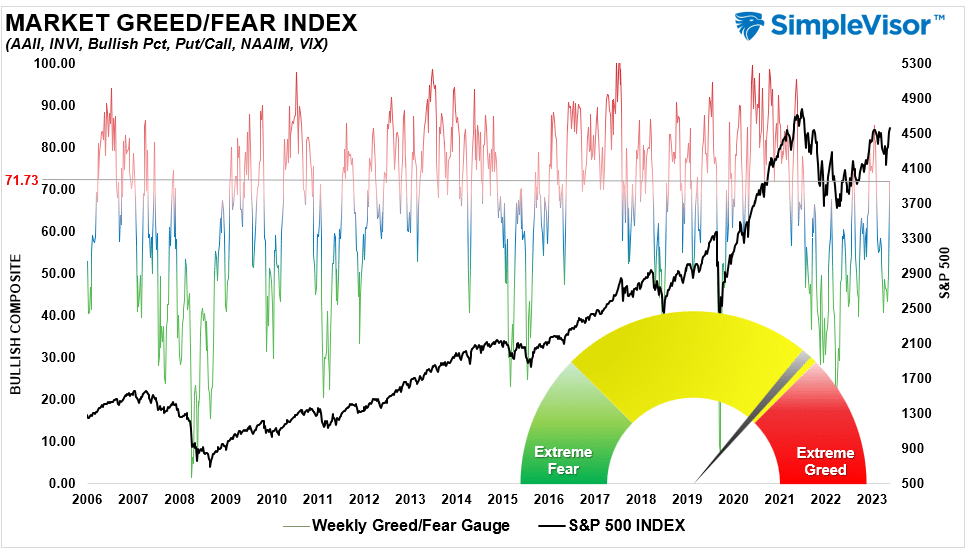
Portfolio Positioning “Fear / Greed” Gauge
The “Fear/Greed” gauge is how individual and professional investors are “positioning” themselves in the market based on their equity exposure. From a contrarian position, the higher the allocation to equities, the more likely the market is closer to a correction than not. The gauge uses weekly closing data.
NOTE: The Fear/Greed Index measures risk from 0 to 100. It is a rarity that it reaches levels above 90. The current reading is 71.73 out of a possible 100.
Relative Sector Analysis
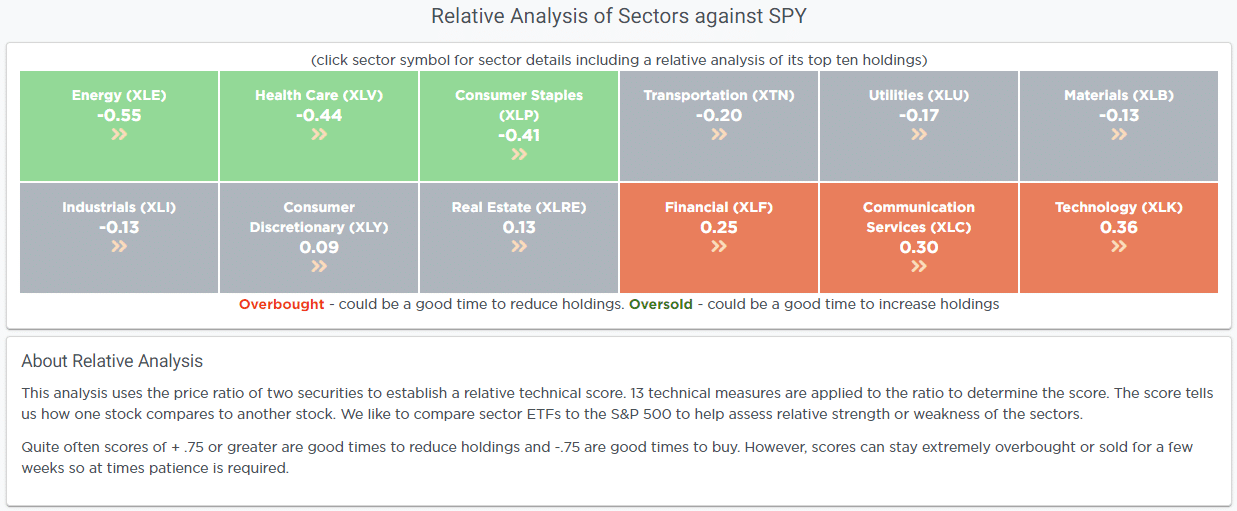
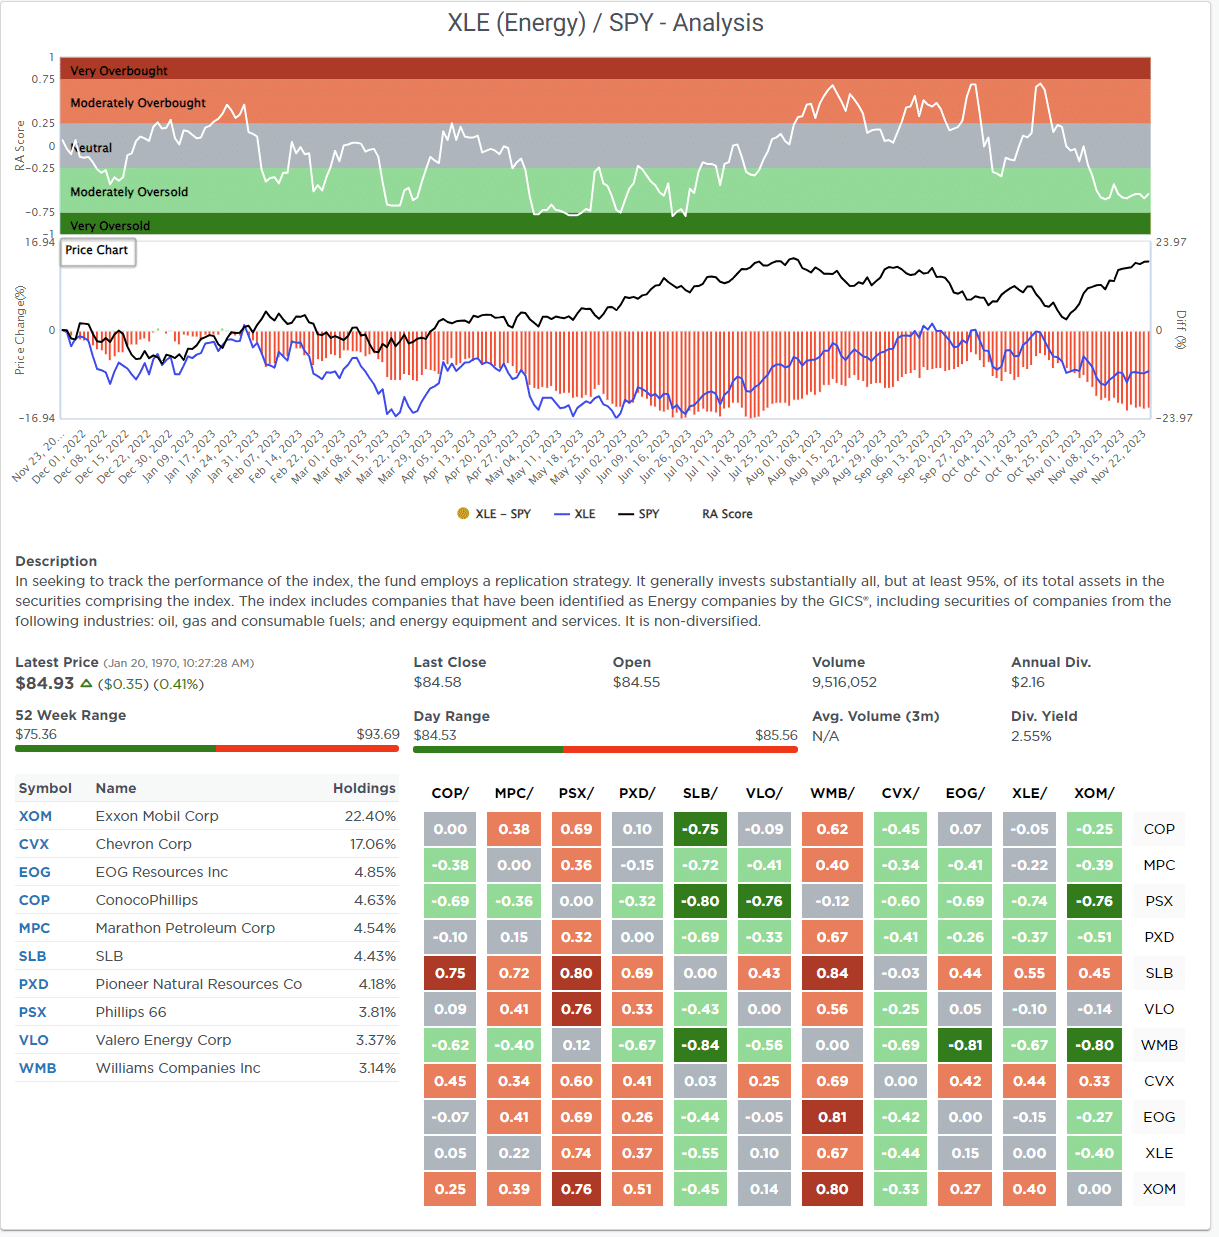
Most Oversold Sector Analysis
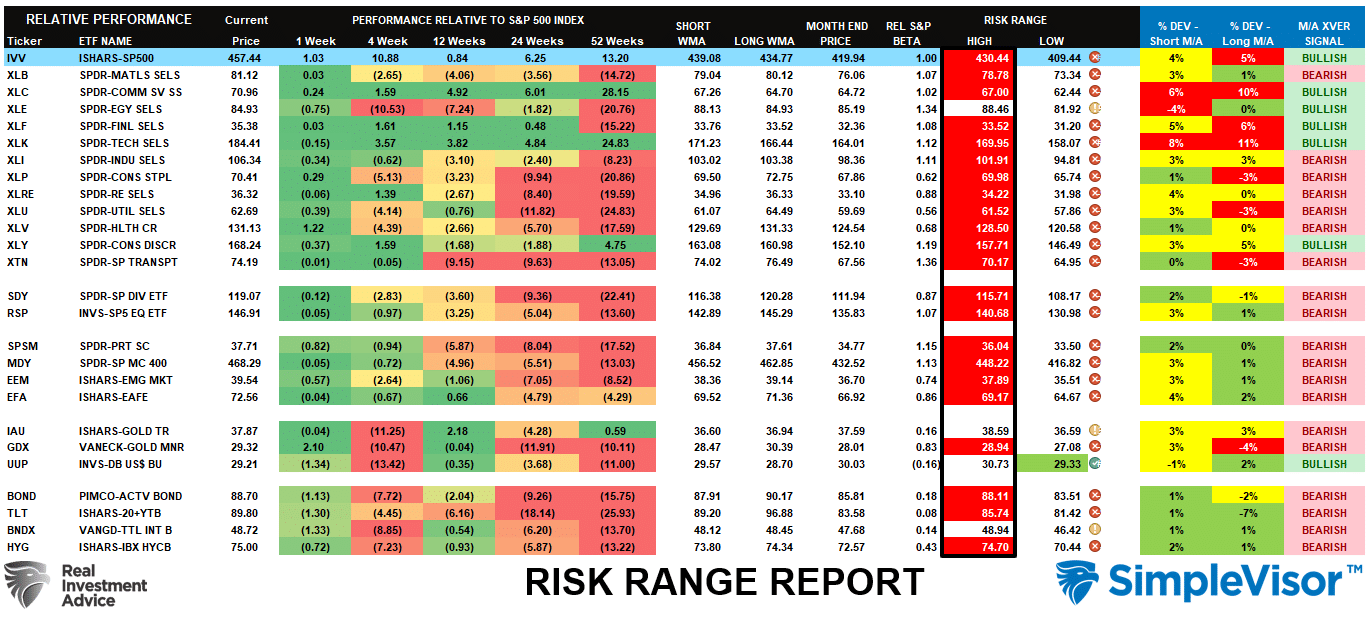
Sector Model Analysis & Risk Ranges
How To Read This Table
- The table compares the relative performance of each sector and market to the S&P 500 index.
- “MA XVER” (Moving Average Crossover) is determined by the short-term weekly moving average crossing positively or negatively with the long-term weekly moving average.
- The risk range is a function of the month-end closing price and the “beta” of the sector or market. (Ranges reset on the 1st of each month)
- The table shows the price deviation above and below the weekly moving averages.
As noted above in the Market Sector Relative Performance table, almost every major sector and market is currently overbought and outside normal monthly trading ranges. Such extremes are unsustainable, and a reversal will occur. Take profits as needed and sell laggards for tax loss harvesting as we approach year-end. I can’t remember seeing a time when virtually every asset class traded at such extremes. A reversal will occur to provide a better entry point for those who are patient.
Weekly SimpleVisor Stock Screens
We provide three stock screens each week from SimpleVisor.
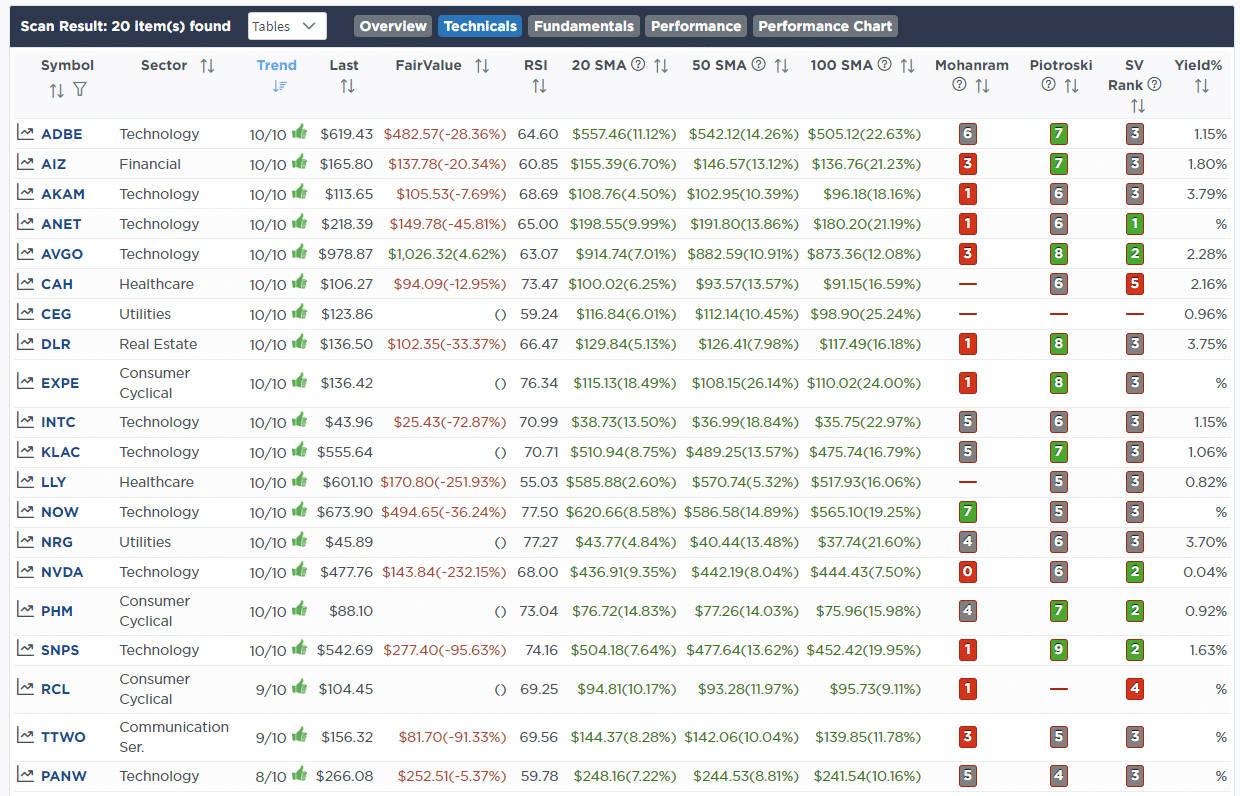
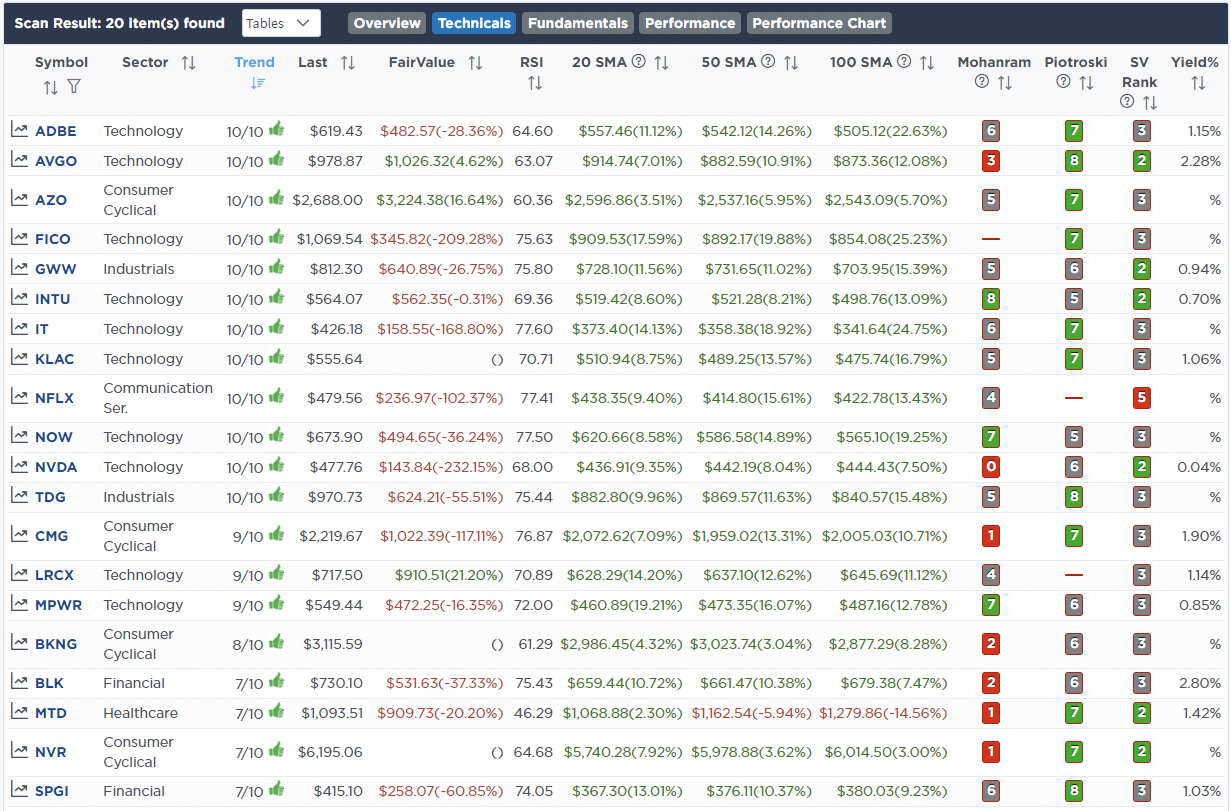
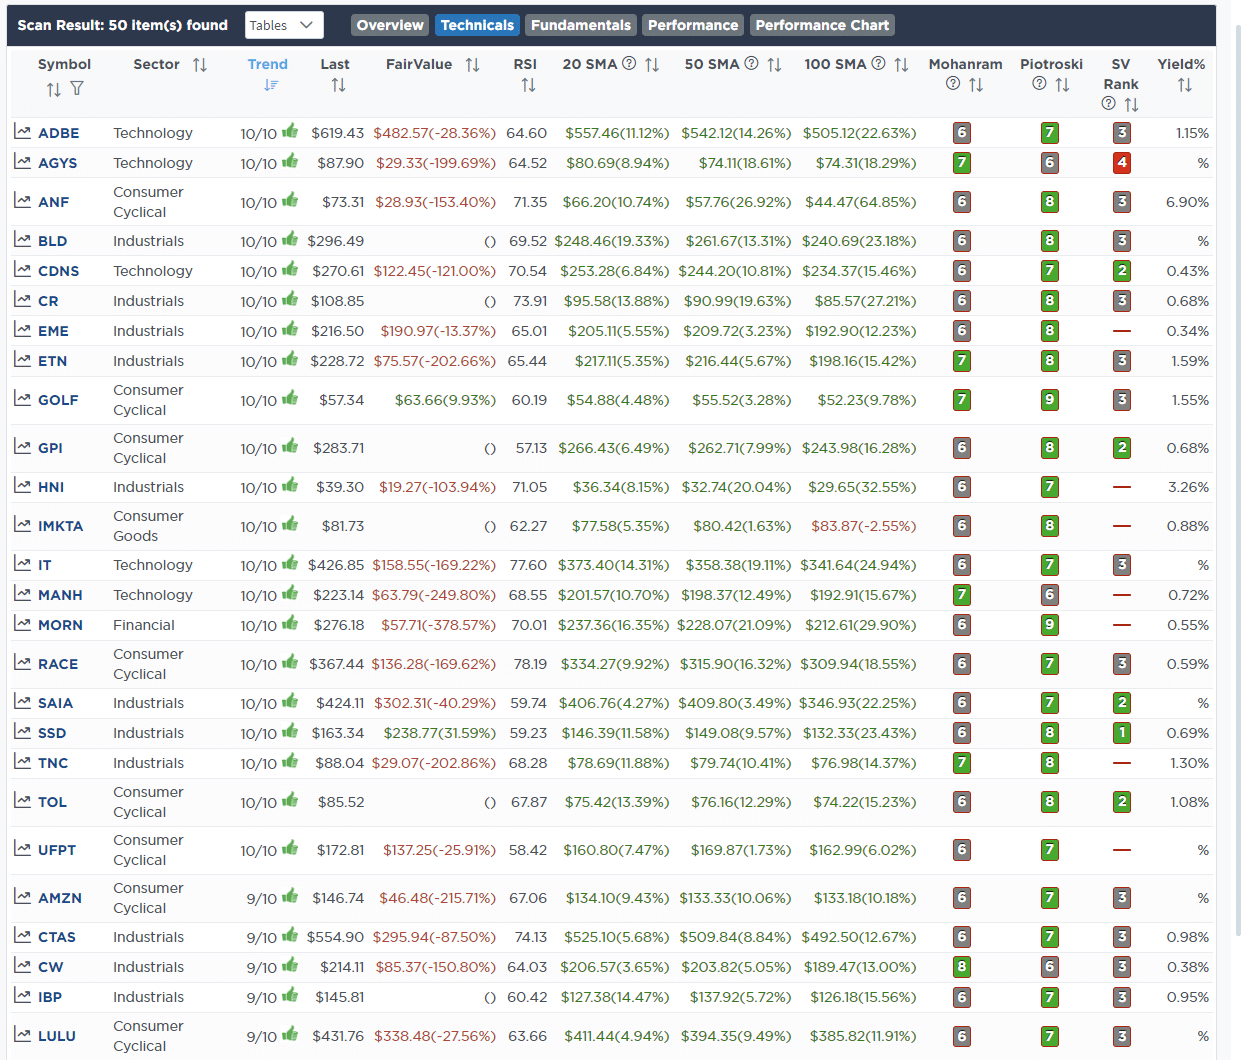
This week, we are searching for the Top 20:
- Relative Strength Stocks
- Momentum Stocks
- Fundamental & Technical Strength
(Click Images To Enlarge)
R.S.I. Screen
Momentum Screen
Fundamental & Technical Strength
SimpleVisor Portfolio Changes
We post all of our portfolio changes as they occur at SimpleVisor:
Nov 20th
This morning, we trimmed Nvidia (NVDA) and AMD (AMD) back to the original model weights. As we have repeatedly discussed over the last couple of weeks, we have used the recent rally to rebalance portfolio risk, take profits, and perform tax loss harvesting.
In the case of NVDA and AMD, both have risen sharply as a percentage of the portfolio since the beginning of the month, and the positions are up roughly 20% over the last few weeks. With both considerably overbought, we are taking profits ahead of Nvidia‘s earnings report tomorrow. If NVDA misses or has soft guidance, we could see a rather sharp repricing that would allow us to add to the position at lower levels.
Equity Model
- Reduce Nvidia (NVDA) and AMD (AMD) to 2% of the portfolio respectively.

Lance Roberts, C.I.O.
Have a great week!

