
Inside This Week’s Bull Bear Report
- Analysts Are Always Bullish For A Simple Reason
- How We Are Trading It
- Research Report – Updating Recessionary Indicators
- Youtube – Before The Bell
- Market Statistics
- Stock Screens
- Portfolio Trades This Week
Market Review And Update
It’s that time of year when Wall Street analysts start pinning targets for next year’s performance of the S&P 500. Unsurprisingly, they are unanimously bullish, but there is a simple reason for that, which we will discuss today.
However, before digging into that issue, November turned into a stunner, reversing the extremely bearish sentiment we saw in October. As noted in yesterday’s Daily Market Commentary:
“The market spent most of yesterday waffling in negative territory, but a very late-day buying spree in the last half hour sent the S&P 500 into positive territory to close out the month. But what a month it was, with the S&P 500 rallying nearly 9% for the month. It is worth noting that since mid-month, the volume behind the rally has weakened as the markets became more severely overbought.”
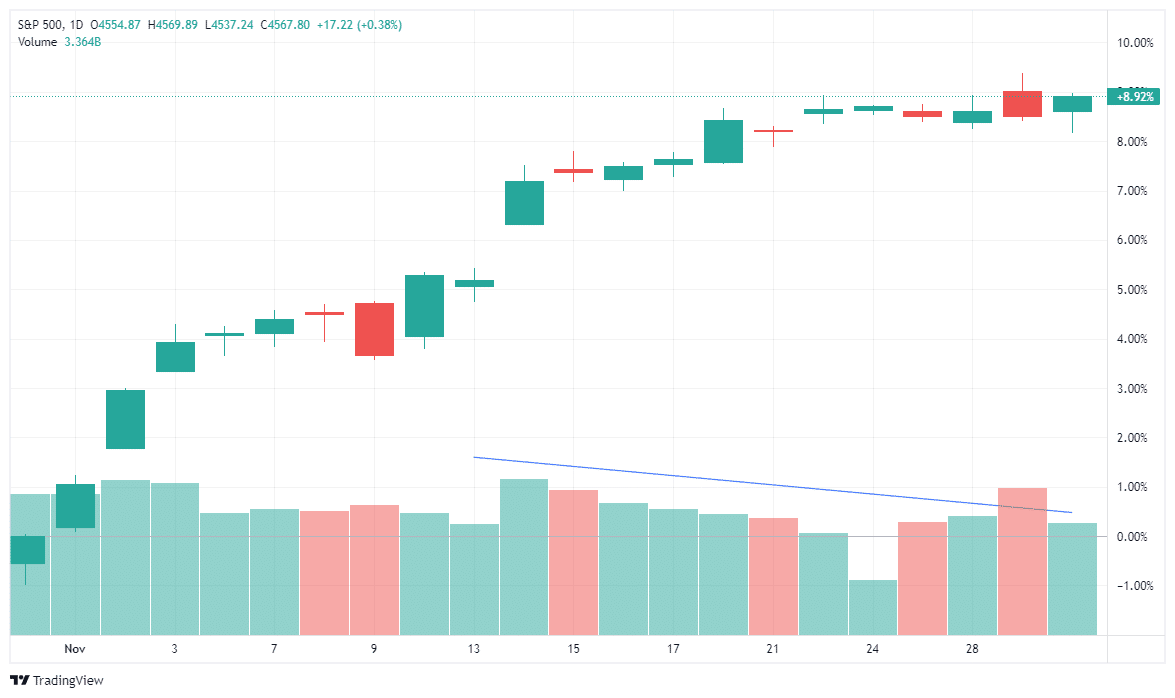
This provides some perspective as investors are getting overly excited about the market heading into year-end. As discussed last week, we still expect a consolidation or correction over the next three weeks before the year-end “Santa Rally.”
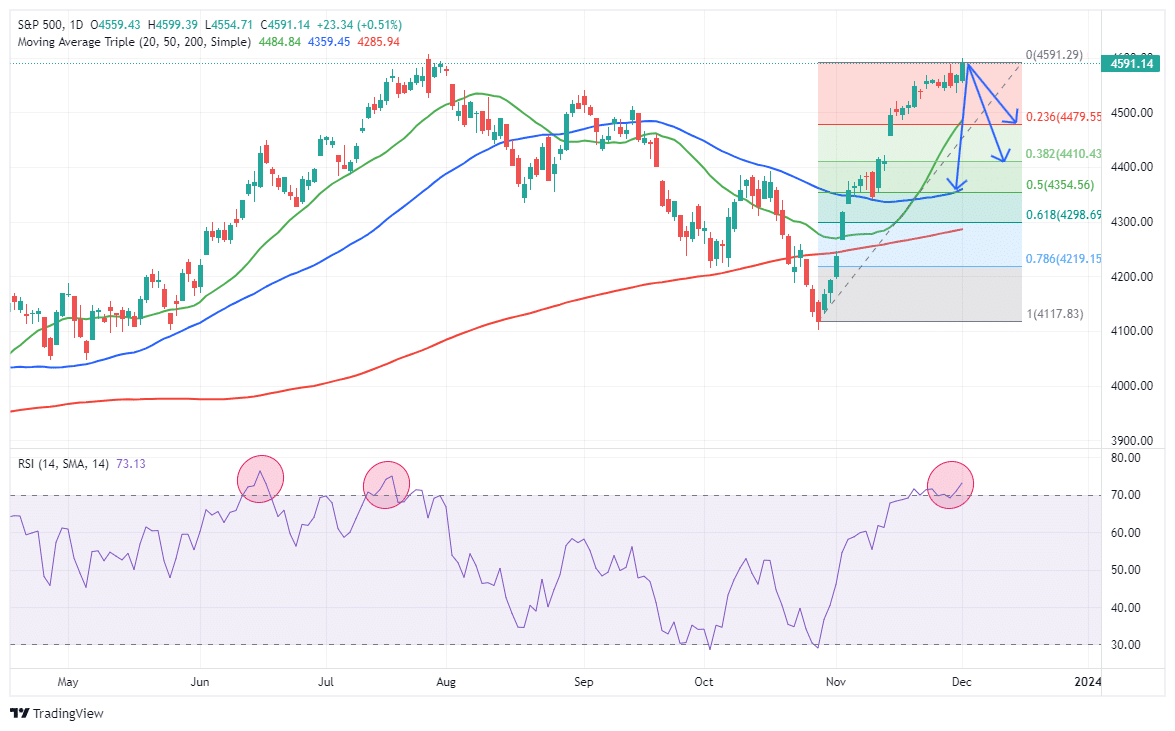
“That rally continued this past week, and we are approaching the 100% retracement of the July highs. Such changes the dynamics of a pullback to the previous resistance levels of 78.6%, 61.8%, and 50% retracements. With the 50-DMA coinciding with the last 50% retracement level, we expect the maximum drawdown of any correction to hold that level going into year-end.”
While it seems as if “nothing will stop the market,” such was the same sentiment we discussed in July in “Trading An Unstoppable Bull Market.” To wit:
“We must remember that market advances can only go so far before an eventual correction occurs. My best guess is that if the markets are to reach all-time highs this year, we will likely have a correction to reset some of the more extreme overbought conditions.”
Of course, that correction came the next month.
Notably, we noted in July that our gauge of individual and professional investors’ “positioning” is getting overly bullish, which also corresponds to the collapse in the volatility index. From a contrarian position, the higher the allocation to equities, the more likely the market is closer to a correction.
As shown, we are once again at similar levels.
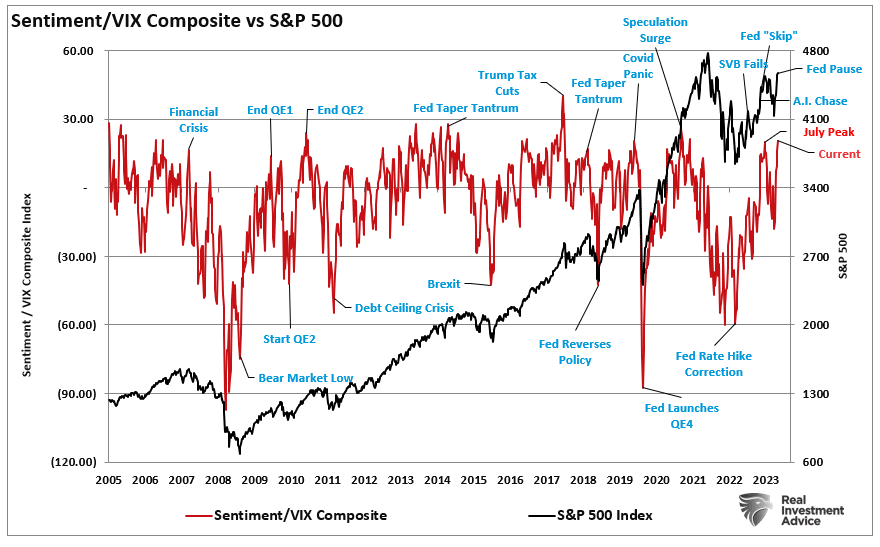
Despite this bull market run once again seems to be “unstoppable,” it won’t be. We still expect a short-term correction or consolidation to provide a better entry point to increase equity positioning. Trade accordingly.
Need Help With Your Investing Strategy?
Are you looking for complete financial, insurance, and estate planning? Need a risk-managed portfolio management strategy to grow and protect your savings? Whatever your needs are, we are here to help.

Analysts Are Always Bullish For A Simple Reason
Yahoo Finance had an interesting post last week discussing why Wall Street analysts are usually bullish. To wit:
“Over time, stocks usually go up. But the long arc of market history is not the reason Wall Street strategists and analysts are more often than not taking the bullish side of the argument when it comes to companies, sectors, and indexes. Rather, it is because the audience that Wall Street research teams try to reach first gets paid to be invested.“
That is a true statement. Over time, stocks go up more often than they go down. In fact, stocks go up about 80% of the time. However, it is the 20% of the time they go down that is the problem. As shown below, over the entire market history, on a buy-and-hold basis, stocks only make new highs about 15% of the time. The rest of the time, they are making up for previous losses.

So, the real question is WHO is paid to remain invested – the audience or the Wall Street professional?
Who Really Benefits
The article answers that question in the next paragraph.
Unfortunately, the ‘yeah-but bears’ will likely continue to morph their narrative to fit their cause. As investment strategists, our job is to invest — period.” – ” BMO Capital’s chief investment strategist Brian Belski
That is correct. If, for example, Brian told clients to be in cash, the firm he manages money for makes no fees. The point is that Wall Street is incentivized to keep you always invested. Such is why every conceivable “fee-based” product has been created to replace the old “commission” based investment programs. This was a revolutionary change for Wall Street, which changed asset management into an annuitized product. The advice game changed from actual investment management to “buy and hold” to collect the annuitized asset fees.
I have counseled individuals to disregard mainstream analysts, Wall Street recommendations, and even MorningStar ratings due to the inherent conflict of interest between the firms and their particular clientèle. Here is the point:
- YOU are NOT Wall Street’s client.
- YOU are the CONSUMER of the products sold FOR Wall Street’s clients.
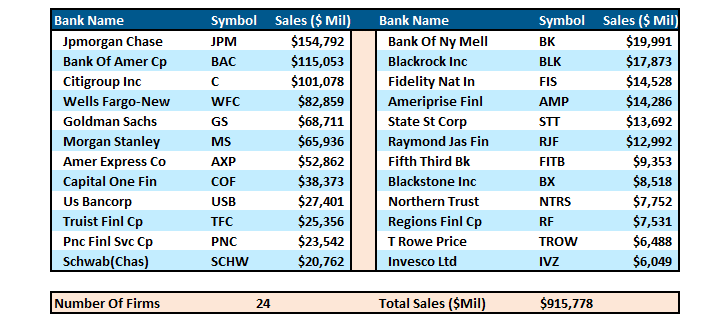
Major brokerage firms are big business. I mean REALLY big business. As in, almost $1 Trillion a year in revenue big. The table below shows the annual revenue of 24 of the largest investment firms in the S&P 500.
Furthermore, like all businesses, these companies must increase corporate profitability annually regardless of market conditions.
This is where the conflict of interest arises.
Regarding Wall Street profitability, the most lucrative transactions are NOT from servicing “Mom and Pop” retail clients trying to invest their way toward retirement. Wall Street is not “invested” along with you but “uses you” to make income.
This is why Wall Street heavily promotes “buy and hold” investment strategies. Therefore, as long as your dollars remain in mutual funds, stocks, ETFs, etc, brokerage firms collect fees regardless of what happens in the market. These strategies are undoubtedly in their best interest – not necessarily yours.
But those retail management fees are a sideline to the big money.
Who Is Wall Street’s Real Client
Wall Street analysts’ real clients are multi-million and billion-dollar investment banking transactions, such as public offerings, mergers, acquisitions, and bond offerings, which generate hundreds of millions to billions of dollars in fees for Wall Street each year.
For a firm to “win” that business, Wall Street must cater to those prospective clients. In this respect, it is challenging for the firm to gain investment banking business from a company they have a “sell” rating on. This is why Wall Street firms rate a vast majority of stocks a “buy” or “strong buy” rather than “sell,” as it does not disparage the end client. To see how prevalent the use of the “buy” rating is, I have compiled a chart of 5170 stocks ranked by the number of “Buy,” “Hold,” and “Sell” ratings.

See the problem here. Just 6.4% of all stocks have a “sell” rating.
Do you believe that out of 5170 companies, only 331 should be “sold?”
You shouldn’t. But for Wall Street analysts, a “sell” rating is not good for business.
The conflict doesn’t end just at Wall Street’s pocketbook. Companies depend on rising stock prices as they are a considerable part of executive compensation packages.
Corporations apply pressure on Wall Street firms to ensure positive research reports with the threat that they will take their business to another “friendlier” firm.
“If actual earnings varied somewhat randomly from above expectations to below expectations, we would likely fault the analysts and corporations with being poor forecasters. But when such one-directional forecasting errors routinely and consistently occur, it is more than bad forecasting. At best one can accuse Wall Street analysts and the companies that feed them information of incompetence. At worst this is another pure and simple case of institutions gaming the system through a fraud designed to prop up stock prices. Take your pick, but in either case it is advisable to ignore the spin that accompanies earnings releases and apply the rigor of doing your own analysis to get at the veracity of corporate earnings.” – Earnings Magic Exposed by Michael Lebowitz
Wall Street Needs You
When Wall Street wants to make a stock offering for a new company, they have to sell that stock to someone to provide their client, a company, with the funds they need. The Wall Street firm also makes a very nice commission from the transaction.
Generally, these publicly offered shares are sold to the firm’s biggest clients, such as hedge funds, mutual funds, and other institutional clients. But where do those firms get their money? From you.
Whether it is the money you invested in your mutual funds, 401k plan, pension fund, or insurance annuity, you are at the bottom of the money-grabbing frenzy. It’s much like a pyramid scheme – all the players above you are making their money…from you.
In a study by Lawrence Brown, Andrew Call, Michael Clement, and Nathan Sharp, it is clear that Wall Street analysts are not interested in you. The study surveyed analysts from the major Wall Street firms to try and understand what went on behind closed doors when research reports were being put together. In an interview with the researchers, John Reeves and Llan Moscovitz wrote:
“Countless studies have shown that the forecasts and stock recommendations of sell-side analysts are of questionable value to investors. As it turns out, Wall Street sell-side analysts aren’t primarily interested in making accurate stock picks and earnings forecasts. Despite the attention lavished on their forecasts and recommendations, predictive accuracy just isn’t their main job.”
The chart below is from the survey conducted by the researchers, which shows the main factors that play into analysts’ compensation. What analysts are “paid” to do is quite different from what retail investors “think” they do.
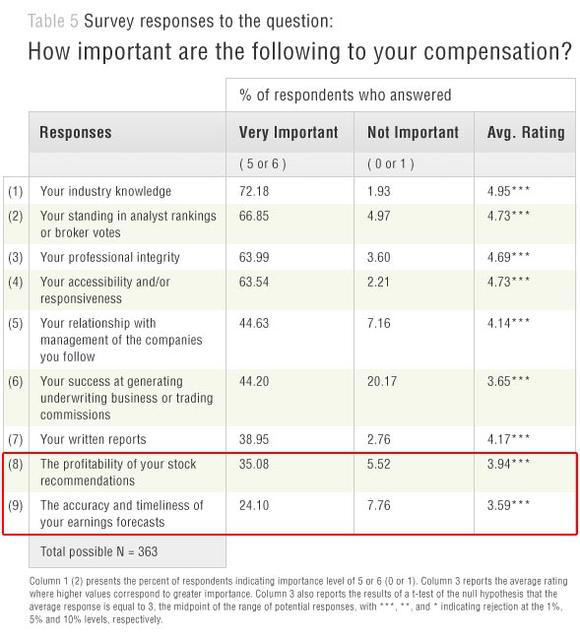
“Sharp and Call told us that ordinary investors, who may be relying on analysts’ stock recommendations to make decisions, need to know that accuracy in these areas is ‘not a priority.’ One analyst told the researchers:
‘The part to me that’s shocking about the industry is that I came into the industry thinking [success] would be based on how well my stock picks do. But a lot of it ends up being “What are your broker votes?”‘
A ‘broker vote’ is an internal process whereby clients of the sell-side analysts’ firms assess the value of their research and decide which firms’ services they wish to buy. This process is crucial to analysts because good broker votes result in revenue for their firm. One analyst noted that broker votes ‘directly impact my compensation and directly impact the compensation of my firm.’”
You Aren’t Important
The question becomes, “If the retail client is not the firm’s focus, then who is?” The survey table below clearly answers that question.
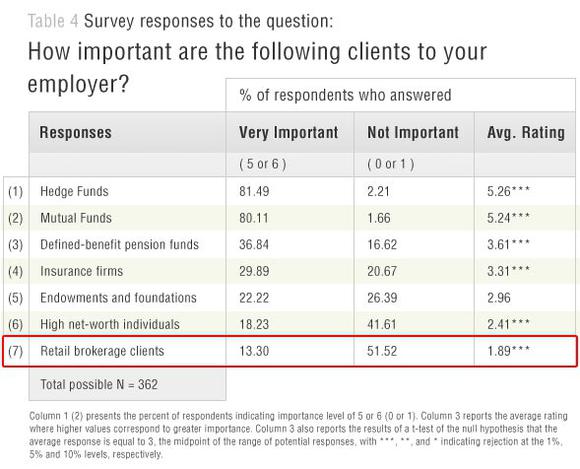
Not surprisingly, you are at the bottom of the list. The incestuous relationship between companies, institutional clients, and Wall Street is the root cause of the ongoing problems within the financial system. It is a closed loop portrayed as a fair and functional system; however, it has become a “money grab” that has corrupted the system and the regulatory agencies that are supposed to oversee it.
So What Can You Do About It
Why am I telling you this? To be a better long-term investor, you must understand the game you are playing and where you get your information.
Wall Street is incentivized to keep you invested, as that is how they make money. There is nothing wrong with that as long as you understand the game. However, what is essential to know is that these analysts are often mistaken in their assumptions, and they revise those assumptions along the way. Therefore, the advice you acted on previously is no longer valid. Notably, while the analysts’ revised “estimates” will eventually be “correct,” it does little to offset the initial investment risk you took under previously wrong information.
Such is why having a very defined set of trading rules can help offset the risk of wrong information over time. These rules won’t offset all your investment risk, nor will they ensure absolute profitability in all scenarios. However, they provide a framework to mitigate the risk of a catastrophic outcome that permanently impairs your capital.
The Rules
- Cut losers short and let winners run. (Be a scale-up buyer.)
- Set goals and be actionable. (Without specific goals, trades become arbitrary.)
- Emotionally driven decisions void the investment process. (Buy high/sell low)
- Follow the trend. (80% of portfolio performance is determined by the long-term, monthly trend. While a “rising tide lifts all boats,” the opposite is also true.)
- Never let a “trading opportunity” turn into a long-term investment. (Refer to rule #1. All initial purchases are “trades” until your investment thesis is proved correct.)
- An investment discipline does not work if it is not followed.
- “Losing money” is part of the investment process. (If you are not prepared to take losses when they occur, you should not be investing.)
- The odds of success improve significantly when the technical price action confirms the fundamental analysis. (This applies to both bull and bear markets)
- Never, under any circumstances, add to a losing position. (“Only losers add to losers.” – Paul Tudor Jones)
- Markets are either “bullish” or “bearish.” During a “bull market,” be only long or neutral. During a “bear market,” be only neutral or short. (Bull and Bear markets are determined by their long-term trend.)
- When markets are trading at, or near, extremes do the opposite of the “herd.”
- Do more of what works and less of what doesn’t. (Traditional rebalancing takes money from winners and adds it to losers. Rebalance by reducing losers and adding to winners.)
- “Buy” and “Sell” signals are only useful if implemented. (Managing without a “buy/sell” discipline is designed to fail.)
- Strive to be a .700 “at bat” player. (No strategy works 100% of the time. Be consistent, control errors, and capitalize on opportunities to win.)
- Manage risk and volatility. (Control the variables that lead to mistakes to generate returns as a byproduct.)
How We Are Trading It
Trading rules will undoubtedly help you, but nothing will replace doing your homework and becoming an astute investor. I would suggest that if you don’t have the time, patience, or discipline, you find someone who does to do the work for you. It may cost you money initially, but it will likely save you much more over time.
In early October, we discussed why we were adding to positions that had become beaten up with the summer sell-off. Then, in mid-November, we discussed our “tax loss selling” in our “losers.” This aligns with our long-term trading rules and investment discipline outlined above. With portfolios mostly aligned to where we want them, with a slight overweight to cash, we are looking for a short-term correction to round out our holdings as we prepare for the end of 2023.
As noted in this week’s newsletter, we don’t know what 2024 holds. On Tuesday, we will discuss the range of valuation assumptions and price targets based on a recession, no recession, or multiple expansion scenarios. What we do know, heading into 2024, anything is possible. Will the Fed cut rates, or won’t they? Will we have a recession or not? We, nor does anyone else, know with certainty what next year brings. However, I assure you that listening to Wall Street analysts making predictions will likely leave you wishing you hadn’t.
The market will tell you what you need to know. You have to be willing to listen.

Have a great week.
Research Report
Subscribe To “Before The Bell” For Daily Trading Updates
We have set up a separate channel JUST for our short daily market updates. Please subscribe to THIS CHANNEL to receive daily notifications before the market opens.
Click Here And Then Click The SUBSCRIBE Button
Subscribe To Our YouTube Channel To Get Notified Of All Our Videos
Bull Bear Report Market Statistics & Screens

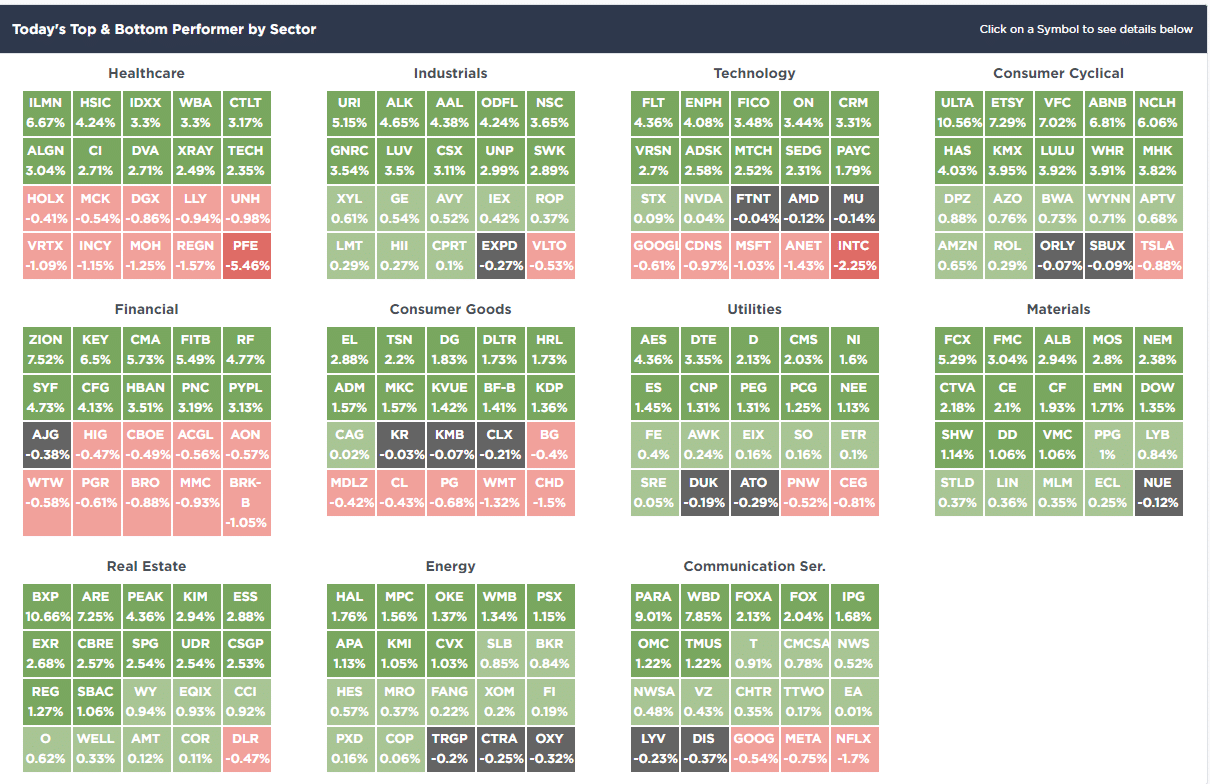
SimpleVisor Top & Bottom Performers By Sector
S&P 500 Weekly Tear Sheet

Relative Performance Analysis
Nothing changed last week regarding the more extreme short-term overbought conditions, except that the overbought conditions pushed higher. As noted below, every major sector and market is now pegged at the top of its range. The market will experience a short-term correction sooner rather than later to relieve extreme conditions. Such will provide a better entry point to add exposure. While the market can remain overbought longer than expected, extreme conditions rarely last long. Be patient. You will have a better opportunity to add exposure before the year-end rally concludes.

Technical Composite
The technical overbought/sold gauge comprises several price indicators (R.S.I., Williams %R, etc.), measured using “weekly” closing price data. Readings above “80” are considered overbought, and below “20” are oversold. The market peaks when those readings are 80 or above, suggesting prudent profit-taking and risk management. The best buying opportunities exist when those readings are 20 or below.
The current reading is 79.60 out of a possible 100.

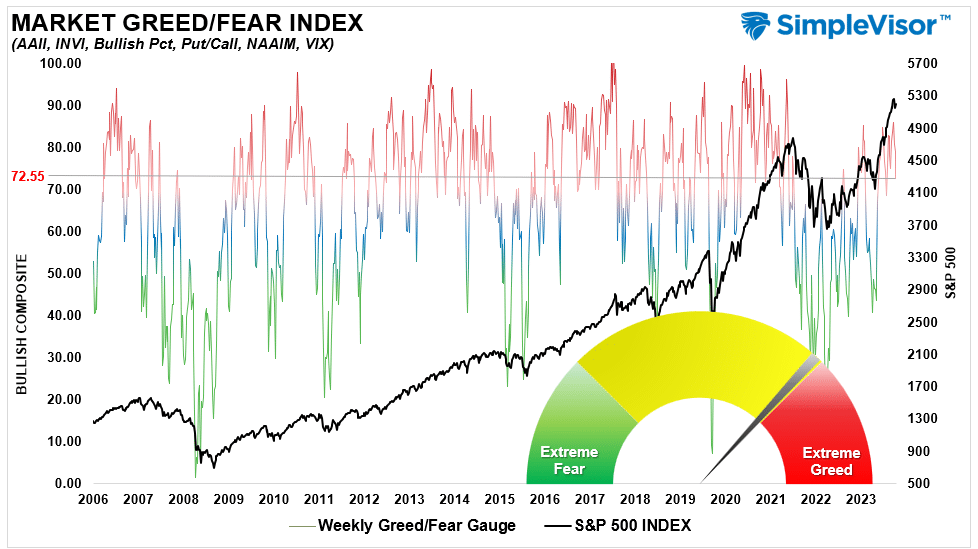
Portfolio Positioning “Fear / Greed” Gauge
The “Fear/Greed” gauge is how individual and professional investors are “positioning” themselves in the market based on their equity exposure. From a contrarian position, the higher the allocation to equities, the more likely the market is closer to a correction than not. The gauge uses weekly closing data.
NOTE: The Fear/Greed Index measures risk from 0 to 100. It is a rarity that it reaches levels above 90. The current reading is 77.05 out of a possible 100.
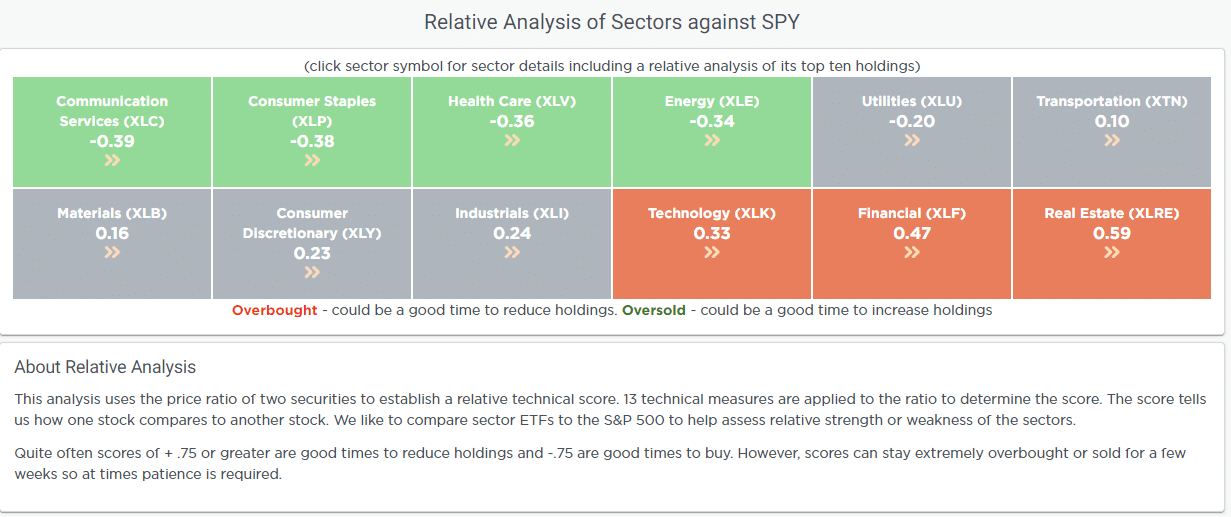
Relative Sector Analysis
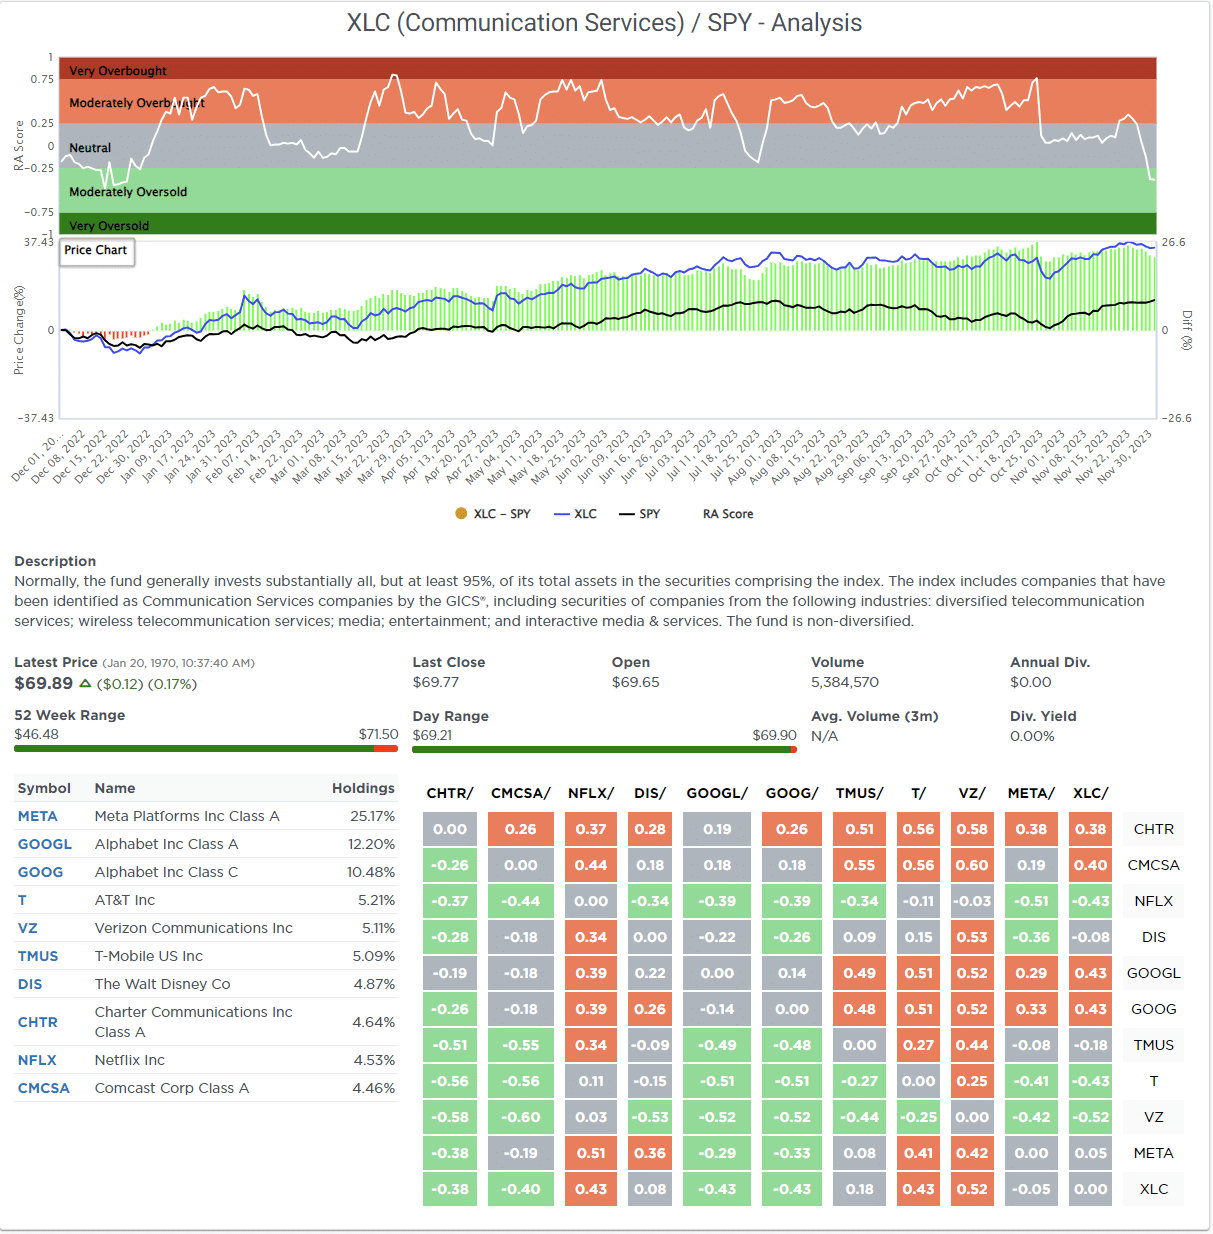
Most Oversold Sector Analysis
Sector Model Analysis & Risk Ranges
How To Read This Table
- The table compares the relative performance of each sector and market to the S&P 500 index.
- “MA XVER” (Moving Average Crossover) is determined by the short-term weekly moving average crossing positively or negatively with the long-term weekly moving average.
- The risk range is a function of the month-end closing price and the “beta” of the sector or market. (Ranges reset on the 1st of each month)
- The table shows the price deviation above and below the weekly moving averages.
As noted above in the Market Sector Relative Performance table, every major sector and market is currently overbought and outside normal monthly trading ranges. Such extremes are unsustainable, and a reversal will occur. The monthly risk range reports reset on the first day of each month; therefore, risk ranges will be visible next week. However, note that most sectors are deviated above short and/or long-term moving averages.

Weekly SimpleVisor Stock Screens
We provide three stock screens each week from SimpleVisor.
This week, we are searching for the Top 20:
- Relative Strength Stocks
- Momentum Stocks
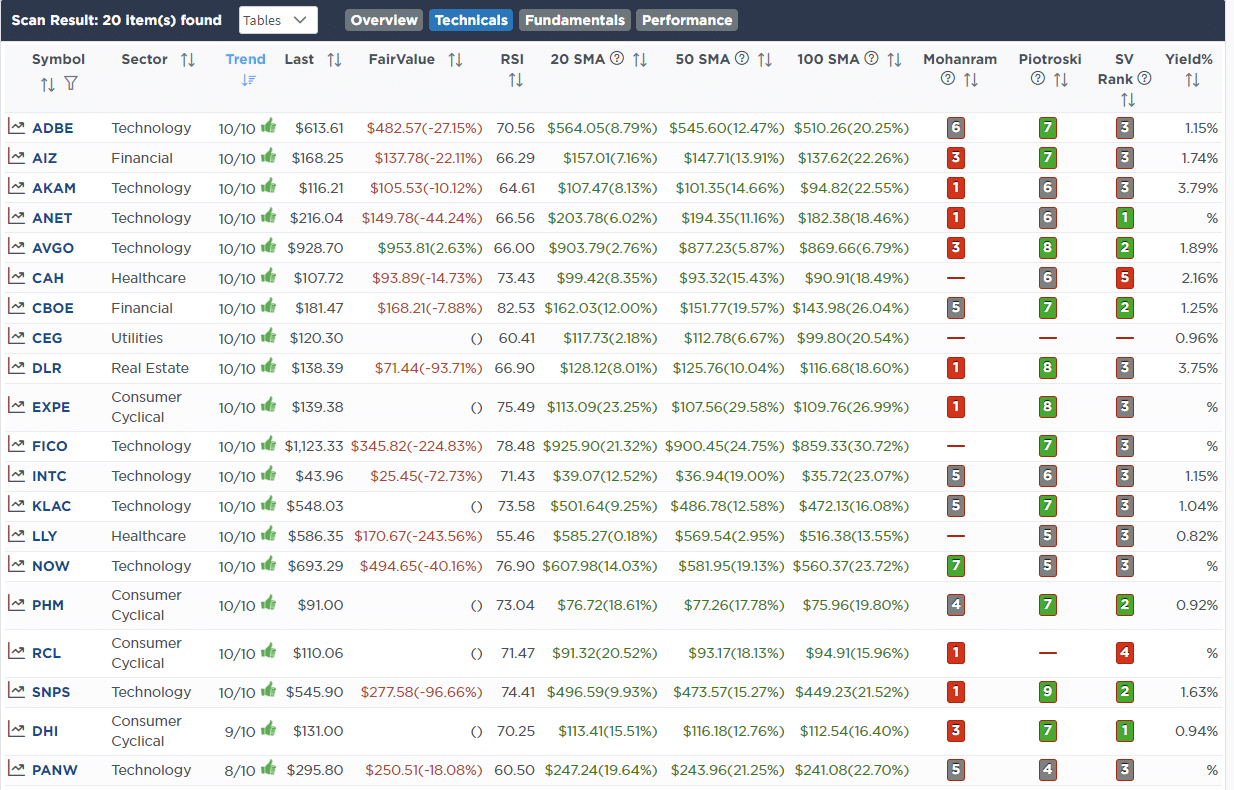
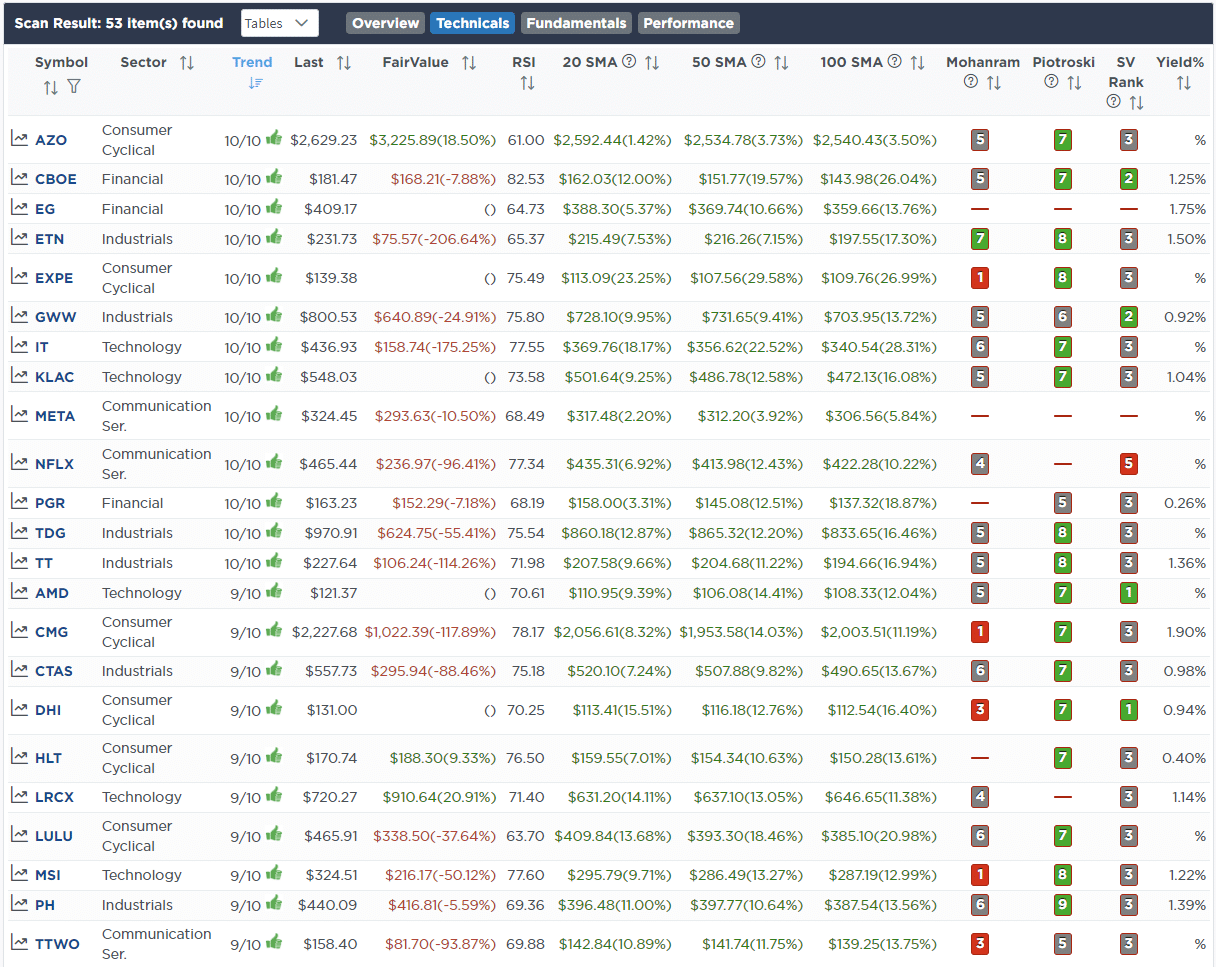
- Fundamental & Technical Strength
(Click Images To Enlarge)
R.S.I. Screen
Momentum Screen

Fundamental & Technical Strength
SimpleVisor Portfolio Changes
We post all of our portfolio changes as they occur at SimpleVisor:
No Trades This Week

Lance Roberts, C.I.O.
Have a great week!

