The New Bull Bear Report Brought To You By SimpleVisor


Welcome to our new weekly “Bull Bear Report.” We will bring you only the most essential things you need to know about the markets, what’s driving them, and how we are currently positioning our portfolios. The goal is to bring you a condensed, investment-focused analysis to help you manage your portfolio better.
Each week, we will bring you different analysis from the SimpleVisor.com platform as well as original research from RIA Investment team.
We would appreciate any feedback you have or what additions you would like to see in the Bull Bear Report; email me here.
Inside The Bull Bear Report
- Market Trading Update
- Portfolio Positioning
- Weekly Market Recap
- Stock Of The Week
- Interesting Datapoint
- Market Statistics
- Stock Screens
- Portfolio Trades This Week
Market Update – The Trading Week In Review
As noted last week:
“The market finally gained a decent rally. The break above the 50-dma and the declining trend channel gave the bulls the signal to jump back into stocks. While much of the rally was short-covering, the market did push into the upper resistance of the longer-term downtrend channel.”
We also suggested the market needed to pull back and successfully retest the 50-dma, which would turn that previous resistance into support. That retest occurred on Tuesday in anticipation of the FOMC meeting. On Wednesday, stocks surged higher, with the Nasdaq higher by over 4% as the Fed hiked interest rates by 0.75% as expected. However, the statement that the Fed would manage rates on a meeting-by-meeting basis sent stocks screaming higher.
*POWELL: PACE OF RATE HIKES TO DEPEND ON INCOMING DATA
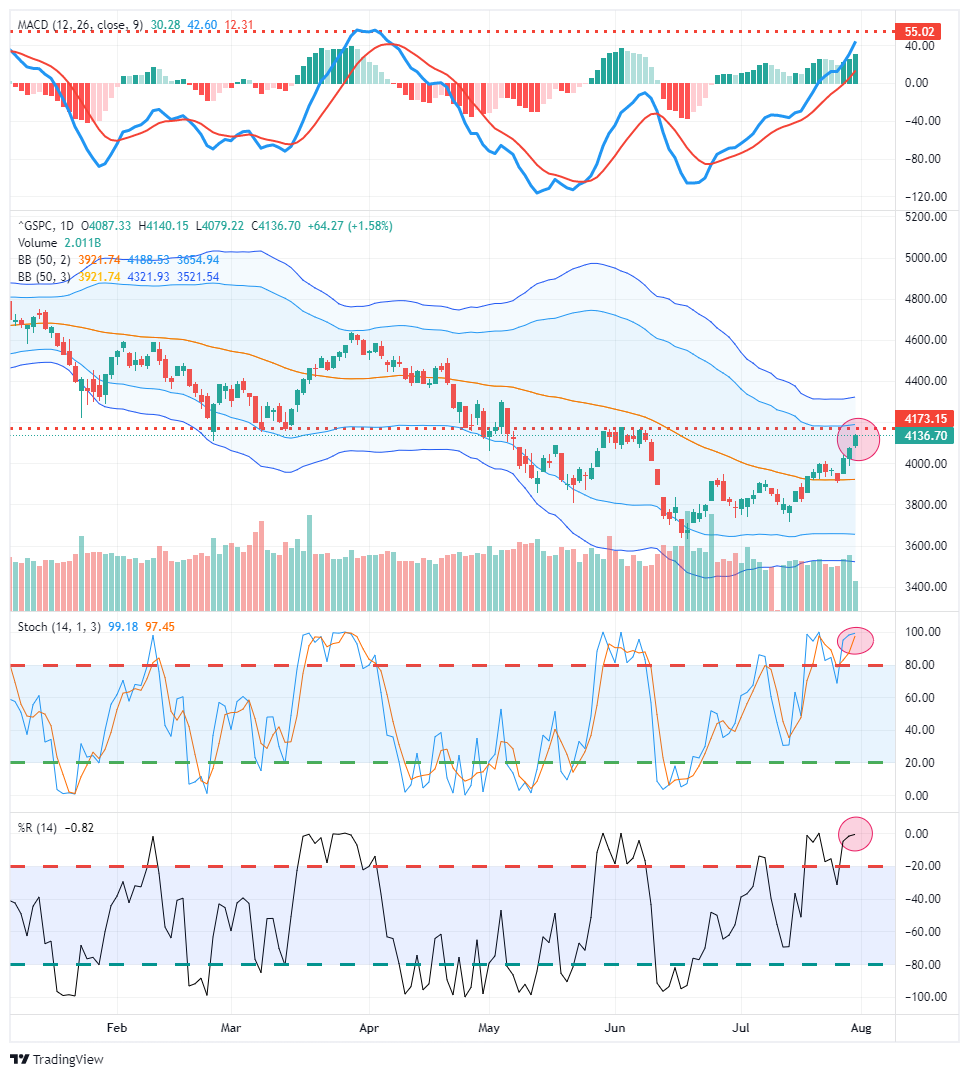
As of Friday’s close, the market is now on track for the best month since 2020. However, short-term markets are now extremely overbought and pushing up into very tough resistance. A pullback and some profit-taking next week will not be surprising.
The Bullish Call Is Made
As we have discussed over the last several days in our Daily Market Commentary, the bulls remain in charge as earnings from companies like MSFT, GOOG, AMZN, and AAPL, have been “less bad than expected.” Such has finally lifted the hopes of beaten down investors as the negative sentiment starts to reverse. As noted previously, for a strong “counter-trend” rally in a bear market we need Jim Cramer to pronounce its “time to buy.”
“When the Fed gets out of the way, you have a real window and you’ve got to jump through it. … When a recession comes, the Fed has the good sense to stop raising rates,” the “Mad Money” host said. “And that pause means you’ve got to buy stocks.”
That is incorrect. When the Fed pauses, historically, the recession is beginning, not ending.
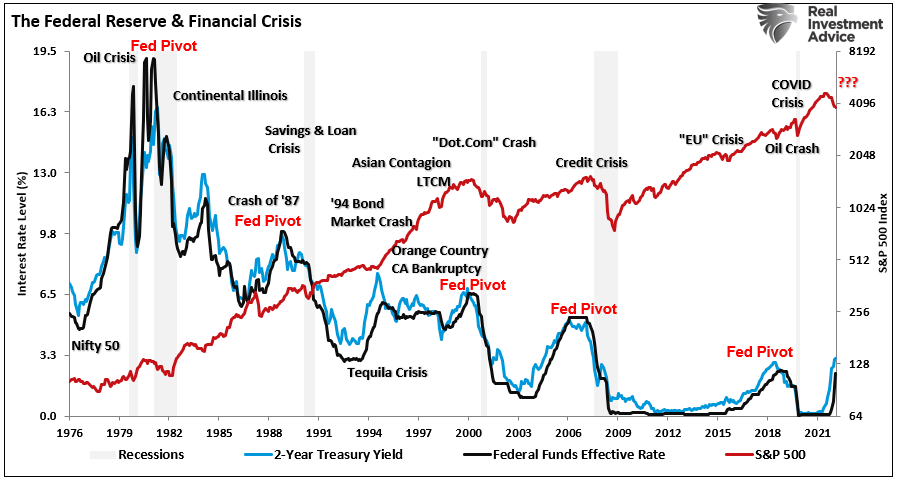
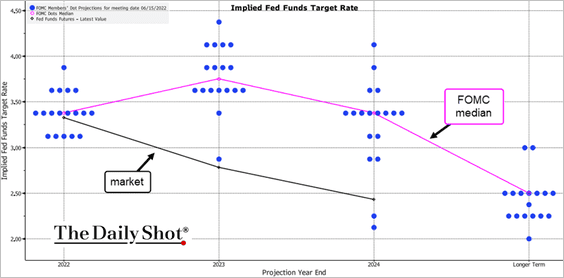
Interestingly, the market is now “Fighting The Fed,” hoping that Powell will halt rate hikes and begin to lower them despite the Fed’s dot plot, which suggests otherwise.
While it may seem illogical that stocks are rallying while the Fed is hiking rates, we have noted that sentiment had become so negative that it was a “bullish” indicator. With a large majority of retail investors and investment managers “offsides,” the “pain trade” is higher for now.
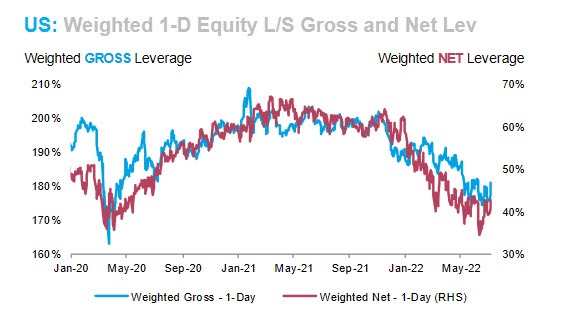
The most significant risk to the bears is that asset managers are terrified of “career risk.” While many active managers have outperformed year-to-date by choosing to be underweight equities, a failure to rotate successfully back into long exposure could lead to full-year underperformance. That pressure to perform relative to their selective benchmark could force managers to chase stocks higher near term.
“A,” Not “The,” Bottom Is In
Yes, I think stocks have hit “A” bottom near term. However, it is not likely “THE” bottom. The reason is that while the market is rallying because of the potential for a Fed pause, as noted above, history suggests stocks haven’t hit “THE” bottom.
Currently, markets are rallying in hopes the Fed will revert to its zero interest rate policy and quantitative easing. However, such is not likely the case as inflation is still running at the highest level in 40 years. While inflation will likely peak in the next couple of months, the decline will be slow initially. Such will likely keep the Federal Reserve focused on quelling inflation by slowing economic growth through higher rates.
Furthermore, the Fed is unlikely to reverse its balance sheet reduction program, particularly with both the stock and bond markets showing little signs of financial stress. The Fed is okay with declining asset prices, they are not okay with financial instability. As such, there is currently little reason for the Fed to reverse course from its inflation-fighting focus.
From an investing perspective, the counter-trend bull rally is on, and the bottom is in for now. However, when most people realize this, the rally will be over, and it will be time to take profits. The reality is that even though Jerome Powell acknowledged economic weakness, given the lag in the data, it will be too late by the time the Fed pivots. Just as it has been every time previously.
As Justin Lahart concluded in a recent WSJ article:
“That portends an environment where at least some Fed officials might become warier of tightening. It is one thing to raise rates when people curse at the gas pump and see for-hire sings everywhere. It is another when that is no longer the case.”
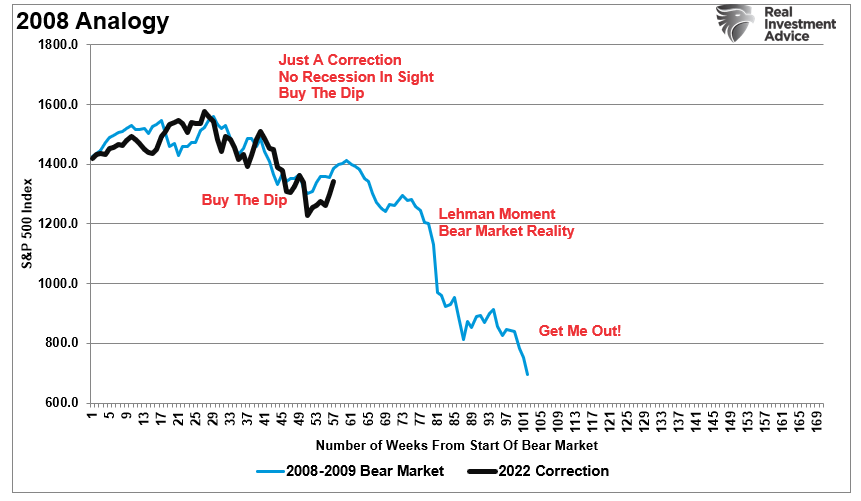
We will likely work through the rest of our 2008 analog when that happens.
Not Getting The Bull Bear Report Each Week In Your Mailbox? Subscribe Here For Free.
Need Help With Your Investing Strategy?
Are you looking for complete financial, insurance, and estate planning? Need a risk-managed portfolio management strategy to grow and protect your savings? Whatever your needs are, we are here to help.

Portfolio Update
As I stated last week, the current market environment remains very challenging. The “bull vs. bear” case is unclear, and both sides have valid arguments. Such makes navigating the current market environment extremely challenging with no clear path.
We remain cautious but are taking on some additional equity exposure this week. As noted previously, we have remained on the lookout for companies that report earnings and their stock price rises. Such would suggest a majority of the “bad news” is accounted for. We saw that specifically this past week with Apple (AAPL), Microsoft (MSFT), Amazon (AMZN) and Alphabet (GOOG), missing estimates but rallying sharply. Such is why we added to those positions.
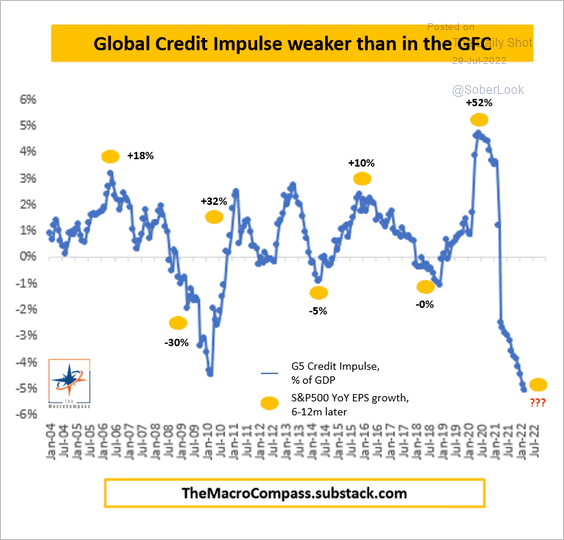
For all the reasons stated, the risk is the current rally will be fleeting as economic realities continue to impact earnings growth. An earnings recession, a consequence of an economic recession, would drag asset prices lower as multiples are revalued. Such is particularly the case given the sharp decline in global liquidity is high correlated to earnings growth.
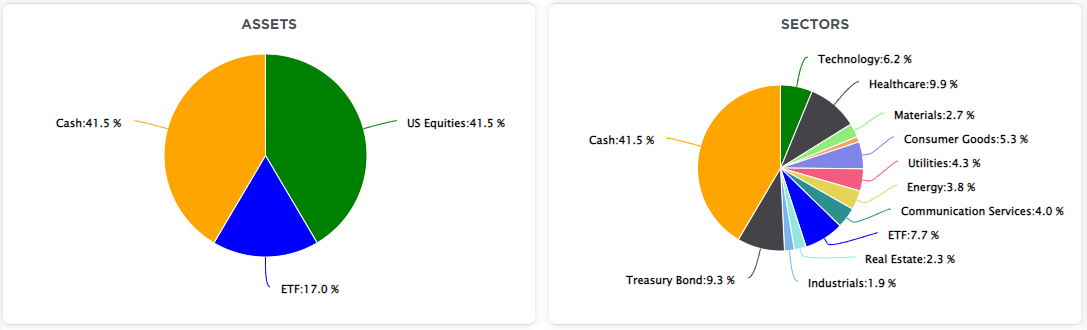
While we did add a small bit of exposure last week in our Technology holdings to participate with this rally, we remain cautious with a substantial holding in cash. Fixed income also continue to play a role in hedging risk longer term.
Remain cautious for now and continue following the rules from last week.
- Tighten stop-loss levels to where you are comfortable selling if markets reverse again.
- Hedge portfolios against significant market declines. (swap equity funds for money market, stable value, or bond funds.)
- Take profits in positions that have been big winners (Rebalance funds above their standard weightings for your portfolio. Same with Company stock in your plan.)
- Sell laggards and losers.
- Raise cash and rebalance portfolios to target weightings. (Rebalancing risk regularly keeps hidden risks somewhat mitigated.)
Weekly Market Recap With Adam Taggart
Stock Of The Week In Review
In the Bull Bear Report we will post one of the stocks from the research we do at SimpleVisor to find stocks worth taking a deeper look into. The 5-For-Friday report is published each week in full for SimpleVisor.com subscribers.
This week we present five stocks with a large margin of safety. They are all priced at dirt cheap valuations despite having exceptional growth expectations. You will probably not recognize the five companies as they are small and not well followed. Further, their inclusion in ETFs is likely minimal. This limited exposure to passive investors makes finding such deep value possible.
Screening Criteria
- PEG < 1
- P/E < 10
- Forward P/E < 10
- P/S < 1
- P/B < 2
- 5 Year Expected EPS Growth > 30%
Let’s take a look at one of them. (Click image to enlarge)
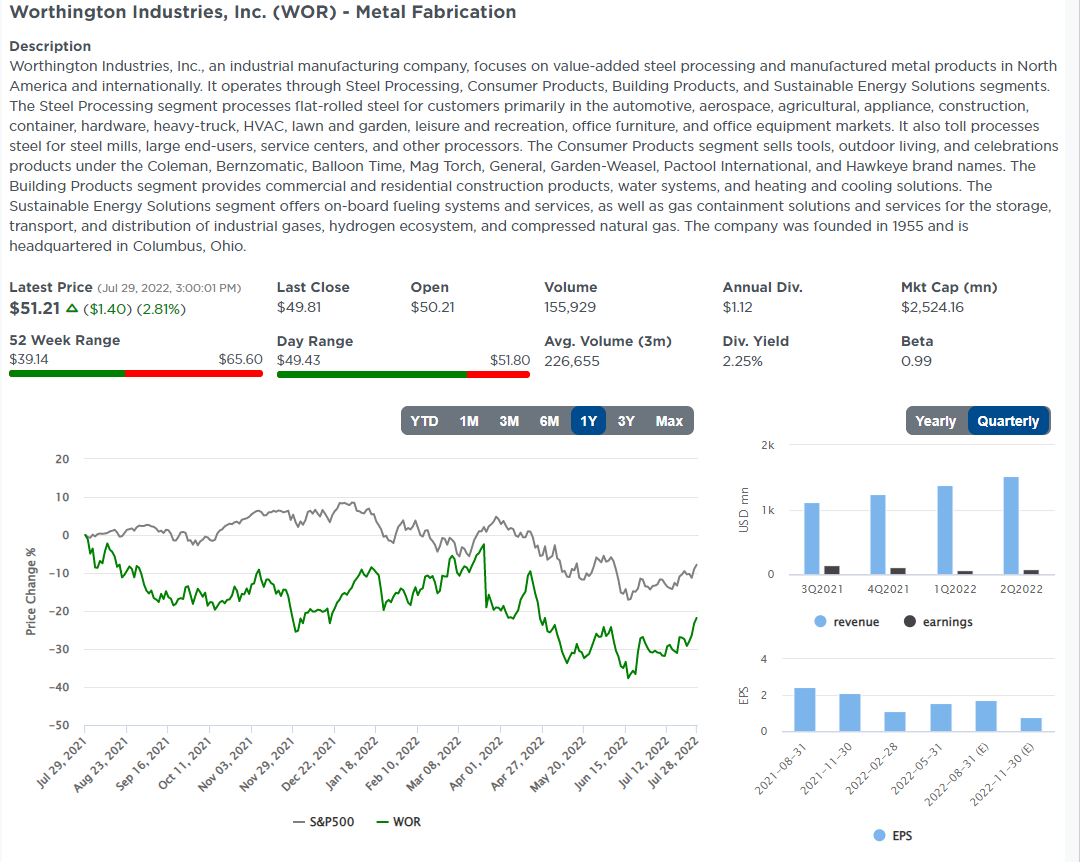
Login to Simplevisor.com to read the full 5-For-Friday report.
Daily Commentary Bits
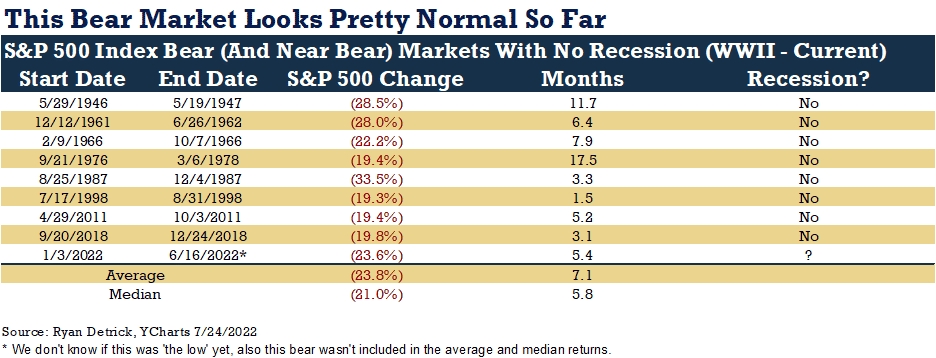
Ryan Detrick at Y-Charts helps us understand why investors should care whether or not the economy is in recession. His table compares the current bear market to the eight bear markets since 1946 that weren’t accompanied by a recession. Per the data, the current bear may be close to hibernating if the economy does not slip into a recession. The S&P 500, at its mid-June low, was down 23.6%. The eight times we had a bear market without a recession, the bear market troughed at -23.8%. Also, the current bear market is almost seven months old. Per Detrick, the average is 7.1 months. This bear market is very average and may be close to over, assuming a recession is not on the horizon.
Click Here To Read The Latest Daily Market Commentary (Subscribe For Pre-Market Email)
Bull Bear Report Market Statistics & Screens
SimpleVisor Sentiment Index
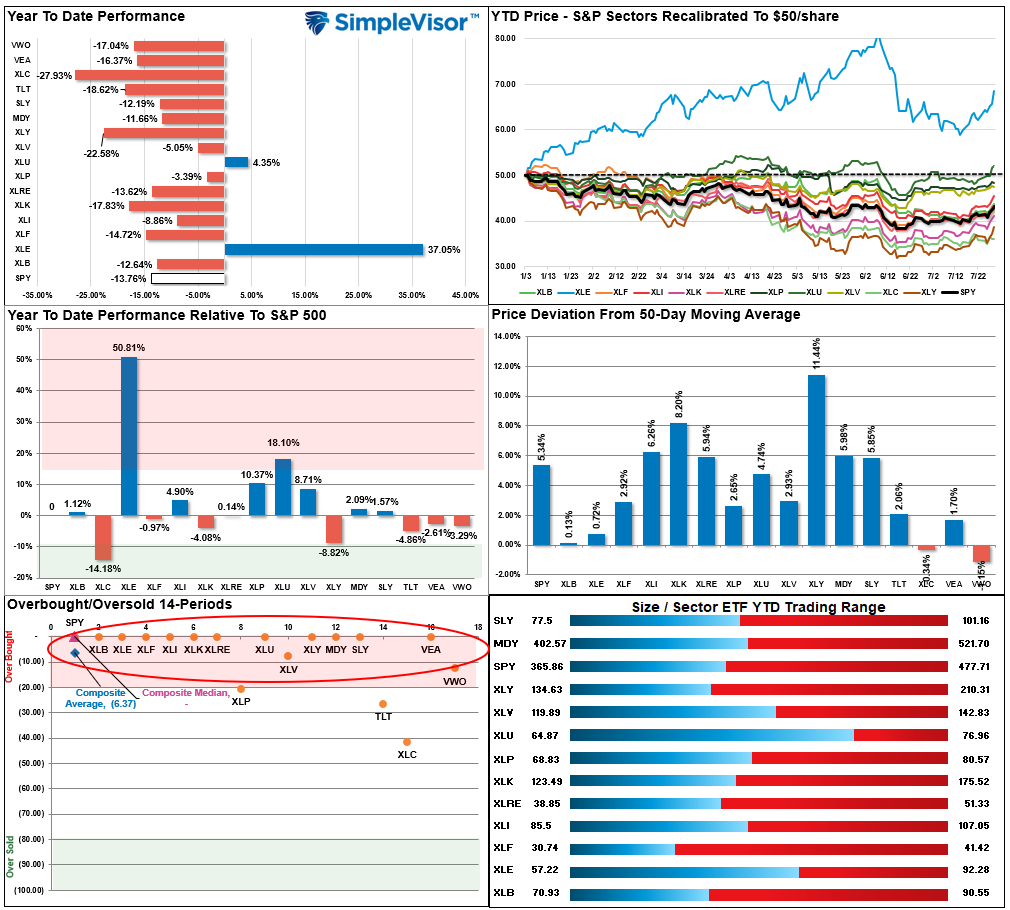
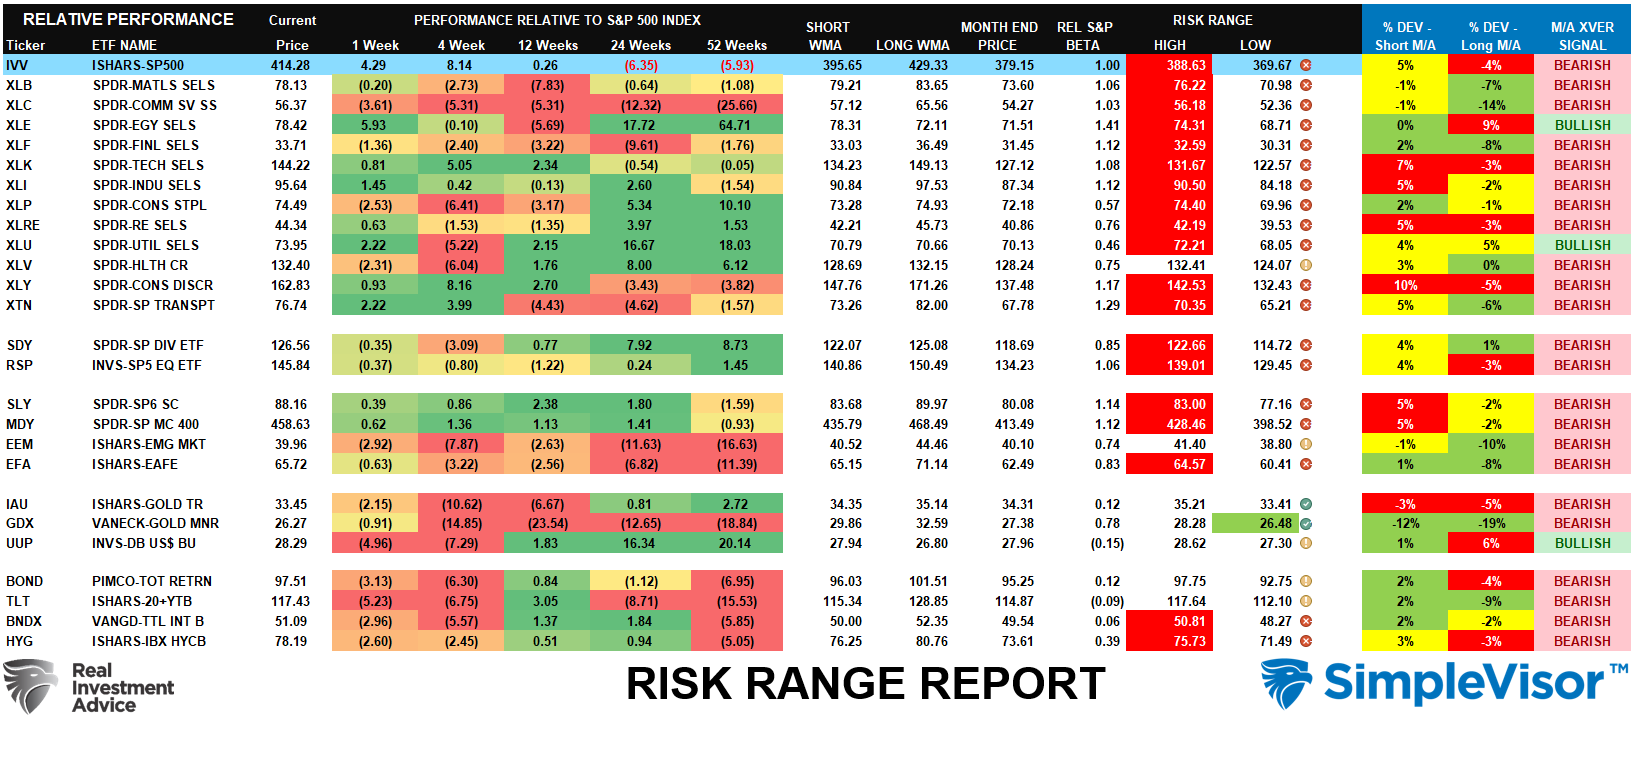
Relative Performance Analysis
As shown in the lower left panel, almost every major sector and market is back to extreme overbought. While the majority have regained their respective 50-dmas, only Energy and Utilities have a positive return year-to-date. Energy, Technology, Real Estate, Industrials, Mid-Cap and Small-Cap are pushing more extreme deviations from their 50-dmas. Profit taking is likely in the next week to reduce some of that overbought condition.
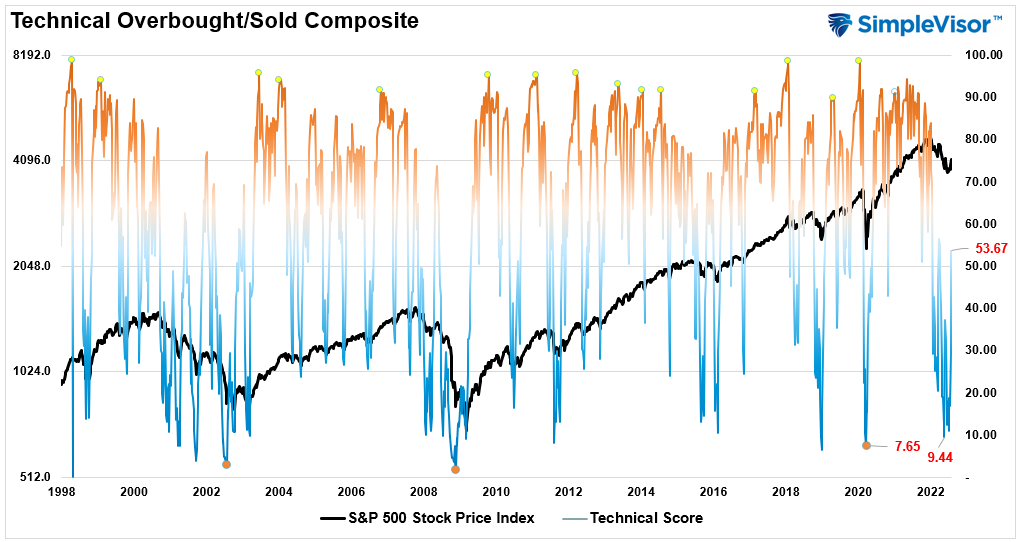
Technical Composite
The technical overbought/sold gauge comprises several price indicators (RSI, Williams %R, etc.), measured using “weekly” closing price data. Readings above “80” are considered overbought, and below “20” are oversold. The current reading is 53.67 out of a possible 100.
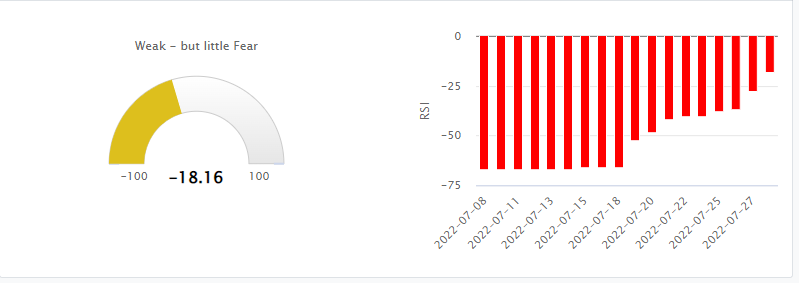
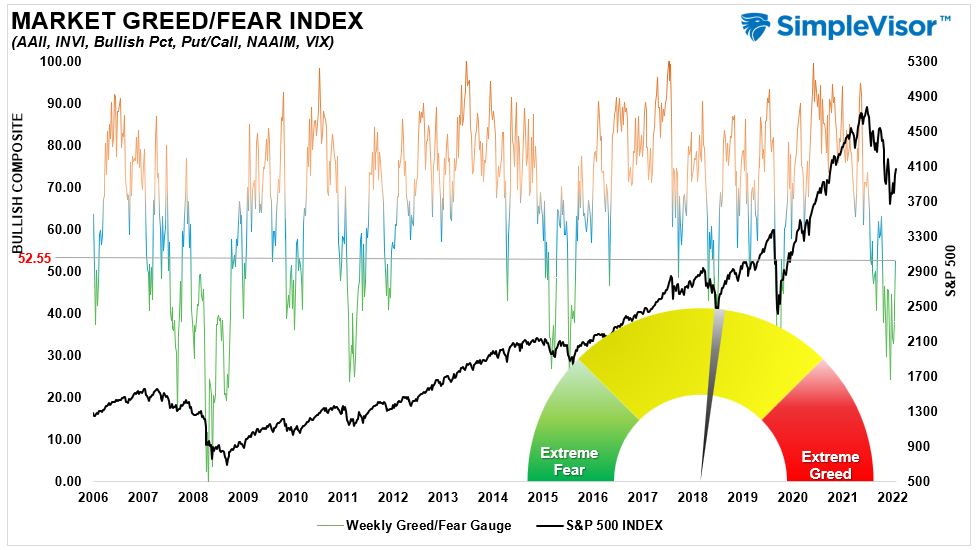
Portfolio Positioning “Fear / Greed” Gauge
The “Fear/Greed” gauge is how individual and professional investors are “positioning” themselves in the market based on their equity exposure. From a contrarian position, the higher the allocation to equities, to more likely the market is closer to a correction than not. The gauge uses weekly closing data.
NOTE: The Fear/Greed Index measures risk from 0 to 100. It is a rarity that it reaches levels above 90. The current reading is 52.55 out of a possible 100.
Sector Model Analysis & Risk Ranges
How To Read This Table
- The table compares the relative performance of each sector and market to the S&P 500 index.
- “M/A XVER” is determined by whether the short-term weekly moving average crosses positively or negatively with the long-term weekly moving average.
- The risk range is a function of the month-end closing price and the “beta” of the sector or market. (Ranges reset on the 1st of each month)
- The table shows the price deviation above and below the weekly moving averages.
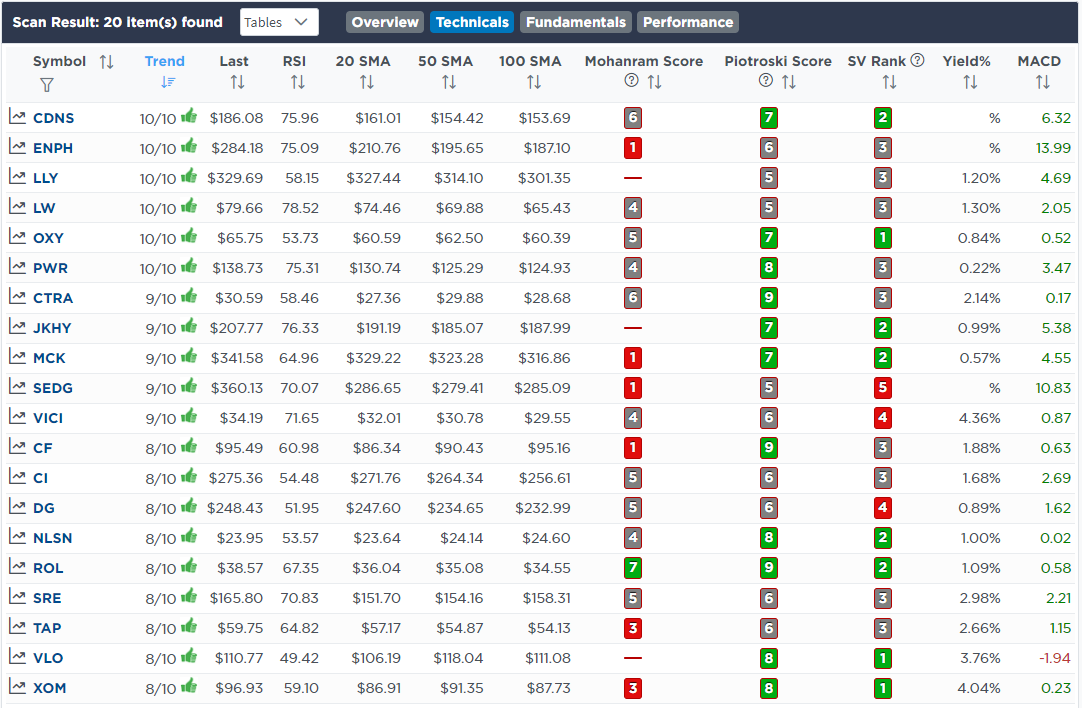
Weekly Stock Screens
Each week we will provide three different stock screens generated from SimpleVisor: (RIAPro.net subscribers use your current credentials to log in.)
This week we are scanning for the Top 20:
- Relative Strength Stocks
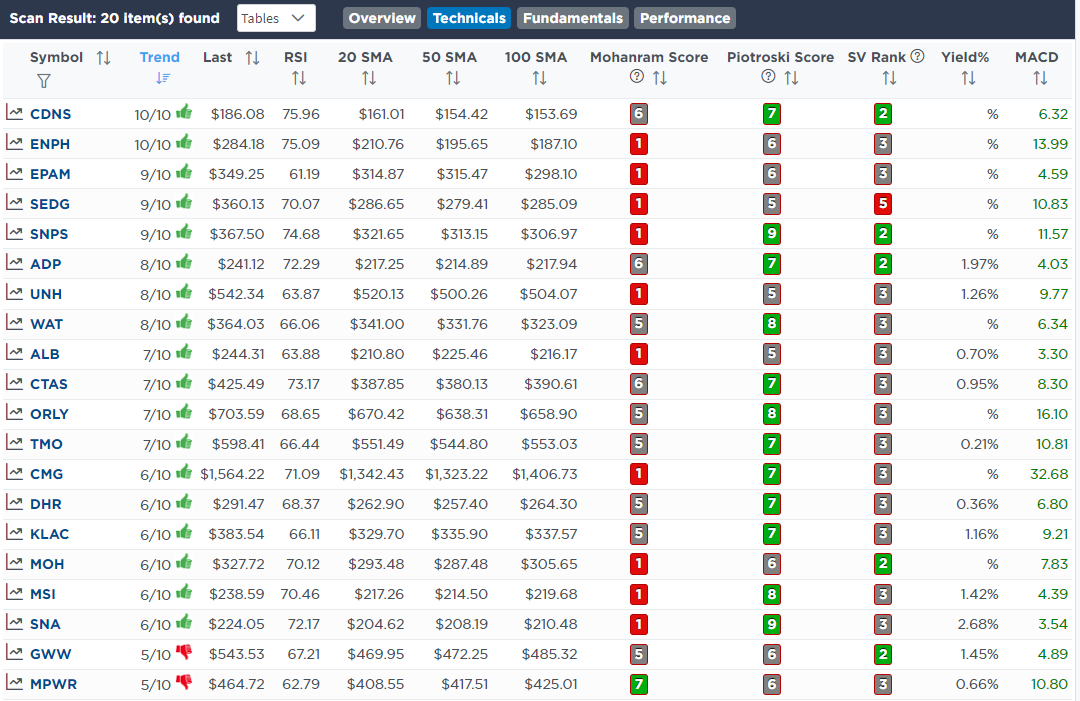
- Momentum Stocks
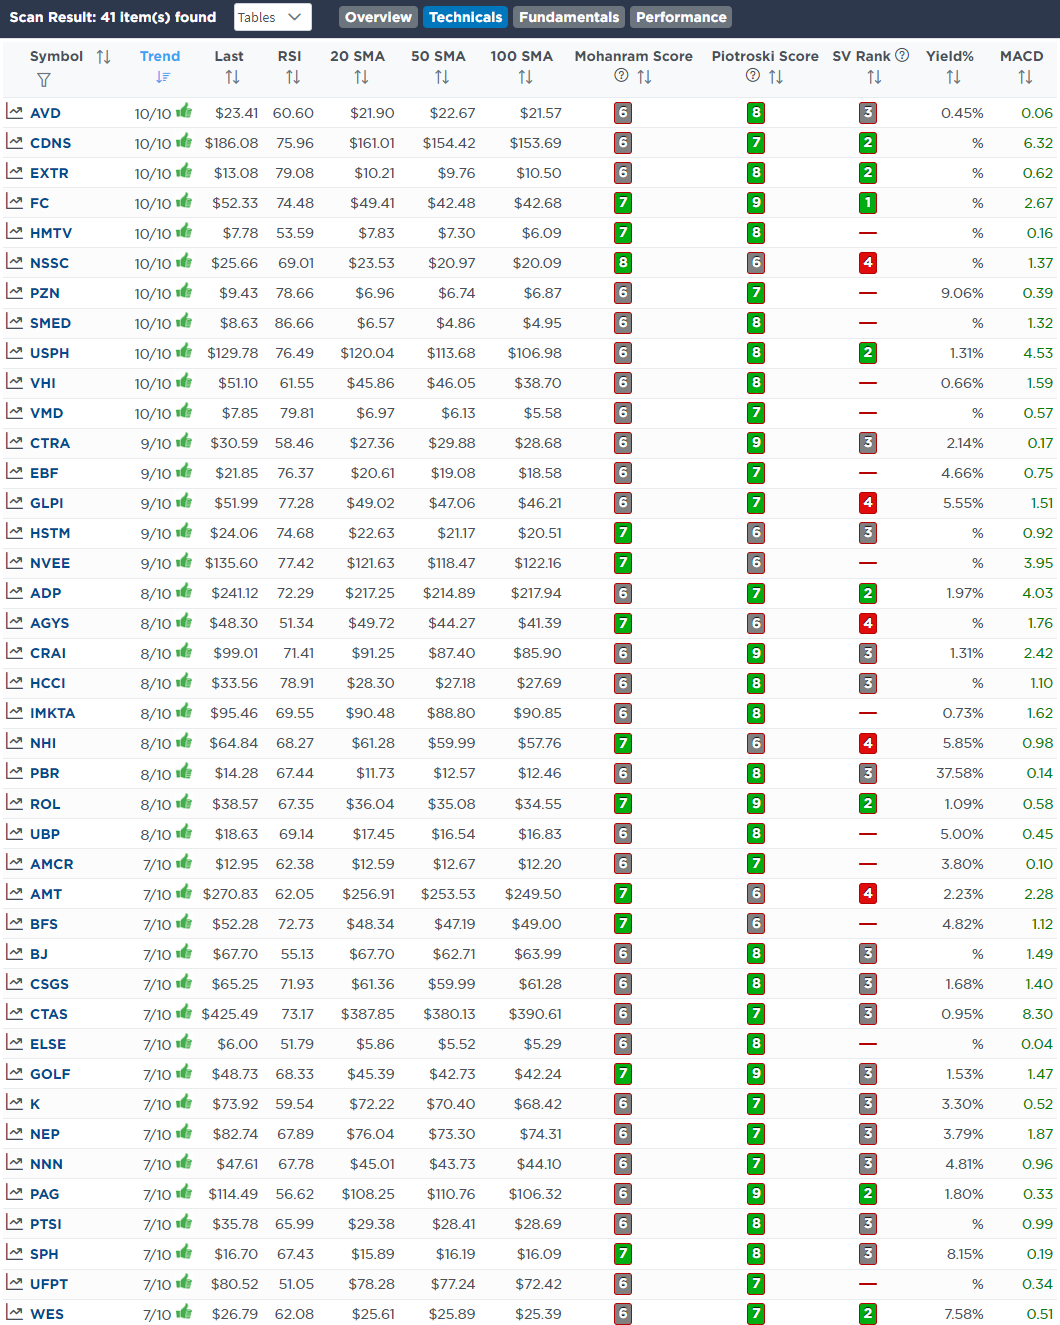
- Technically Strong With Strong Fundamentals
These screens generate portfolio ideas and serve as the starting point for further research.
(Click Images To Enlarge)
RSI Screen
Momentum Screen
Technical & Fundamental Strength Screen
SimpleVisor Portfolio Changes
We post all of our portfolio changes as they occur at SimpleVisor:
July 28th
“Following yesterday’s Fed meeting, stocks continue to show more resilience to weak economic news and earnings. Such increases our confidence that a tradable low is in place. Whether it’s the market bottom for the cycle or just a bounce is the big question. The 50- day moving average and other lines of support will help us manage risk if the bounce fails. Despite the purchases, we maintain high levels of cash as we are skeptical the Fed will pivot as soon as many investors expect.
With bond yields falling and investors growing more comfortable that the Fed will temper inflation, the market is showing a preference for growth/tech stocks.”
Equity Model:
- Add .50% To AAPL
- Initiate A .50% In NVDA
- Initiate A .50% In AMD
- Buy A 1.00% Position In AMZN
- Add .50% To MSFT
- Add .50% To GOOG
Sector Model:
- Buy 1.5% XLK

Lance Roberts, CIO
Have a great week!


