Inflation Peaks. Will Markets Finally Stabilize?


In this 05-13-22 issue of “Inflation peaks. Will Markets Finally Stabilize?”
- Inflation Peaks
- It’s So Bearish It’s Bullish
- Portfolio Positioning
- Sector & Market Analysis
Follow Us On: Twitter, Facebook, Linked-In, Sound Cloud, Seeking Alpha
Need Help With Your Investing Strategy?
Are you looking for complete financial, insurance, and estate planning? Need a risk-managed portfolio management strategy to grow and protect your savings? Whatever your needs are, we are here to help.
Schedule your “FREE” portfolio review today.

Weekly Market Recap With Adam Taggart
Market Review & Update
On Wednesday, Emily McCormick from Yahoo wrote a great piece encapsulating current market conditions:
“As volatility grips markets, investors are naturally wondering when the selling will abate and the bottom will be put in.
According to a number of pundits, the answer is probably not quite yet.
Stocks have fallen sharply for the year-to-date and in the past several weeks especially. The S&P 500 has tumbled 16% so far in 2022, and by a slightly more pronounced 16.6% from its recent record closing high from January 3. The tech-heavy Nasdaq Composite has performed even more poorly, sinking 25% for the year-to-date and by about 27% from its recent record high on Nov. 19, 2021. But even after these double-digit losses, stocks may still have further to decline before bottoming.
According to Bank of America, bear markets have lasted an average of 289 days with an average price decline of 37.3%, based on data from 19 bear markets that have taken place over the past 140 years.“
Are we near the bottom? That is the question we will explore this week. However, the market is as oversold, deviated, and negatively biased from a technical viewpoint since both the 2018 and 2020 lows.
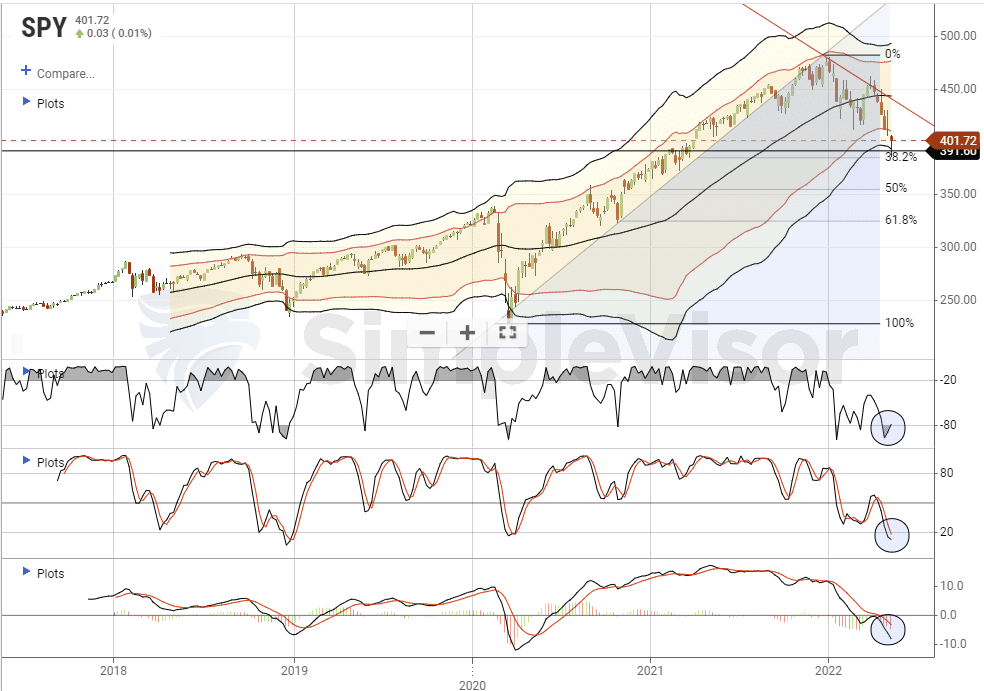
With the market pushing 3-standard deviations below the 1-year moving average, and all technical indicators testing weekly lows, such is historically consistent with reflexive rallies. While such was what we said last week, the selling pressure continued this week as investors panicked over the latest inflation print.
However, as noted, we have most likely seen the inflation peak for now.
Inflation Peaks
On Wednesday, we saw the latest Consumer Price Index data for April. While the market was surprised by a “hotter than expected” number, such should not have been the case. While we expected an inline to softer print, the higher number was not surprising:
- Energy, food, and other input costs have remained high.
- While April was the first annual comparison of a higher inflation print, the comp was still very low. Over the next few months, that comparison will become more challenging, which should align with an inflation peak.
- Lastly, there is a lag in some data inputs, making month-to-month changes hard to predict. However, over the next few months, the data will smooth out.
With that said, the graphic below shows the breakdown of the recent inflation report.
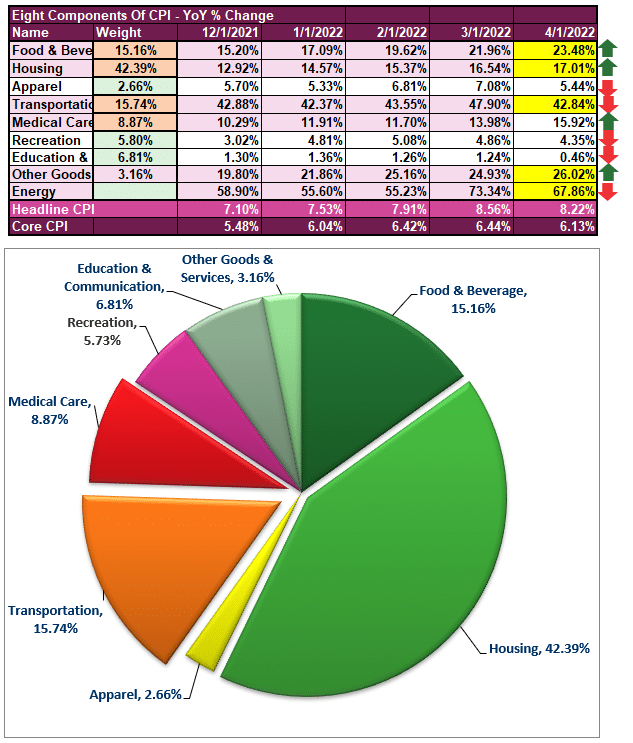
There are a couple of interesting takeaways from the data on inflation. Food, Housing, Medical Care, and Other Goods were higher for this month versus last month. Apparel, Transportation, Recreation, Education, and Energy were lower. Despite all of the headlines about high oil and gas prices, it was interesting to note the drop in energy.
Notably, as the graph below shows, the monthly rate of change in inflation dropped sharply. In March, the monthly change was 1.24%. That rate of change dropped to 0.33% in April. What this suggests is that the inflation peak is here. To evidence that, we will assume that inflation continues to increase by 0.3% each month through 2022.
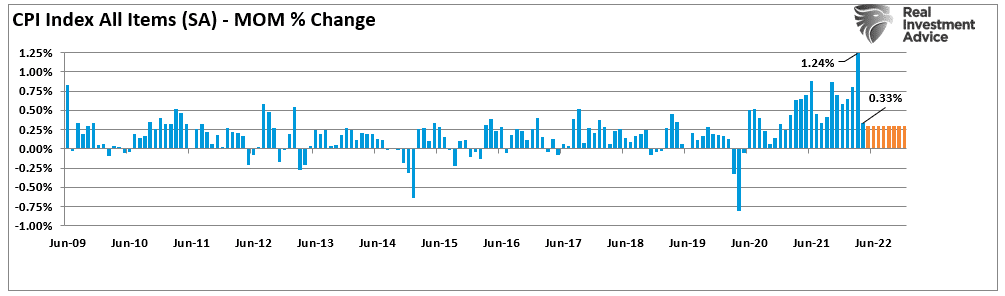
If that is the case, the current annual inflation rate will fall from 8.2% in April to 5.55% in December. The inflation peak is evident even given our more lofty assumptions on inflation over the rest of this year.
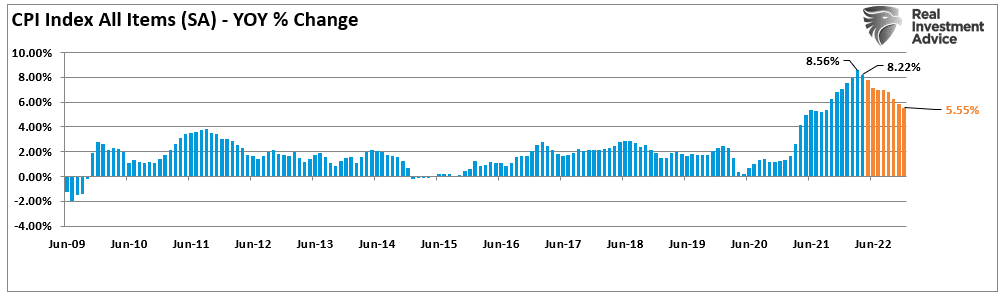
An inflation peak could be supportive of financial assets.

It’s So Bearish; It’s Bullish
An inflation peak could be bullish for financial assets because investors have been panicking about inflation for months. Currently, stocks are down 16% or more, depending on the index, and bonds are in the most significant drawdown since the 18th century.
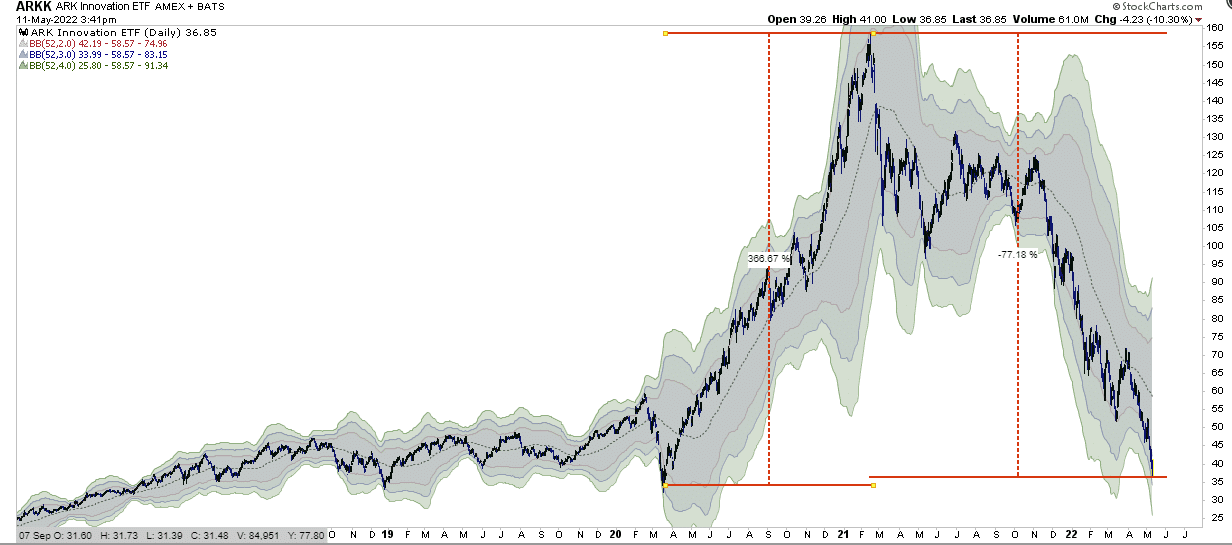
Notably, growth stocks remain under tremendous pressure as higher inflation and rates led to a severe repricing of risk. The “meme” stocks that led the liquidity-fueled feeding-frenzy following the pandemic are most notable. The proxy, or should I say poster-child, for these companies remains the ARKK Innovation Fund (ARKK).
This chart is also an excellent example of why you should ignore charts showing percentage returns. ARKK rose 367% from the March 2020 lows to its peak in 2021. However, the 77% decline wiped out virtually all of those gains. While ARKK’s investing premise was flawed, there are companies in the fund that will survive. The question is, which ones?
But this example is symbolic of the market as a whole. As I noted last week, sentiment and positioning by both retail and professional investors have become so “bearish it’s bullish.”
“As SoFi’s Liz Young points out, as of Tuesday, only about 16% of Nasdaq Composite stocks were trading above their 200-day moving averages, or a key technical indicator of a stock’s price trends. That’s nearing the ultra-low percentages seen at the market bottoms over the past two decades, including in 2020 (about 6%), 2018 (9%) and 2009 (4%).” – Yahoo

More notably, the Fear/Greed gauges are pushing into extreme fear territory as retail investors dump stocks in sheer panic mode.

However, professional investors have sold also with the NAAIM index hitting bear market lows.
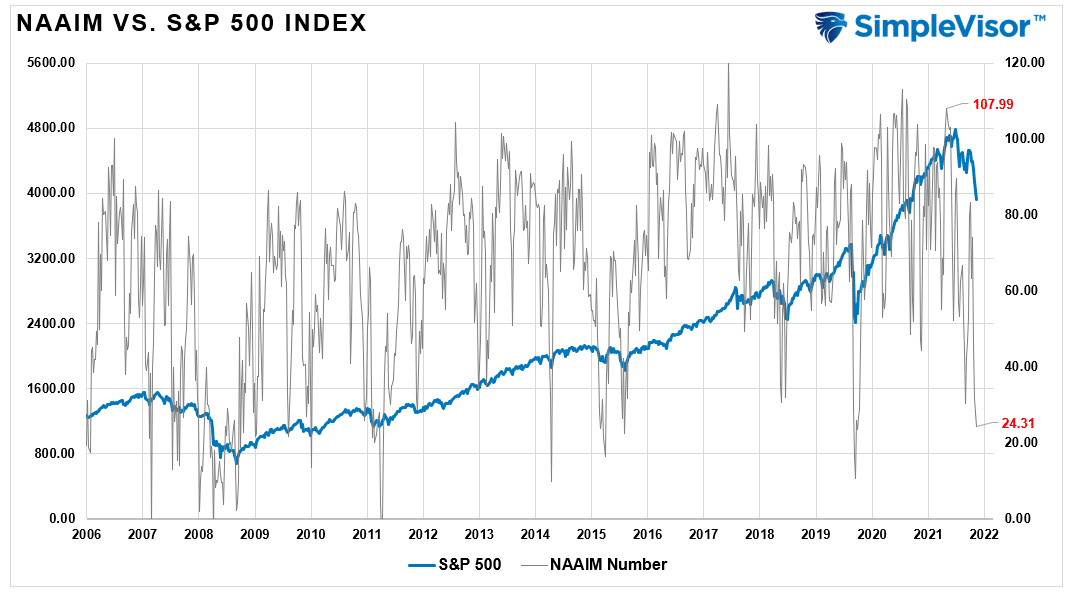
All this data suggests we should be close to a tradeable rally.
This Week’s MacroView

Is A Tradeable Rally Near? Maybe So.
As we discussed previously, being a contrarian is difficult.
“The things that terrify other people will probably terrify you too, but to be successful an investor has to be stalwart. After all, most of the time the world doesn’t end, and if you invest when everyone else thinks it will, you’re apt to get some bargains.‘” – Howard Marks
Such is because, during market declines, we don’t know where the bottom is. Specific indications suggest the market is oversold enough for a tradeable rally. As Sentiment Trader noted this week:
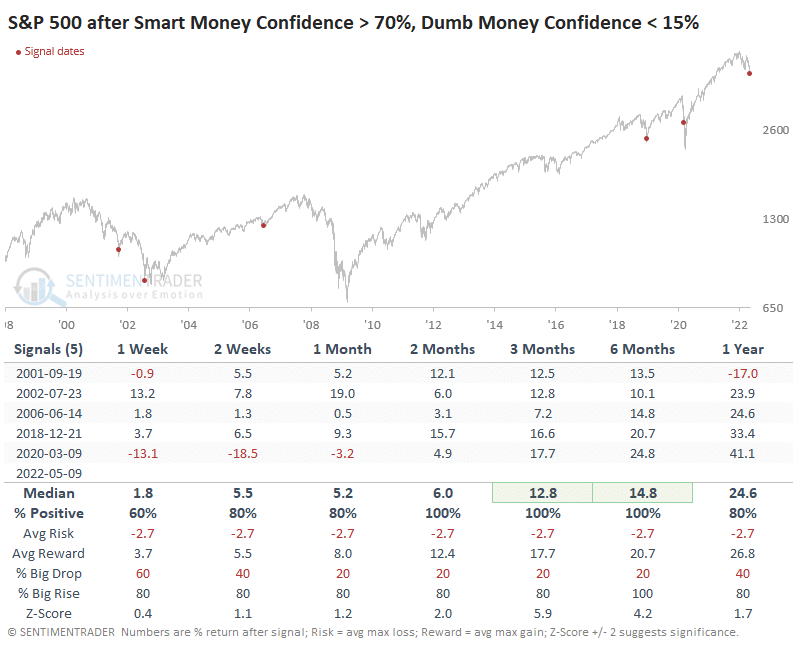
“The Dumb Money is panicking while the Smart Money is buying. For only the 11th time since we began calculating it in 1998, Dumb Money Confidence in a rally fell to only 12% on Monday. After all ten of the other readings, stocks rallied by double digits in the months ahead.
At the same time, Smart Money Confidence has climbed well above 70%.”
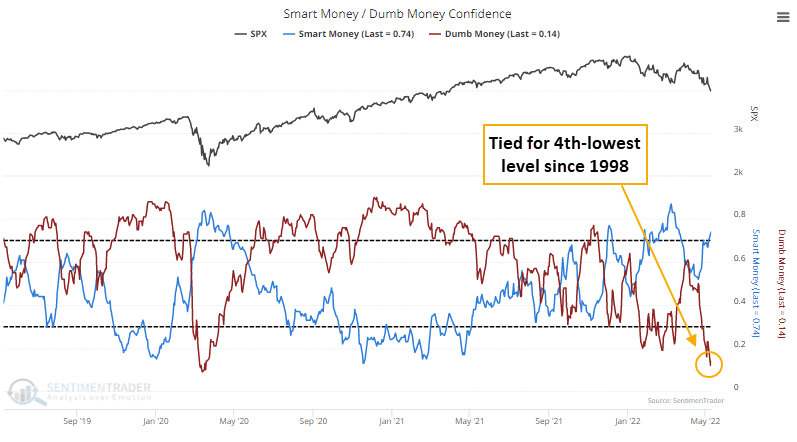
Here is the crucial point.
“For Dumb Money Confidence to get this low, there has to be widespread evidence of deep pessimism. And there is. There have only been a handful of times both indicators were at such opposite extremes simultaneously.” – Sentiment Trader
They are correct in noting the more extreme levels of pessimism.
- Selling is occurring across a broad swath of stocks.
- The majority of stocks in indices are getting pushed to new lows.
- Equity funds see outflows.
- Sentiment surveys are at levels seen during the depths of recessions; and,
- Traders make speculative bets on a market crash, and higher-risk markets get sold hard.
As they note, returns tend to be good over the next few weeks to months.
More Evidence Suggests The Same
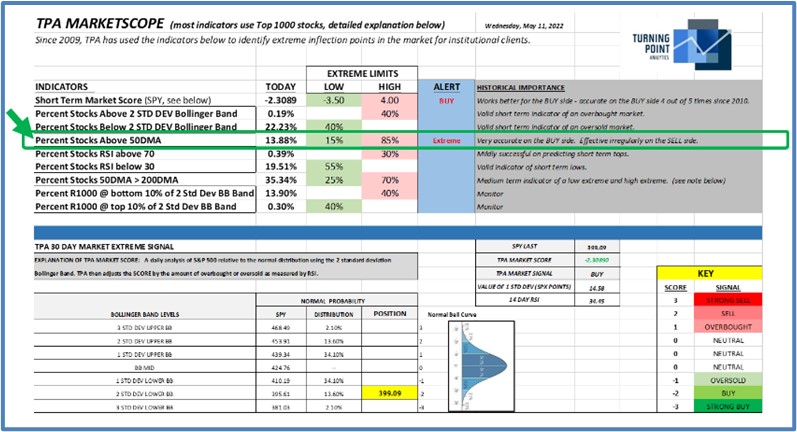
Furthermore, our colleague at TPA Research, Jeffrey Marcus, also made a similar observation. To wit:
“The percent of stocks in the Russell 1000 that are trading above their 50DMA hit 13% yesterday. Since TPA was founded in 2009, that signal marked a low extreme for the market. When the percent of stocks trading above their 50DMA goes below 15%, the market is oversold and there has been a very consistent move higher for the intermediate-term.
Clients should expect stocks to be more positive for the intermediate term, which is defined as 50 trading days or approximately 2.3 months.”
There are plenty of technical indications that we should see a reflexive rally in the near term. However, we agree with Sentiment Trader’s conclusion that we are not at “THE” bottom just yet.
“This is an unhealthy market environment, so we should require extreme sentiment readings across a wide variety of measures to have any confidence in a market rebound. And even then, our expectations should be moderate, betting on a multi-week or multi-month relief of the pessimism, not necessarily a lasting low. Until this week, we hadn’t really seen those true extremes. We have not yet seen actual capitulation, which would present a more compelling case that stocks had reached a bear market bottom. So any potential relief rally from the current deep pessimism would be just that, a relief rally.”
The critical point is that at times like this, we make the majority of our investing mistakes. Patience and discipline are challenging things in portfolio management, and our emotions often lead us astray.
The market will likely rally sharply right after you sell everything and go to cash.

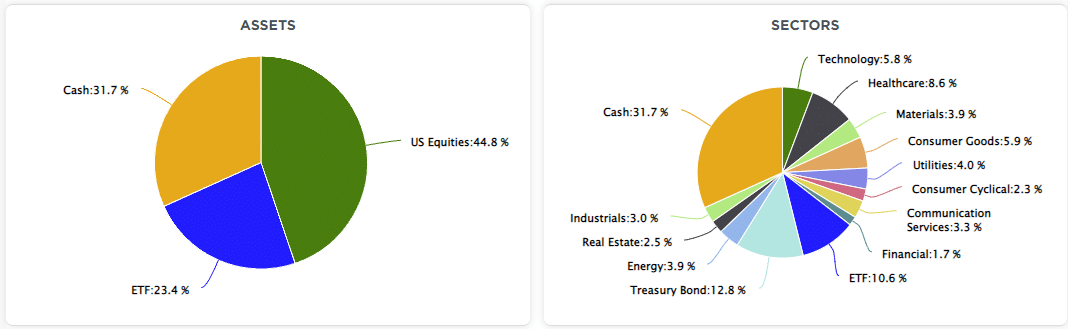
Portfolio Update
Of the entire decline this year, roughly 90% of it has occurred since the reflex rally peak in March. The selling pressure has been brutal and unrelenting, driving investors to make emotional-based sell decisions. Of course, such is entirely understandable, despite investors’ “best intentions” to “buy and hold” during a decline. Every investor has a point where “loss aversion” overrides all other decision-making processes.
We continue to keep our reduced equity exposure at lower levels. With the market deeply oversold, we are holding our current allocations. We are looking for a reflexive rally to sell into to raise some additional cash and rotate further into fundamental and value-based holdings. We have already nibbled at a couple of positions during the recent decline.
Let me repeat from last week that we continue to expect the next few weeks, and even the next couple of months, to remain frustrating. This past week was no exception.
“Critically, it remains important not to overreact to that volatility and wrongly position portfolios due to an emotional reaction. More often than not, such actions turn out to be far more harmful than the market itself.”
As discussed, there is a high probability we will make a short-term bottom soon. Confirmation of an inflation peak should allow a rally to reduce risk, rebalance portfolios, and reallocate holdings accordingly.
No one will want to own stocks when we get to the final bottom.
But such is the point where the best buying opportunities occur.
Have a great week.
Market & Sector Analysis
S&P 500 Tear Sheet

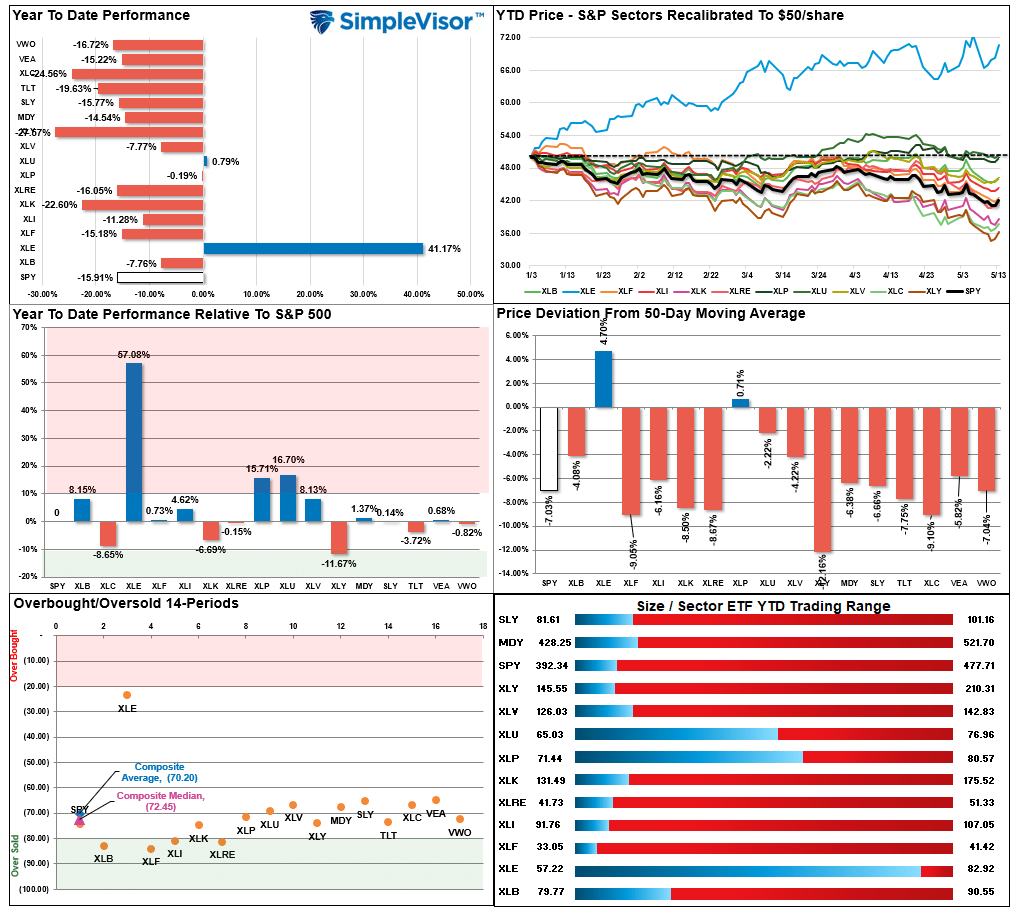
Relative Performance Analysis
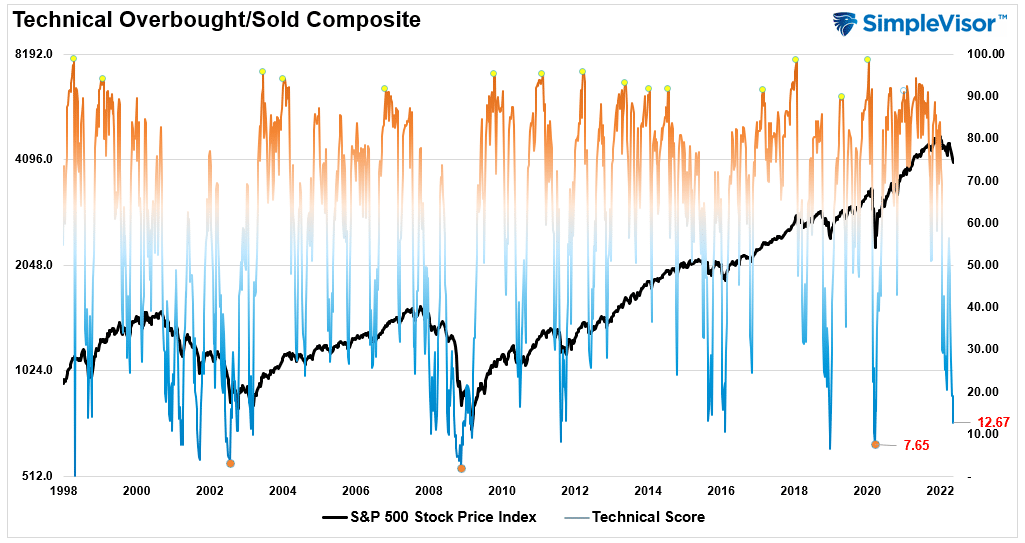
Technical Composite
The technical overbought/sold gauge comprises several price indicators (RSI, Williams %R, etc.), measured using “weekly” closing price data. Readings above “80” are considered overbought, and below “20” are oversold. The current reading is 12.67 out of a possible 100.
Portfolio Positioning “Fear / Greed” Gauge
The “Fear/Greed” gauge is how individual and professional investors are “positioning” themselves in the market based on their equity exposure. From a contrarian position, the higher the allocation to equities, to more likely the market is closer to a correction than not. The gauge uses weekly closing data.
NOTE: The Fear/Greed Index measures risk from 0 to 100. It is a rarity that it reaches levels above 90. The current reading is 30.9 out of a possible 100.

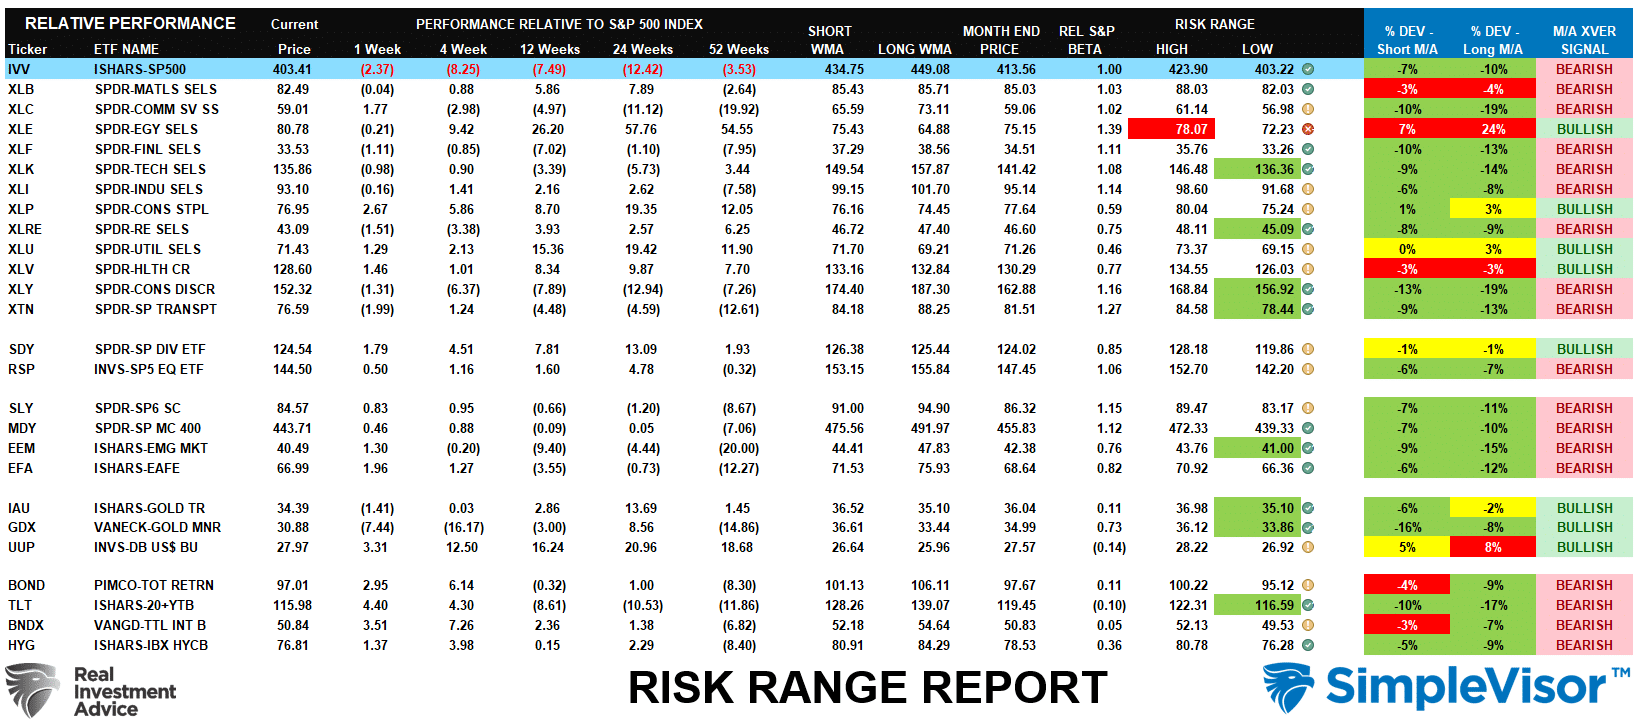
Sector Model Analysis & Risk Ranges
How To Read This Table
- The table compares the relative performance of each sector and market to the S&P 500 index.
- “M/A XVER” is determined by whether the short-term weekly moving average crosses positively or negatively with the long-term weekly moving average.
- The risk range is a function of the month-end closing price and the “beta” of the sector or market. (Ranges reset on the 1st of each month)
- The table shows the price deviation above and below the weekly moving averages.
- The complete history of all sentiment indicators is under the Dashboard/Sentiment tab at SimpleVisor.
Weekly Stock Screens
Each week we will provide three different stock screens generated from SimpleVisor: (RIAPro.net subscribers use your current credentials to log in.)
This week we are scanning for the Top 20:
- Relative Strength Stocks
- Momentum Stocks
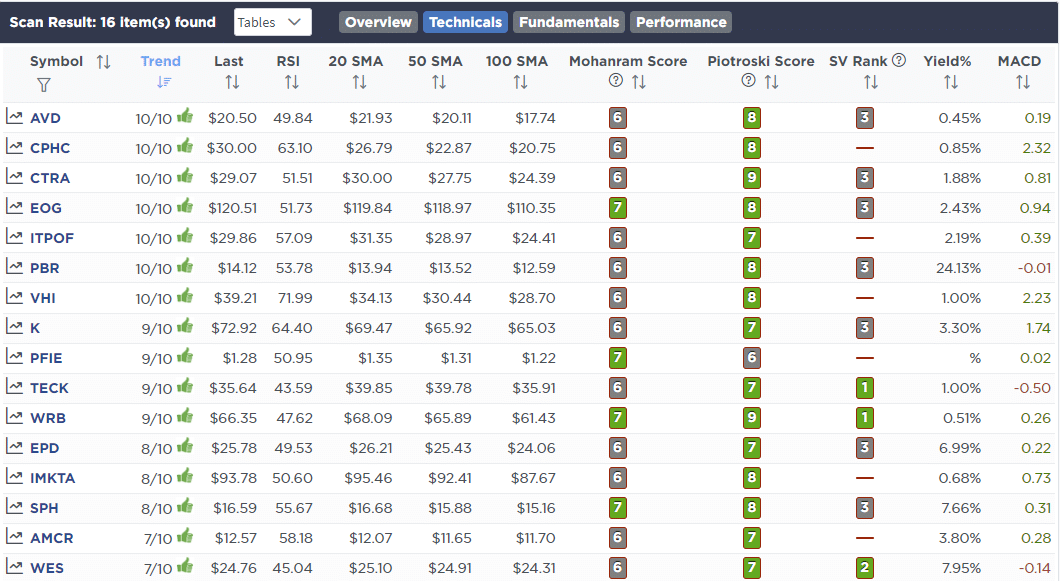
- Technically Strong With Strong Fundamentals
These screens generate portfolio ideas and serve as the starting point for further research.
(Click Images To Enlarge)
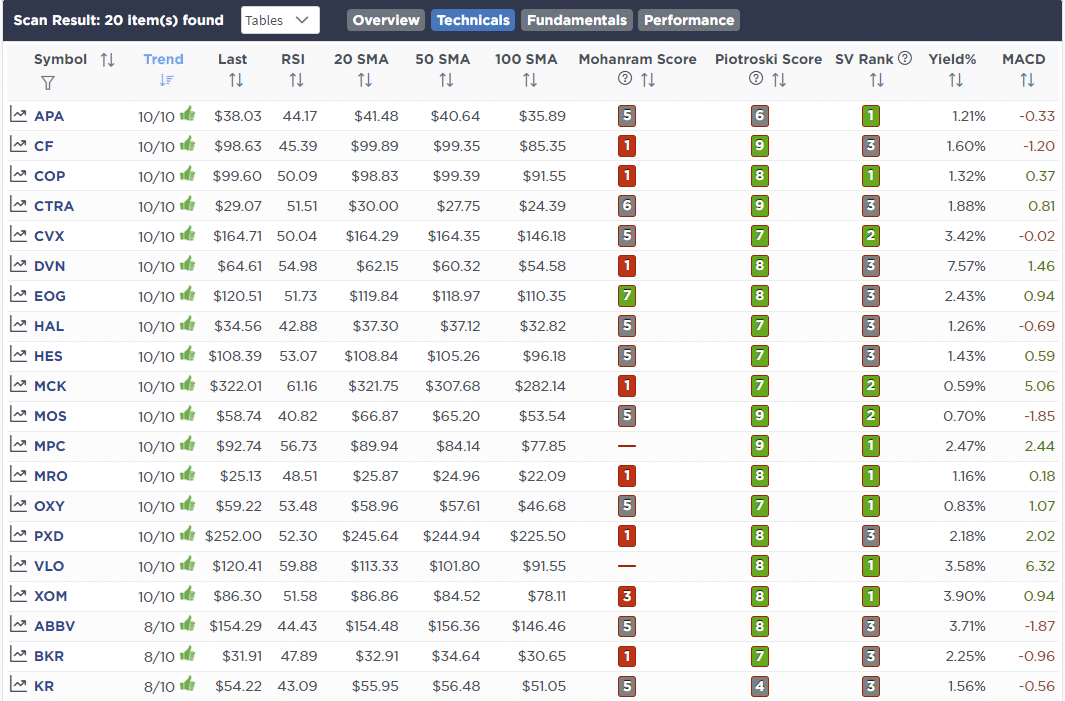
RSI Screen
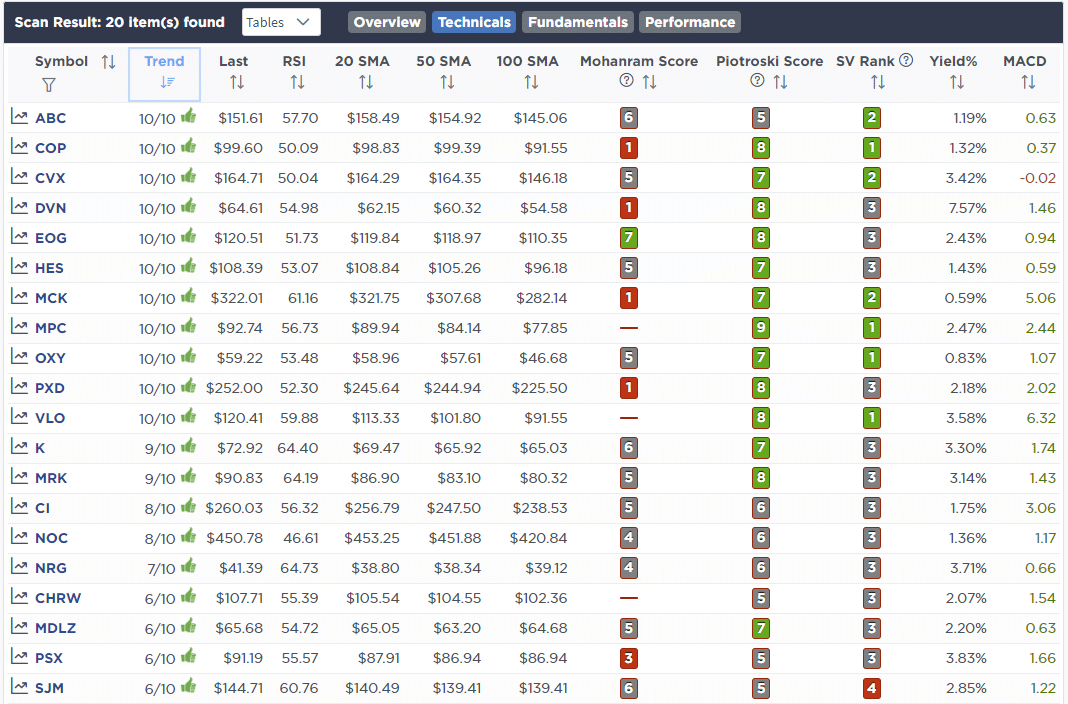
Momentum Screen
Technical & Fundamental Strength Screen
SimpleVisor Portfolio Changes
We post all of our portfolio changes as they occur at SimpleVisor:
May 9th
“Last week, Albemarle (ALB) surged back into extreme overbought territory. We are reducing ALB back to target portfolio weights for now.
We have 3-other positions that are on stop levels but are extremely oversold. So we will look to reduce positions further on a reflexive rally.”
- Reduce ALB to 3.5% of the portfolio
May 11th
“In our process of shifting to a bit more defensive posture in our portfolio, we are adding a “start position” in United Healthcare (UNH.) The demographic story bolds well fundamentally, and healthcare will continue to be a defensive trade in a slowing economic environment. We will look to add to our position opportunistically.
UNH has shown good stability and tends to trade with the value grouping. Our intention is to add some value, lower beta now, and assuming we get the bounce we expect, shed some of the higher growth, higher beta names as the market peaks. Call it a running rebalance.
Technically the stock is very oversold and near the bottom of its bullish uptrend channel.”
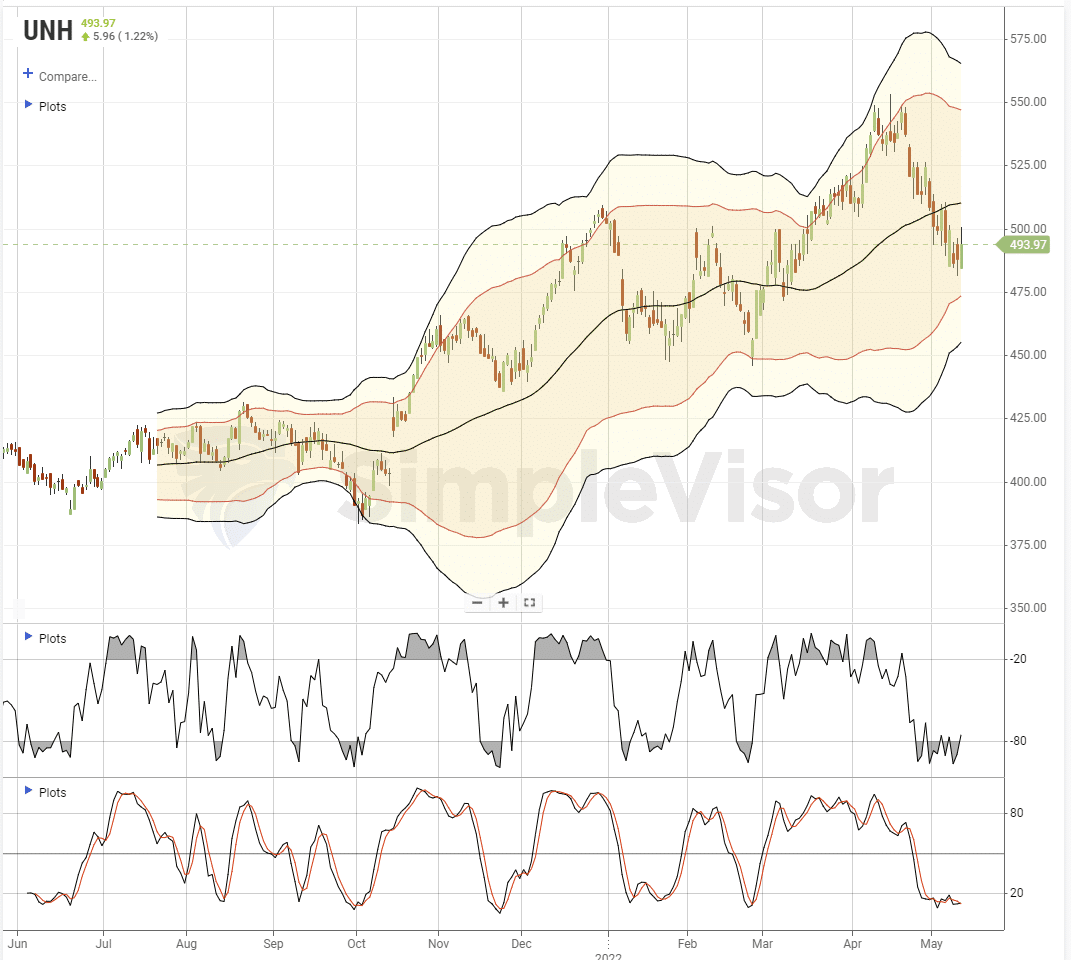
- Initiate a 1.5% weighting of UNH to the portfolio.
May 13th
“While we are waiting on a reflexive rally to take hold so that we can reduce high beta volatility and adjust weightings, we are continuing with our process of a “runnng rebalance.” Our goal, as we head toward a recession, remains to tilt the portfolio more heavily towards value and defense as the economy slows. As such we have been taking advantage of beaten-down prices in companies like Verizon (VZ), Public Storage (PSA), and United Healthcare (UNH.)
Today we are rebalancing our holding of Abbott Laboratories (ABT) back to target model weights of 2% of the portfolio following the sell-off over baby formula concerns.”
- Rebalance ABT to 2% of the portfolio.

Lance Roberts, CIO
Have a great week!


