
Inside This Week’s Bull Bear Report
- The Correction Begins
- Recession Countdown Begins
- How We Are Trading It
- Research Report – Bullish Investors Continue To Fight The Fed
- Youtube – Before The Bell
- Stock Of The Week
- Daily Commentary Bits
- Market Statistics
- Stock Screens
- Portfolio Trades This Week
The Correction Begins
As the recession countdown begins, the market finally took notice of rising yields and the continued talk of higher rates. In last week’s message, we discussed that while the bulls were betting on a “no recession” scenario, the market was beginning to question that bet, and a deeper sell-off was coming. To wit:
“It is not uncommon for the market to hold up initially when the “sell signal” is triggered. Much like a car rolling downhill when the brakes are applied, it takes time to slow the previous momentum to a stop. The “sell signal” suggests that momentum is slowing.
While the market did rally into Friday’s close, this is the first sign of a potential retest of the multiple support levels clustered around the 3950-4000. If the market can hold those levels, such will be an opportunity to increase equity exposure. A failure of that support will suggest a deeper correction is at work.”
Unfortunately, worse-than-expected data on inflation and hawkish Fed minutes sent markets reeling. The sell-off started on Tuesday and gained traction on Friday, taking out support at the 50-DMA. Critical support at the rising trend line from the October lows and the 200-DMA is now getting tested. A failure of those levels next week will put the bears back in charge of the market near term.
You will notice that we are now testing the bottom of the rising trend channel from October and failed at the June high resistance. Such sets up the market for a continued churn as the bulls and bears struggle for control.
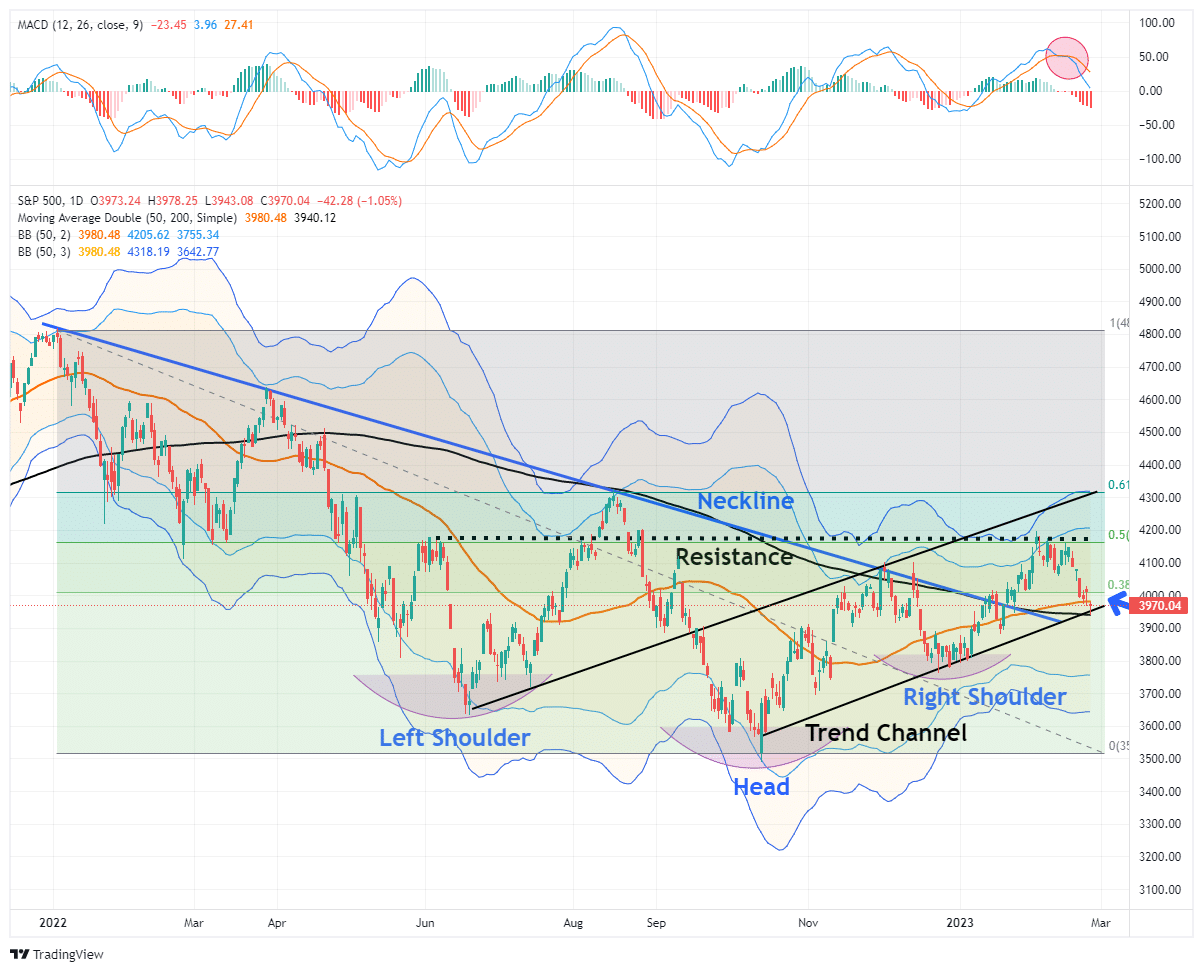
As noted below in both the Relative Performance Analysis and Risk Range Report sections, the market is oversold enough on a short-term basis to bounce. To wit:
“We expect a reflexive rally in the market to begin next week. Such will be a tradeable rally to sell into as the market remains on a stronger sell signal. As such upside will likely be limited and short-lived. Remain cautious for now, but opportunities are beginning to present themselves.“
Obviously, the challenge for the market near term remains the economic data that continues to hint that inflationary pressures remain “stickier” than previously thought.
Now, the recession countdown has started.
Need Help With Your Investing Strategy?
Are you looking for complete financial, insurance, and estate planning? Need a risk-managed portfolio management strategy to grow and protect your savings? Whatever your needs are, we are here to help.

Recession Countdown Begins
Last November, we wrote an article suggesting “No Recession” in 2023 was possible. To wit:
“Given the most aggressive Fed rate hiking campaign in the last 40 years, it’s difficult to fathom the economy could avoid a recession in 2023. Yet, this is what Goldman Sachs suggested could be the case.
‘Importantly, under the soft landing scenario, our economists forecast below-trend GDP growth will be accompanied by just a 1/2 point increase in the unemployment rate to 4.1%, and the US economy will avoid recession in 2023.’”
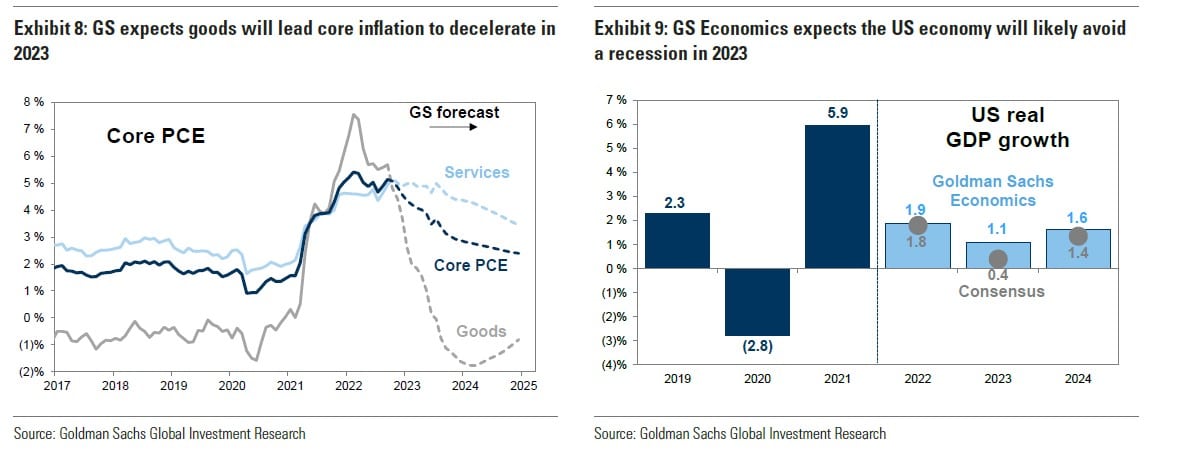
As stated then, we must acknowledge the “possibility” of Goldman Sachs’ view of a soft landing. However, as we will discuss next, the “probabilities” of a recession seem far more significant. However, as we stated then, one thing concerned us about a “recession in 2023.”
“But what bothers us with the recession/hard landing view is that everyone thinks the same.”
As Bob Farrell once said, “When all experts agree, something else tends to happen.”
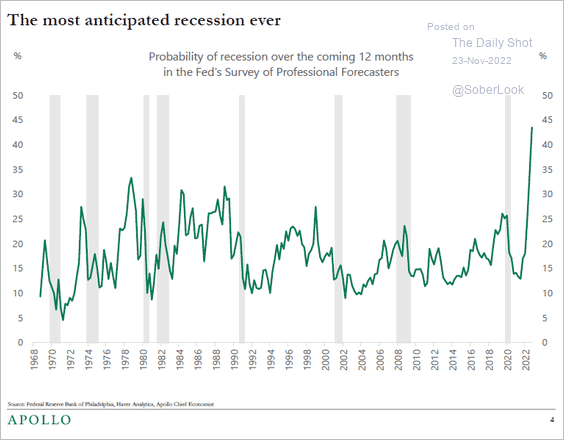
Today, that view has changed dramatically, with the “no landing,” or avoidance of a recession, becoming a standard view.
Search trends for “no landing” are taking off.

As search trends for “recession” are in a recession.

Now that everyone expects “no recession,” the recession countdown can start.
Yield Curve Inversions
We have discussed the importance of yield curve inversions numerous times. However, when it comes to a recession countdown, there is always a misunderstanding by the media of the signal being sent.
A good example was some analysis by Yahoo Finance.
“Take a look at the August 2019 inversion. A recession did happen a year and a half later. But it was triggered by a global pandemic — something bond markets could not have possibly foreseen or predicted.”
That isn’t a correct statement, as the recession occurred only six months later. Furthermore, the bond market did know there was something very wrong economically, as the Fed was engaged in a massive repurchase operation to bail out hedge funds.
As we noted then, all that was required to push the economy into a recession was an “unexpected, exogenous event.” That event turned out to be a pandemic.
Notably, when psychology changes, for whatever reason, the rotation from “risk-on” to “risk-off” will find Treasury bonds as a “store of safety.” Historically, such is always the case during crisis events in markets.

Once again, it is pretty likely we should not dismiss the message from the bond market. Bonds are essential for their predictive qualities, so we pay enormous attention to U.S. government bonds, specifically the difference in their interest rates.
This data has a high historical correlation to where the economy, stock, and bond markets head longer term. This is because everything from oil prices, trade tensions, political uncertainty, the U.S. dollar, credit risk, earnings strength, etc., reflects in the bond market and, ultimately, the yield curve.
The Recession Countdown Is Underway
Regarding yield curve inversions, the media always assumes this time is different because a recession didn’t occur immediately upon the inversion.
There are two problems with this way of thinking.
- The National Bureau Of Economic Research (NBER) is the official recession dating arbiter. They wait for data revisions by the Bureau of Economic Analysis (BEA) before announcing a recession’s official start. Therefore, the NBER is always 6-12 months late, dating the recession.
- It is not the inversion of the yield curve that denotes the recession. The inversion is the “warning sign,” whereas the un-inversion marks the start of the recession, which the NBER will recognize later.
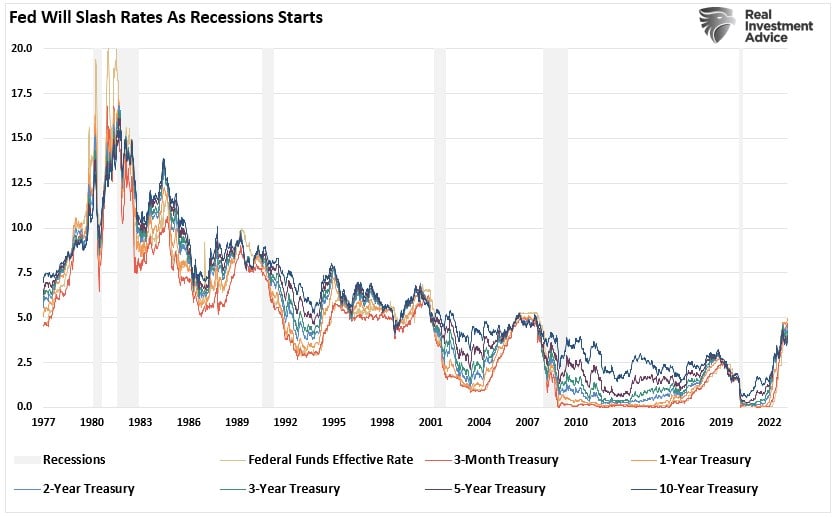
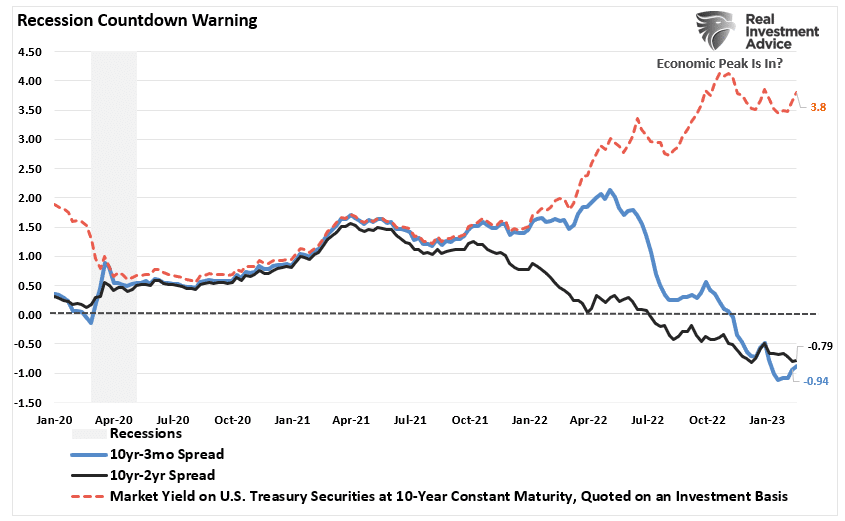
That last sentence is the most important. Regarding a “recession countdown,” the initial inversion is not the signal. It is when the curves un-invert that a recession is approaching. The reason is that the Federal Reserve is rapidly cutting rates as the recession is recognized. Such causes the short end of the yield curve to fall faster than the long end.
As the recession becomes recognized, all yields will fall across the Treasury curve as growth contracts and inflation falls. As shown, most of the yield spreads we monitor are now inverted. Historically, such has been a strong leading indicator of an impending recession. However, even then, it was several months before the economy slipped into recession.
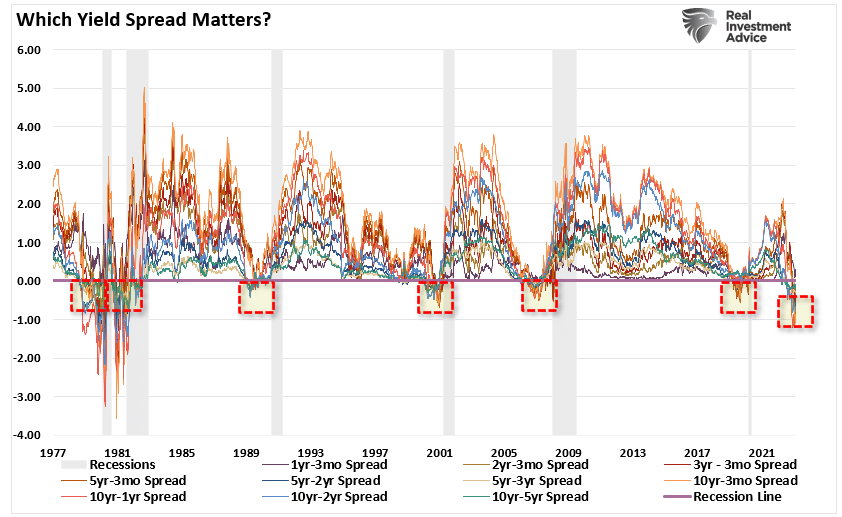
While the media continues to dismiss the risk of a recession and suggest the yield curve is wrong this time, the recession countdown is only beginning. That is because the yield curves have started to trough at the short end of the spectrum. As Simon White recently noted:
“While the yield curve’s inversion tells you a recession is on the way, it’s the subsequent re-steepening that indicates the slump’s imminence. Not all yield curves are alike, and some parts of it begin to steepen much sooner than others. One of the first to move is the 3m30y curve. In previous recessions it started to steepen well before most other parts of the curve.”
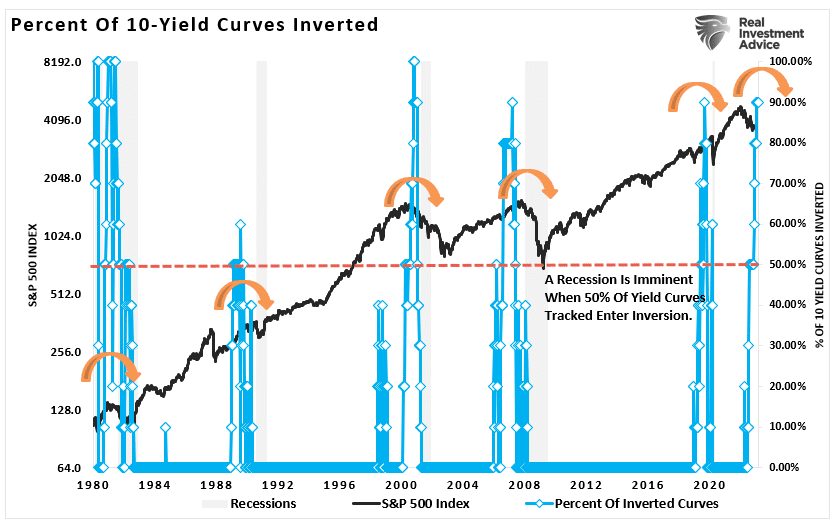
However, the bond market is already discounting weaker economic growth, earnings risk, elevated valuations, and a reversal of monetary support. Such is shown in the chart below. We track ten economically sensitive yield spreads. A recession follows whenever more than 50% of those spreads are inverted. Every time. (Read this for a complete history.)
Ignore At Your Own Risk
Investors have misread the message the yield curve is sending. As noted, it is not the inversion that is the signal; it is when it UN-inverts that the recession clock begins to tick. Such is because yields will follow economic growth and inflation.

Wages also play an essential role. The following chart includes wages in a composite economic index. Unsurprisingly, there is a high correlation between the index and yields.

As tighter Fed policy weighs on individuals, demand will fall, leading to an increase in supplies. The lack of demand will cause prices to fall, leading to a decline in inflation. However, that decline results from slower economic activity, fostering higher unemployment and falling wages.
The yield curve inversions tell us that the economy is now vulnerable to an event that causes a sudden rise in unemployment and a wage decline. As a result, the Fed will begin cutting rates, and yields will decline across the Treasury market.
Leading Versus Lagging
Despite commentary to the contrary, the yield curve is a “leading indicator” of what is happening in the economy, as opposed to economic data, which is “lagging” and subject to massive revisions.
Let me finish with this.
“Employment data is among the most lagging and heavily revised. It is one of the reasons recessions appear to happen so fast as it becomes clear the economy was already faring worse than thought.
But the Fed will focus on the data as it is. When you combine this with the current disinflationary trend in the US likely on the cusp of ending due to a China-driven global cyclical upturn, the central bank is poised to keep policy tighter for longer.
The downturn is thus liable to be worse, leaving the Fed needing to cut rates more. The maximum inversion in the yield curve this cycle would be historically consistent with over 500 bps of rate cuts.
This is not a prediction, but it suggests that the Fed will cut more than is currently priced. As long as it is in higher-for-longer mode, more cuts should be priced.” – Simon White, Bloomberg
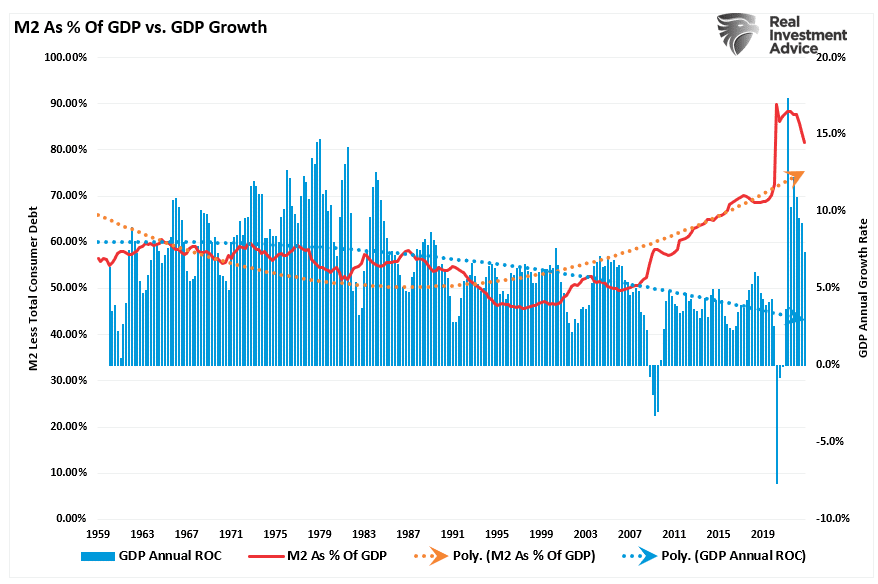
The recession countdown has started, but given the massive amount of liquidity still in the system, a recession may take longer to manifest itself this time.
Such is why using the “yield curve” as a “market timing” tool is unwise.
However, dismissing yield curve inversions entirely is just as foolish.
History has not been kind to those that do.
Navigating A Recession When It Comes
As we queried last week:
“Could this time be different? Absolutely, The bullish formations in the market indeed show investors are hopeful of such an outcome. Unfortunately, there is a lot of history that suggests otherwise.”
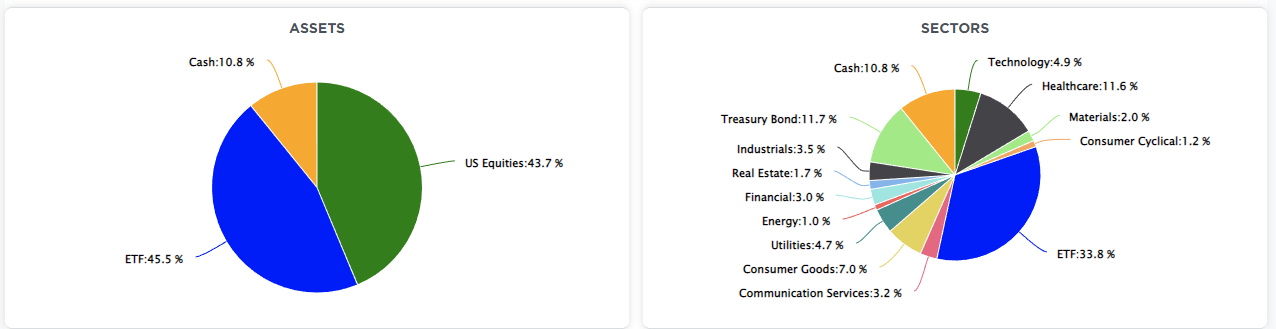
We remain underweight in stocks and bonds and overweight cash and short-term Treasuries. (The ETF allocation comprises short-duration Treasury bonds and floating rate Treasuries, with a lesser allocation to long-dated Treasuries. You can view our models in real-time at SimpleVisor.com)
While the economy could avoid a “recession,” those odds are slim at best. Therefore, we should at least prepare for a storm while hoping it doesn’t come. The rules are simple but effective.
- Raise cash levels in portfolios.
- Reduce equity risk, particularly in high beta growth areas.
- Add or increase the duration of bond allocations which tend to offset risk during quantitative tightening cycles.
- Reduce exposure to commodities and inflation plays as economic growth slows.
If a recession occurs, the preparation allows you to survive the impact. Protecting capital will mean less time spent getting back to even after the storm passes.
Alternatively, it is relatively easy to reallocate funds to equity risk if we avoid a recession or if the Fed does revert to monetary accommodation.
Investing during a recession is difficult. However, you can take steps to ensure that increased volatility is survivable.
- Have excess emergency savings, so you are not “forced” to sell during a decline to meet obligations.
- Extend your time horizon to 5-7 years, as buying distressed stocks can get more distressed.
- Don’t obsessively check your portfolio.
- Consider tax-loss harvesting (selling stocks at a loss) to offset those losses against future gains.
- Stick to your investing discipline regardless of what happens.
If I am correct, the recession could be worse than expected, and prices will decline. If I am wrong, we will reallocate to equities and rebalance our portfolios for growth.
Have a great week.
Research Report

Subscribe To “Before The Bell” For Daily Trading Updates (Formerly 3-Minutes)
We have set up a separate channel JUST for our short daily market updates. Be sure and subscribe to THIS CHANNEL to receive daily notifications before the market opens.
Click Here And Then Click The SUBSCRIBE Button
Subscribe To Our Youtube Channel To Get Notified Of All Our Videos
Stock Of The Week In Review
This week we use a new function within our SimpleVisor stock screener to find significantly undervalued value stocks. Recently, we added the ability to screen based on where a stock price compares to its fair value. SimpleVisor’s fair value calculation is based on the average of the following three models: Benjamin Dodd, Peter Lynch, and our SV proprietary Discounted Cash Flow model.
The stocks in this screen offer cheap valuations and discounts to their respective fair value, which provide the potential for significant upside if the stock price gravitates toward fair value.
Here is a link to the full SimpleVisor Article For Step-By-Step Screening Instructions.
Here is one of the companies we screened.
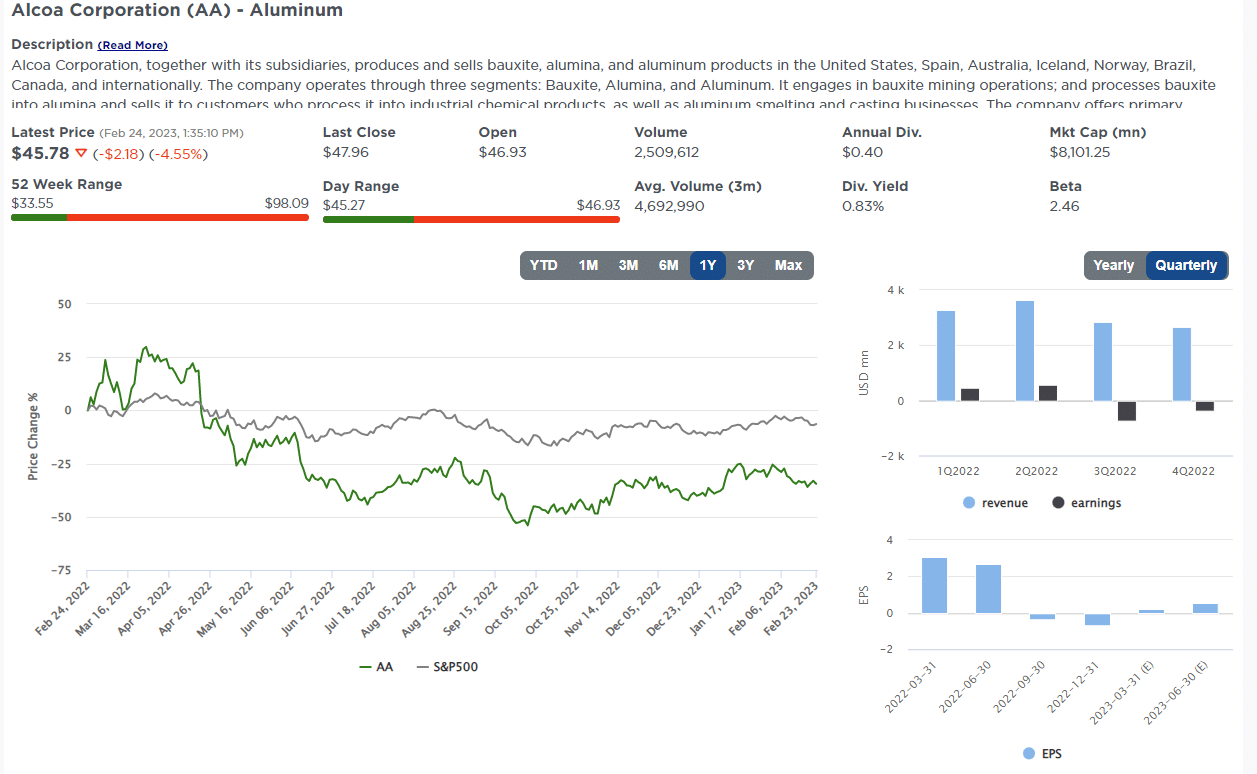
Login to Simplevisor.com to read the full 5-For-Friday report.
Daily Commentary Tidbits
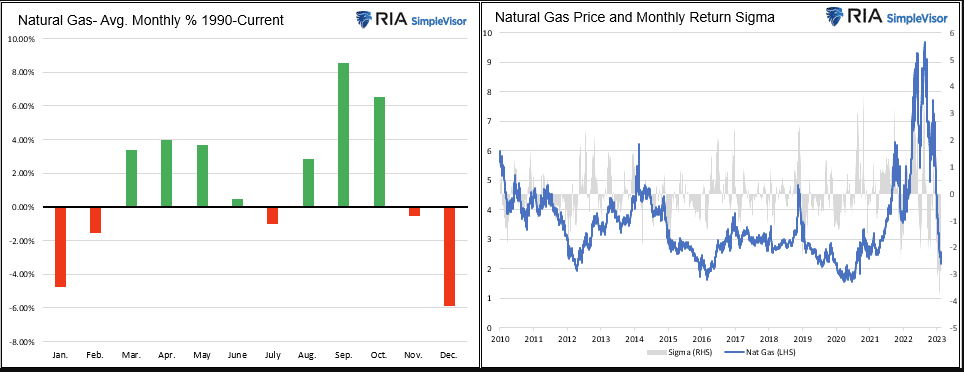
In mid-August, the price of natural gas peaked at $9.33. Forecasts for a cold winter here and in Europe and the Russian-Urkranian conflict led many to foresee natural gas shortages. The winter was generally milder than expected, and supply lines continued to normalize, driving the price of natural gas precipitously lower. Natural gas is around $2, down about 75% in six months. The graph on the right shows the stunning decline in prices. The bar chart on the left shows average returns by month. It is not uncommon for prices to decline during the winter months.
While the current situation may seem extremely bearish, natural gas is approaching 30-year lows. The graph on the right shows the most recent 30-day return is negative four sigmas. Statistically speaking, such an event should occur once every 126 years! Another reason we might expect better performance is seasonal returns. As we share, they tend to be positive from March through October.
Click Here To Read The Latest Daily Market Commentary (Subscribe For Pre-Market Email)
Bull Bear Report Market Statistics & Screens

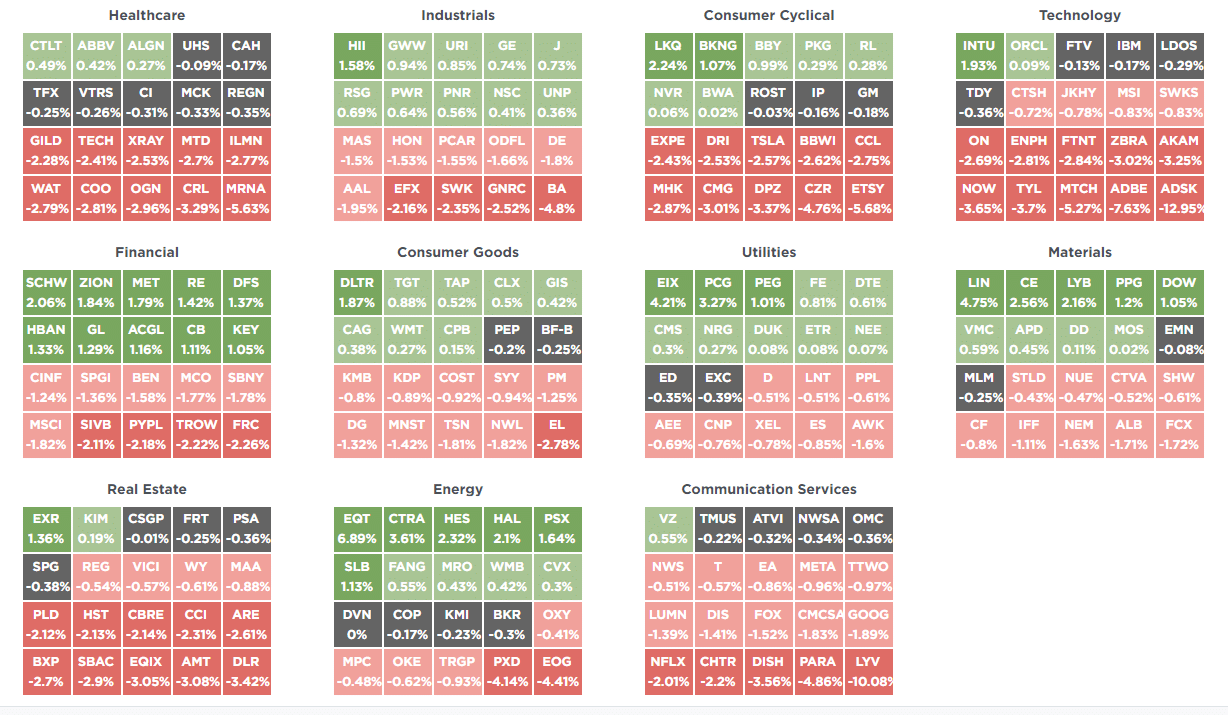
SimpleVisor Top & Bottom Performers By Sector
S&P 500 Weekly Tear Sheet
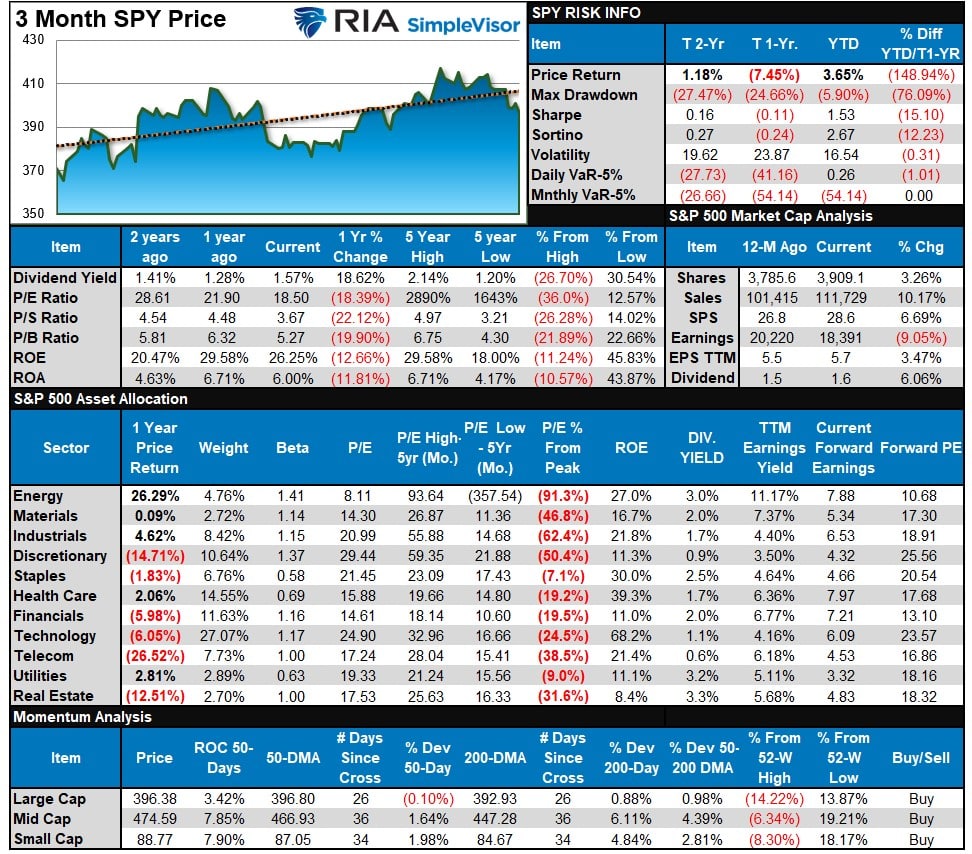
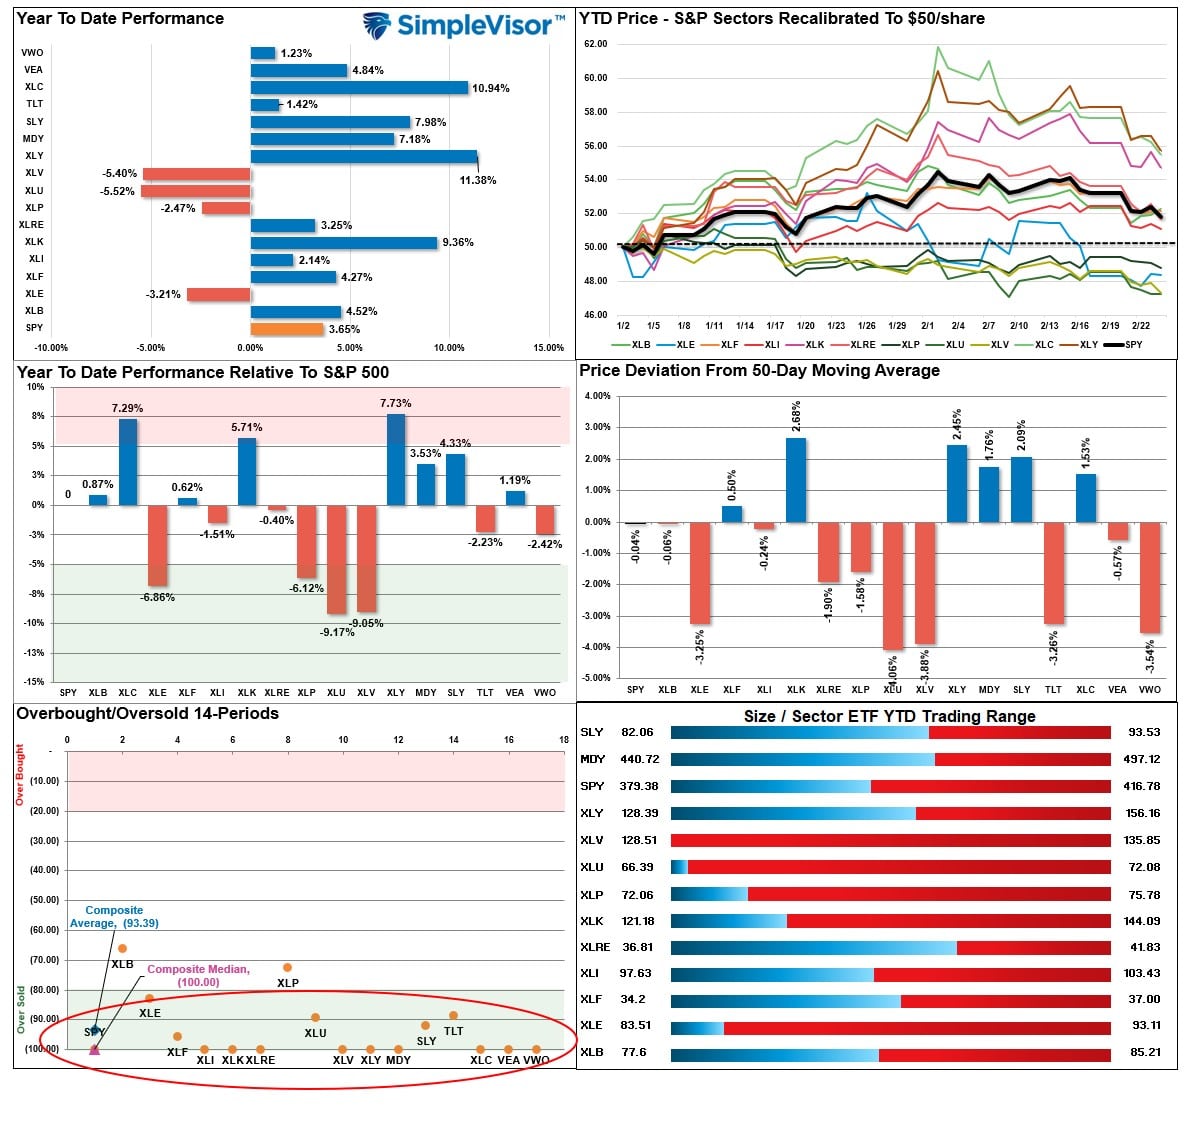
Relative Performance Analysis
Last week we stated that the rotation from overbought to oversold started to occur as the correction continued. That correction gained traction this week, pushing most major markets and sectors into oversold territory. We would expect a reflexive rally in the market to begin next week. Such will be a tradeable rally to sell into as the market remains on a stronger sell signal. As such upside will likely be limited and short-lived. Remain cautious for now, but opportunities are beginning to present themselves.
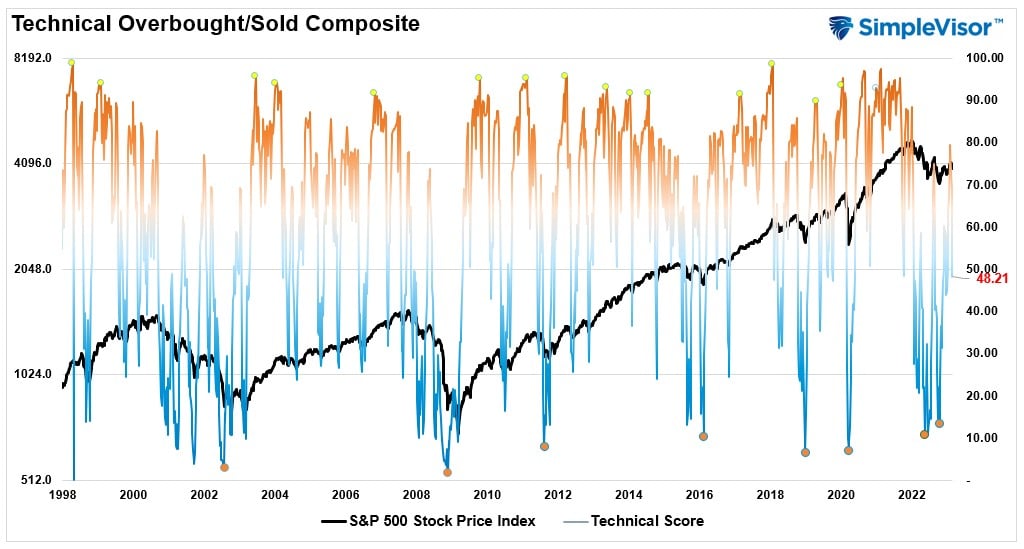
Technical Composite
The technical overbought/sold gauge comprises several price indicators (RSI, Williams %R, etc.), measured using “weekly” closing price data. Readings above “80” are considered overbought, and below “20” are oversold. Markets tend to peak when those readings are at 80 or above, suggesting prudent profit-taking and risk management. The best buying opportunities exist when those readings are 20 or below.
The current reading is 48.21 out of a possible 100 and rising. Remain long equities for now.
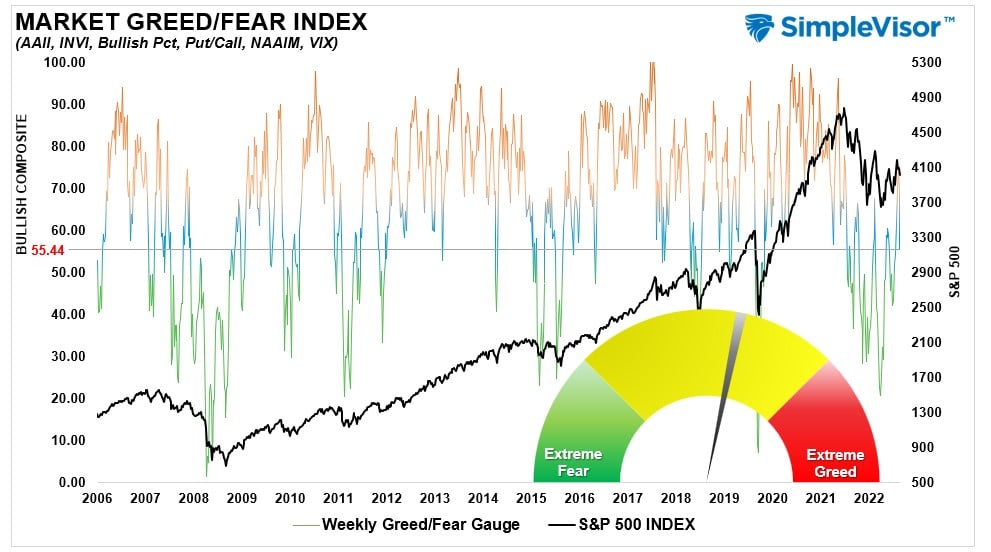
Portfolio Positioning “Fear / Greed” Gauge
The “Fear/Greed” Gauge is how individual and professional investors are “positioning” themselves in the market based on their equity exposure. From a contrarian position, the higher the allocation to equities, the more likely the market is closer to a correction than not. The gauge uses weekly closing data.
NOTE: The Fear/Greed Index measures risk from 0 to 100. It is a rarity that it reaches levels above 90. The current reading is 55.44 out of a possible 100.
Sector Model Analysis & Risk Ranges
How To Read This Table
- The table compares the relative performance of each sector and market to the S&P 500 index.
- “M” XVER” “Moving Average Cross Over) is determined by the short-term weekly moving average crossing positively or negatively with the long-term weekly moving average.
- The risk range is a function of the month-end closing price and the “beta” of the sector or market. (Ranges reset on the 1st of each month)
- The table shows the price deviation above and below the weekly moving averages.
As noted last week, “We continued to see the correction in the market continue this week, with the rotation from overbought to oversold sectors continuing. Bonds are currently very oversold with the recent rate run, and Staples, Discretionary, Communications, and Industrials are showing better relative performance.” That was salient this week as we continued to see those rotations occurring. The market is oversold enough for a bounce, and those sectors highlighted in green will likely be the beneficiaries of that bounce.

Weekly SimpleVisor Stock Screens
We provide three stock screens each week from SimpleVisor.
This week we are search for the Top 20:
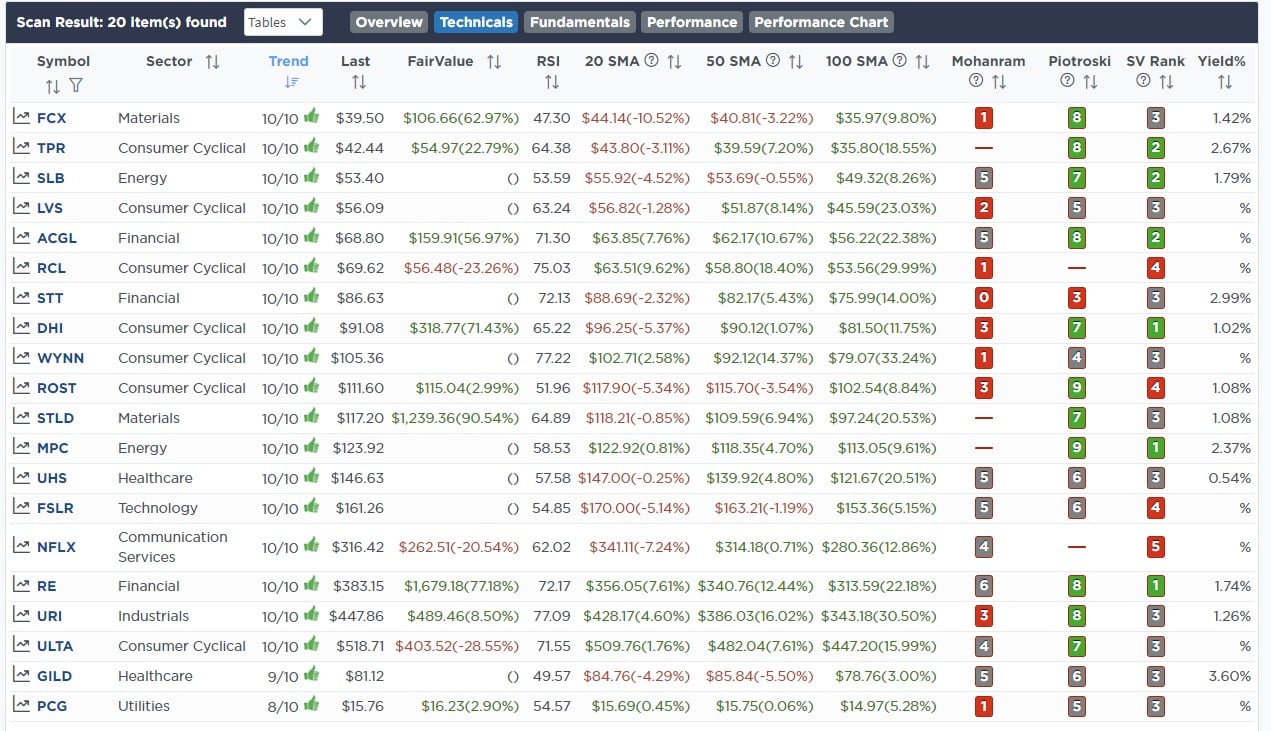
- Relative Strength Stocks
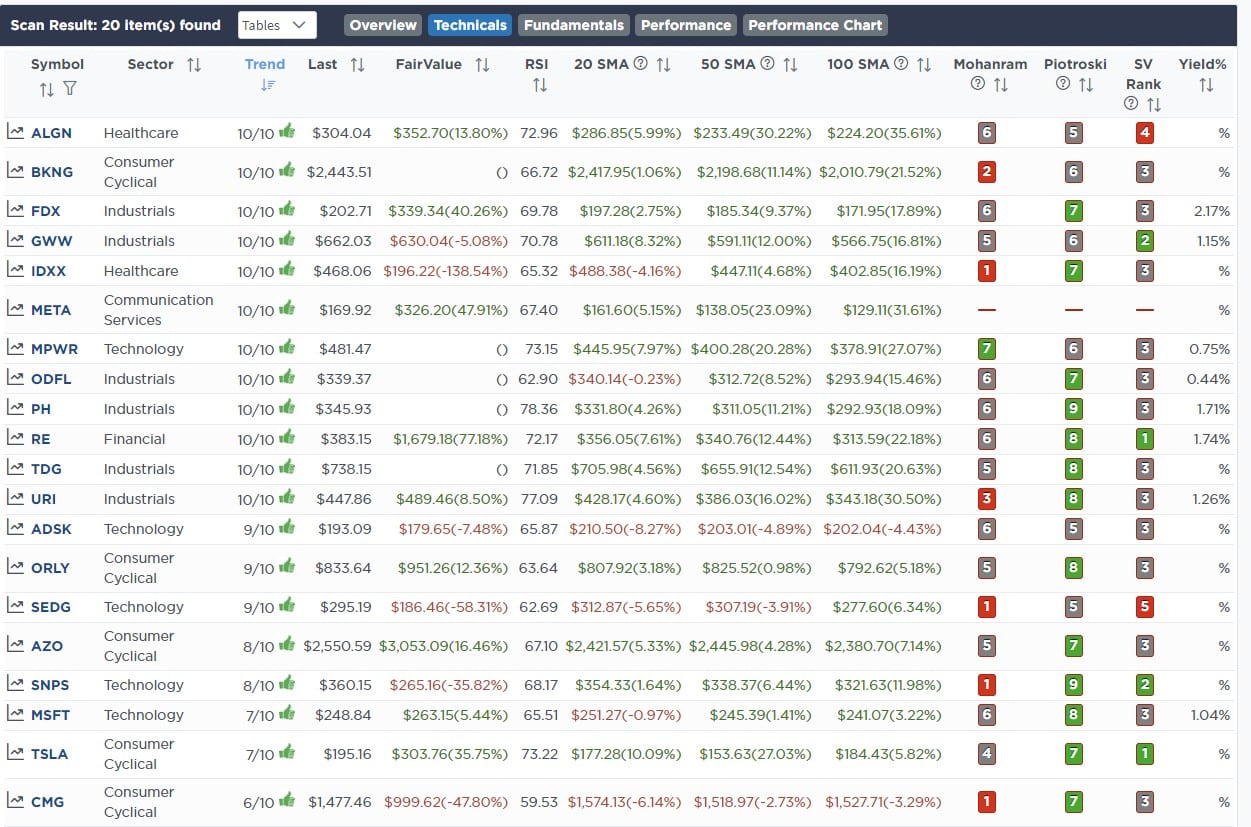
- Momentum Stocks
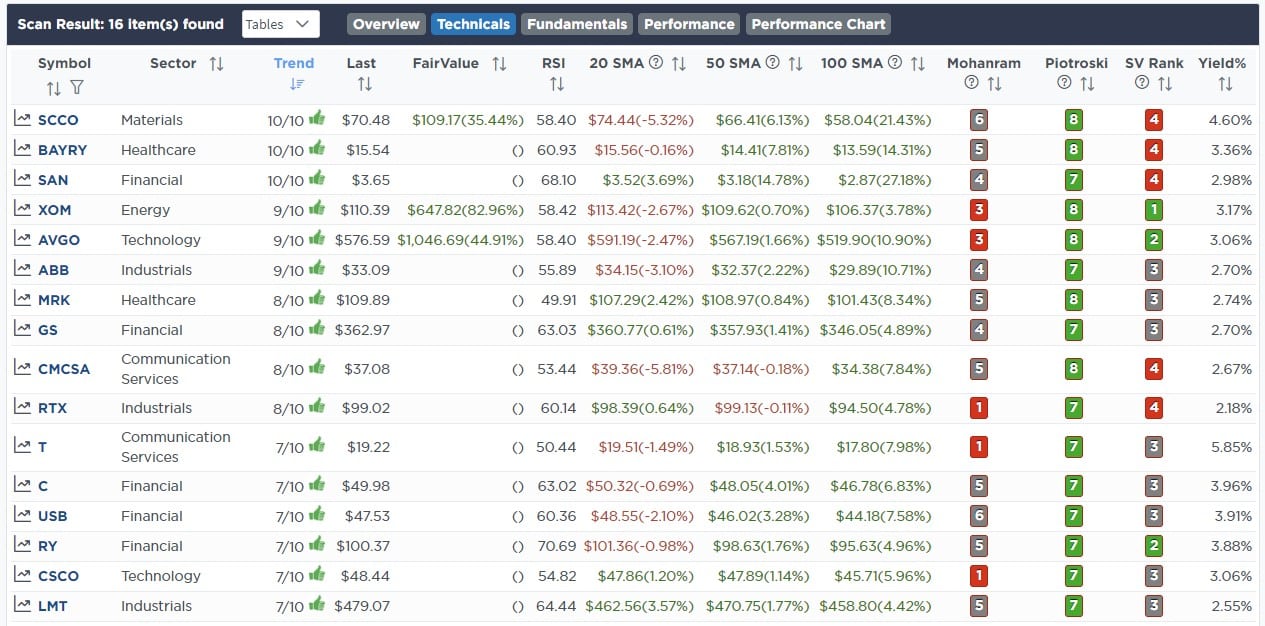
- Highest Rated Stocks With Dividends
(Click Images To Enlarge)
RSI Screen
Momentum Screen
Highest Rated Stocks With Dividends
SimpleVisor Portfolio Changes
We post all of our portfolio changes as they occur at SimpleVisor:
February 21st
“The Energy market was extremely overbought as of the end of last year, but that reversed quickly at the beginning of this year as the rotation to beaten up Technology ensued. With many stocks in the energy sector deeply oversold, we are adding some exposure to gain dividend income for the portfolios.”
Equity Model:
- Increase Devon Energy (DVN) to 1.25% of the portfolio.
- Add 1% of the portfolio to Conoco Phillips (COP)
ETF Model:
- Add 1% of the portfolio to the SPDR Energy ETF (XLE)
February 23rd
This morning, we added 1% of EQT Corp. (EQT) to the equity model. EQT is a natural gas producer. The write-up below from yesterday’s Commentarydrives our interest in gaining exposure to natural gas.
EQT is one of the lesser volatile and stronger fundamental producers highly focused on natural gas. Technically, EQT is sitting on a two-year support line and just triggered a short- and long-term MACD buy signal.”
Equity Model
- Initiate a 1% position of the portfolio to EQT

Lance Roberts, CIO
Have a great week!

