Russia Invasion Sends Stocks Rallying?


In this 02-25-22 issue of “Russia Invasion Sends Stocks Rallying?”
- Russia Invasion Sends Stocks Rallying
- Geopolitical Events And Market History
- Portfolio Positioning
- Sector & Market Analysis
Follow Us On: Twitter, Facebook, Linked-In, Sound Cloud, Seeking Alpha
Need Help With Your Investing Strategy?
Are you looking for complete financial, insurance, and estate planning? Need a risk-managed portfolio management strategy to grow and protect your savings? Whatever your needs are, we are here to help.
Schedule your “FREE” portfolio review today.

Weekly Market Wrap With Adam Taggart
Russia Invasion Sends Stocks Rallying?
Thursday morning stocks plunged pre-open on news of the Russia invasion of Ukraine. However, as we wrote in our PRE-MARKET commentary (subscribe for email delivery):
“However, as I noted on Twitter recently that the market is now oversold on many levels combined with very negative investor sentiment. Such is a good setup for a short-term reflexive rally.“
What I noted on Twitter was that the selloff on Thursday was extremely similar to the selloff in 2014 with the Russia invasion of Crimea.
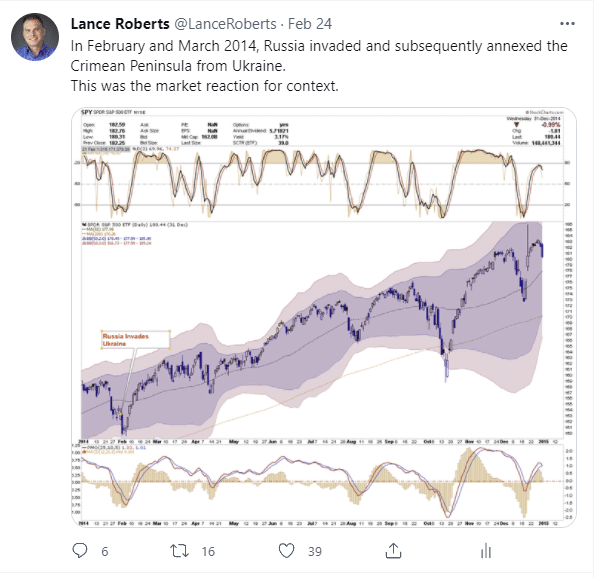
As I will discuss in more detail today, geopolitical events certainly cause much emotional distress for investors, but rarely have a lasting impact on markets.
Such was the case on Thursday as stocks plunged at the open, but then rallied finishing the day sharply higher. That rally continued through Friday as investors began to cover shorts and put capital back to work. As we discussed in Friday’s Morning Commentary:
“We discussed yesterday, the market was deeply oversold and due for a relief rally. While the Russian stock market took a beating, the U.S. market rallied strongly with the Nasdaq rising nearly 7% from its intra-day lows. If we get some follow-through this morning, the market will negate the break of support on Wednesday and should set the market in motion for an initial retracement to the 200-dma.”
That is what happened with the market closing firmly higher on Friday. With a short-term buy signal, and not overbought yet, there are three rally targets for the market currently:
- The 200-dma (red line)
- The current downtrend line; and,
- The 50-dma (black line)

While anything is possible, we suggest using those levels to reduce risk heading into the Fed meeting.
As always, “emotionally-driven” investment decisions tend to have the worst outcomes.
Let’s review some history and what drives larger market corrections.
A History Of Events And Market Responses
The Russia invasion of Ukraine indeed sent markets tumbling initially but quickly recovered. While events such as this are certainly emotionally charged, market responses are not always what we think they should be.
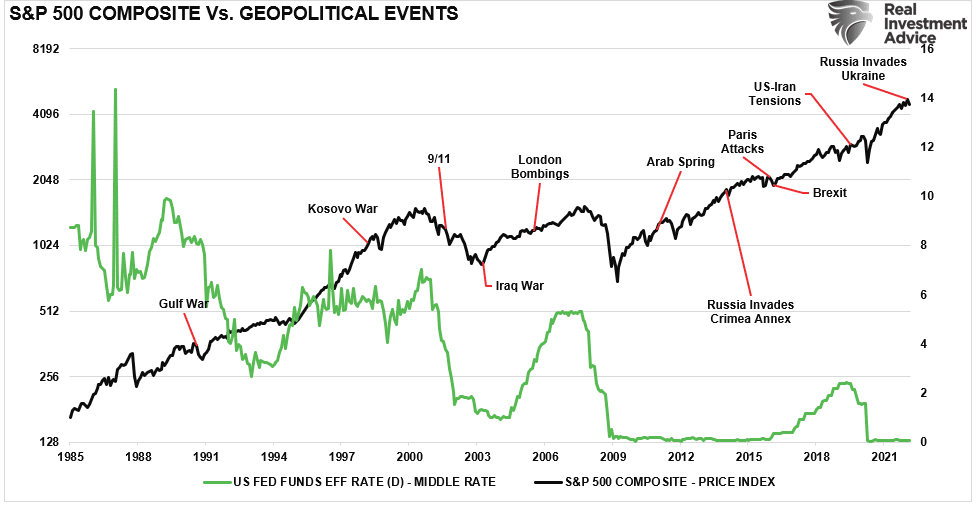
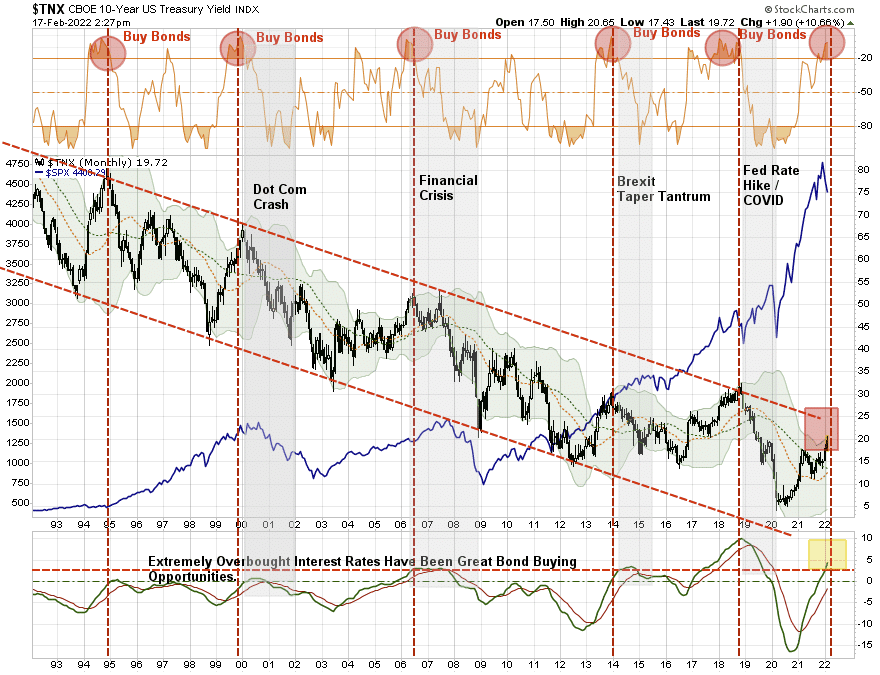
On Thursday, Goldman Sachs put out the Fed’s geopolitical risk index chart. Not surprisingly, the index is at a level not seen since the start of the Iraq War.
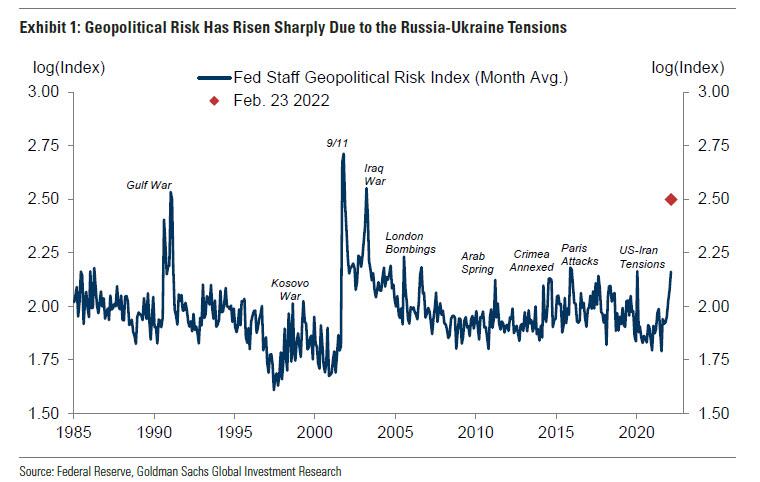
However, while the index is interesting it provides little context as to how markets, and the Fed, responded to those geopolitical events. I overlaid those events on the S&P 500 index using a log scale for a better perspective.
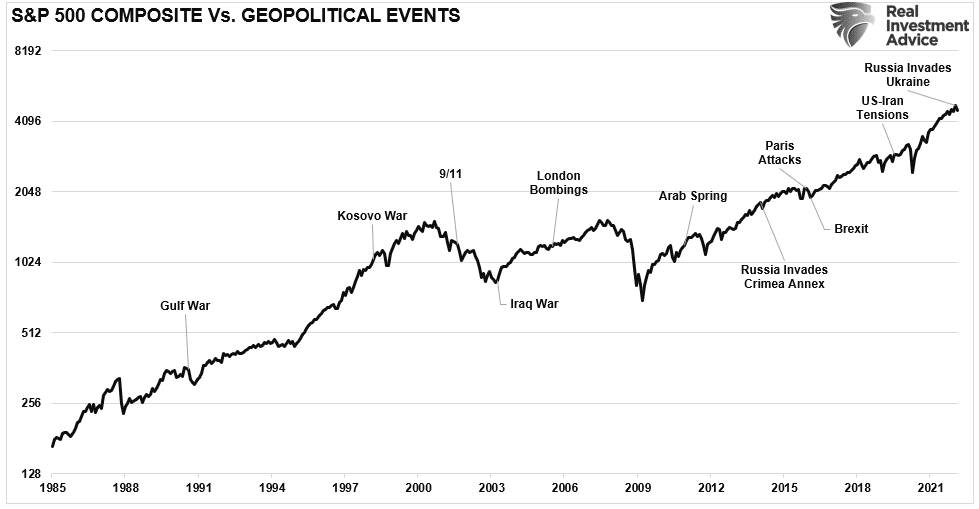
Notably, geopolitical events have only minor impacts on markets and tend to be short-lived. Therefore, making wholesale changes to portfolios based on geopolitical events has generally not worked out well for investors.
Adding the annual rate of change for the S&P 500 index provides further evidence that geopolitical events are not often a reason to avoid equities entirely.
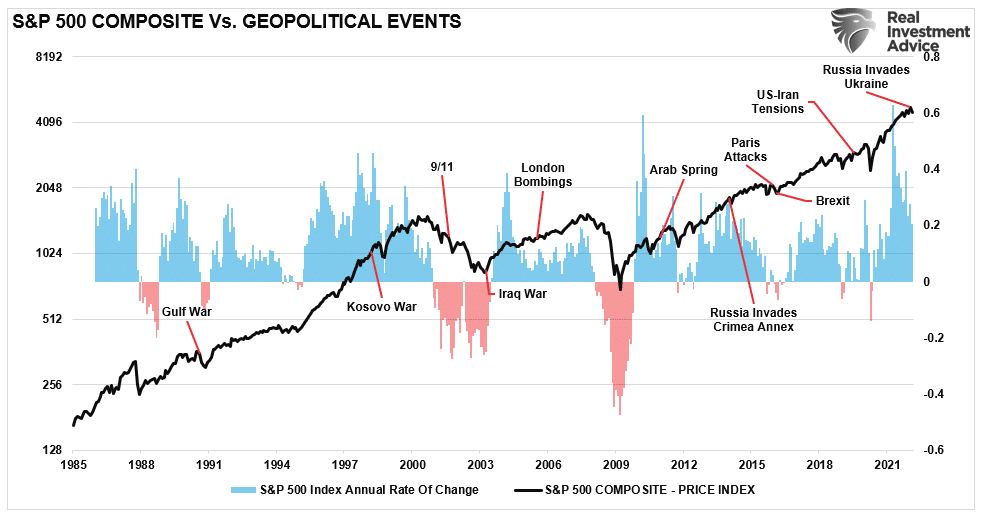
Two notable geopolitical events did coincide with more significant market declines. The first was the terrorist attack on the U.S. on 9/11. The second was the rise of US-Iranian tensions in 2019. While both events preceded more significant declines in the financial markets, they can not be attributed entirely to those events. In 2001, the bear market was already underway with the “Dot.com crash.” The decline in 2020 was a function of the pandemic-induced economic shutdown.
However, what does impact markets more than geopolitical events is monetary policy changes.
This Week’s MacroView
Will The Russia Invasion Slow The Fed?
Throughout history, the Fed has repeatedly considered “geopolitical risk” in its policy-making decisions. I suspect we will hear comments of the same in March.
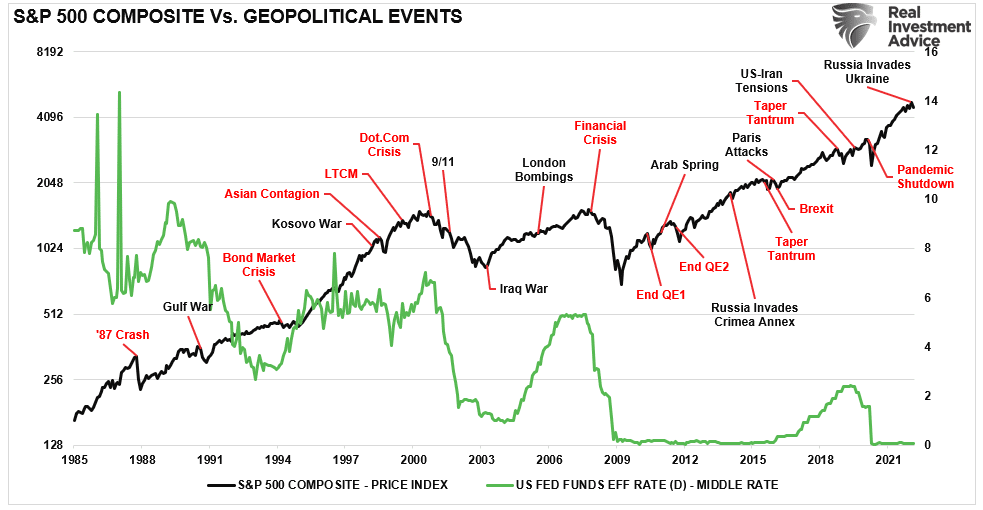
The chart below is the “effective Fed funds rate” versus geopolitical events. Notably, there is not a lot of correlation between the Fed’s monetary policies and geopolitical events.
However, as we noted yesterday, there is a higher correlation between the Fed’s monetary policy changes and related financial events, crises, and bear markets. If we overlay those events on the same chart, we see that those events are tied more closely to rising interest rates and the removal of monetary accommodation.
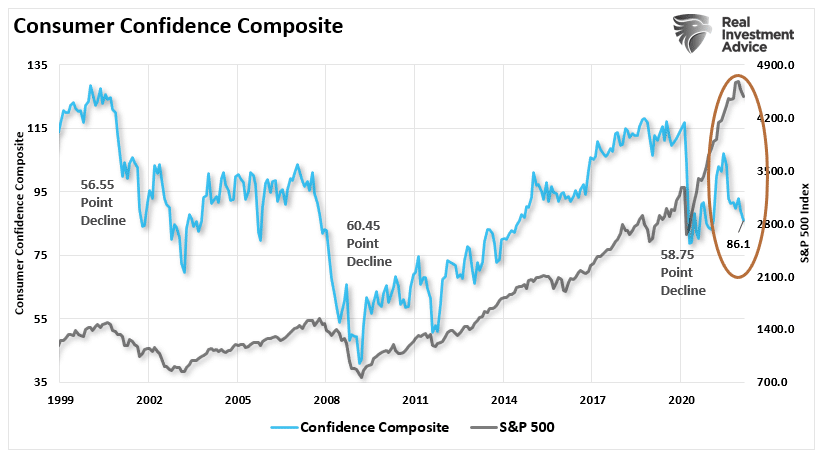
The Fed will very likely consider the “geopolitical risk” of the Russia invasion during their March meeting. Such does indeed argue for a slower approach to rate increases given the impact of geopolitical events on consumer confidence. As we noted:
“If consumption retrenches, so does the economy. The problem for the Fed is that consumer confidence is already declining, tightening monetary policy will exacerbate the decline.”
As Goldman Sachs concluded on Thursday:
“The combination of upside inflation risk and downside growth risk has mixed implications for monetary policy. Historically, Fed officials have sometimes preferred to delay major policy decisions until uncertainty surrounding geopolitical risks diminished. In some cases, such as after September 11, or during the US-China trade war, the FOMC has cut the funds rate.” – Via Zerohedge
With the Fed funds rate already at zero, cutting rates is not an option.
The more significant problem for the Fed is getting trapped at zero when the next recession begins.
The Fed is in a very tough spot.
How To Play The “Fed Trap”
As we have discussed over the last few weeks, we continue to “buy bonds” due to the deflationary forces rapidly building in 2022. To wit:
In our portfolio management process, we buy bonds for three reasons:
- Capital appreciation – the same reason we buy equities
- Total return – interest income plus capital appreciation
- Risk reduction – lower volatility asset to offset higher volatility assets (equities.)
If you start thinking about bonds as an “equity,” the analysis changes from an income strategy to a capital appreciation opportunity.
This past week, Michael Lebowitz, CFA, the co-portfolio manager at RIA Advisors, discussed another way to make a leveraged bet on falling yields.
Closed-end bond mutual funds (CEFs) have a unique structure that, at times, can produce larger price gains or losses than bonds and higher yields than traditional bond funds or ETFs. If we are correct that yields will decline soon, some fixed income CEFs can produce double-digit returns in a relatively short period.
There is little doubt that as the benefits of fiscal stimulus continue to erode over the coming quarters and the Fed raises interest rates, halts QE, and eventually reduces their balance sheet (QT), the economy will slow, and inflationary impulses will subside.
Such a result would help put a lid on rising interest rates and kick off the next bull market in bonds. While timing markets is difficult and yields can certainly rise further, we believe that yields will peak within the next few months, and CEFs will offer similar opportunities as in the past.
Every Friday, SimpleVisor subscribers receive a summary of five stocks that best epitomize a particular investment screening idea. This week’s report presents five fixed-income CEFs that should perform well if interest rates and inflation are peaking.

Portfolio Update – Use Rallies To Reduce Risk
The last point is the most important. While everyone remains focused on the Russia invasion of Ukraine, it is the Fed that remains the most significant risk to stocks. While we do expect a continued rally over the next few days, primarily from short-covering and too many “put options,” these strong counter-trend reflex rallies only exist during more meaningful correction processes.
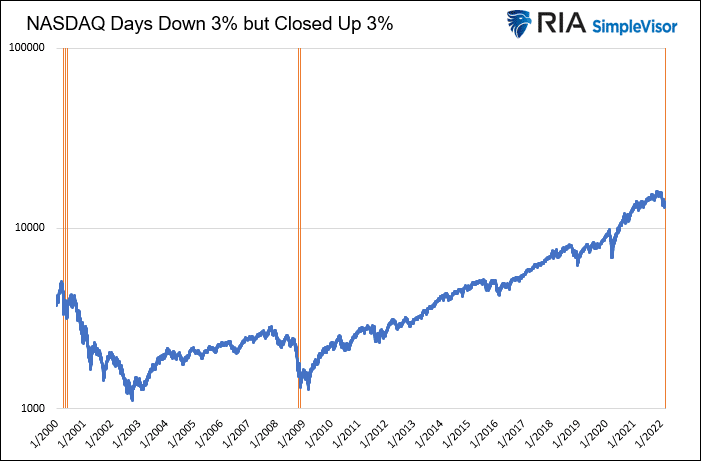
As Michael Lebowitz shows, since 2000, there are only 5-previous instances of the Nasdaq opening down 3% but closing up 3%. All of those instances occurred during the bear markets of 2000 and 2008. Such is one reason why we are remaining cautious near term.
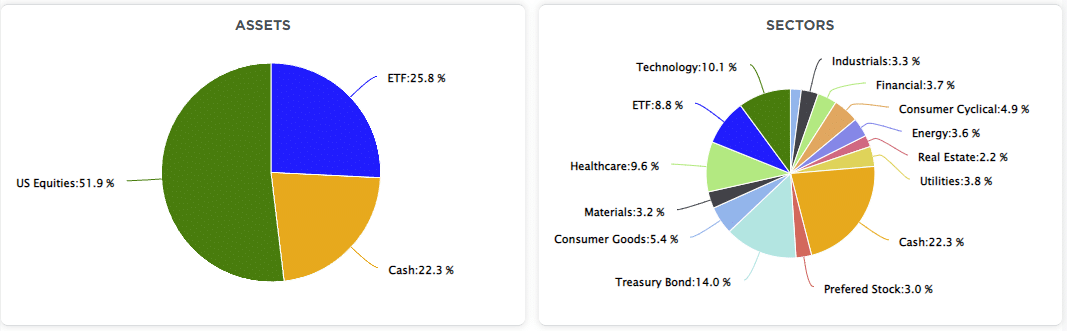
Over the last several weeks, we discussed that we reduced equity risk on the previous rally from an allocation perspective and added to our portfolio hedges. This week, we used the rally to reduce equity risk further.
If you didn’t like the decline in the market in January and February, we suggest using any rally towards the 200- and 50-day moving averages to further reduce risk and rebalance allocations.
It is extremely easy to get sucked into the media headlines and narratives. However, the worst thing you can do is panic sell or move into an overly defensive portfolio. We suggest creating a “bulletproof portfolio” if you want protection.
What Is A “Bulletproof Portfolio?”
A portfolio of low-risk investments, fixed income and a healthy level of cash will ensure that no matter what happens in the markets, or in your life, you will be in a financially sound position to handle it. A portfolio should be able to survive any uncertainty that arises and in today’s world, there are plenty of uncertainties to choose from. It isn’t difficult, or complicated, to build a portfolio that can deliver lower volatility, income, and capital preservation.
The portfolio should focus on:
- Fundamentally strong stocks that can deliver steady earnings growth.
- Stocks should be primarily dividend payers with a long history of dividend growth.
- Bonds to provide capital preservation and income.
- A healthy allocation to cash is a risk-free hedge against market volatility.
The financial markets will do one of two things to your future financial security:
- If you treat the financial markets as a tool to adjust your current savings for inflation over time, the markets will KEEP you wealthy.
- However, if you try and use the markets to MAKE you wealthy, your capital will shift to those in the first category.
Ample warning signs suggest the risks of having excessive equity exposure to the market outweigh the potential for reward.
At least for now.
Market & Sector Analysis
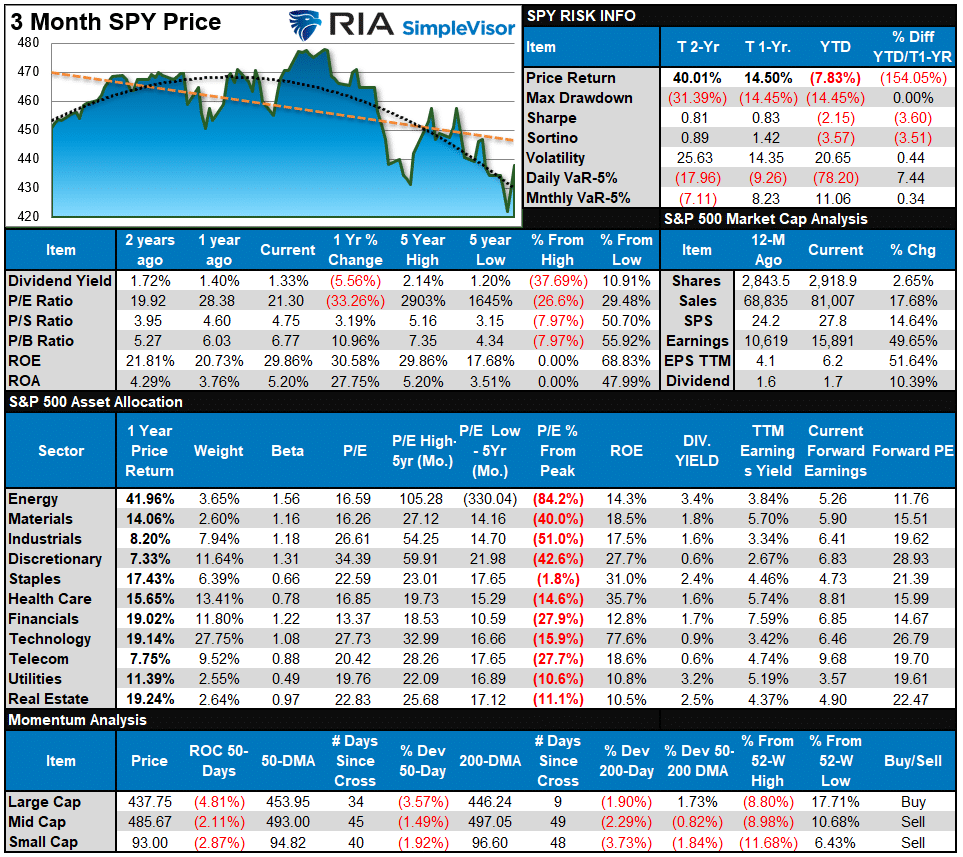
S&P 500 Tear Sheet
Relative Performance Analysis
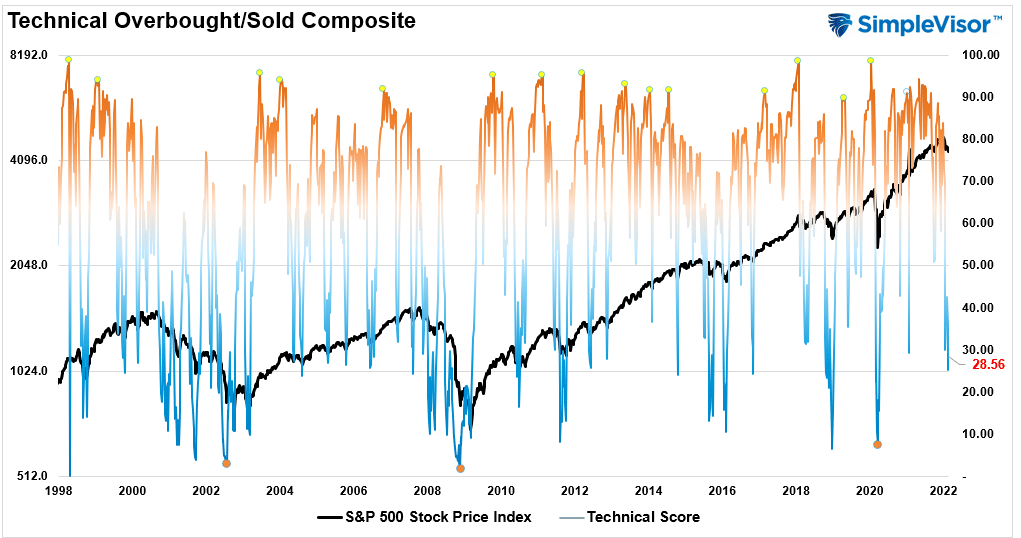
Technical Composite
The technical overbought/sold gauge comprises several price indicators (RSI, Williams %R, etc.), measured using “weekly” closing price data. Readings above “80” are considered overbought, and below “20” are oversold. The current reading is 28.56 out of a possible 100.
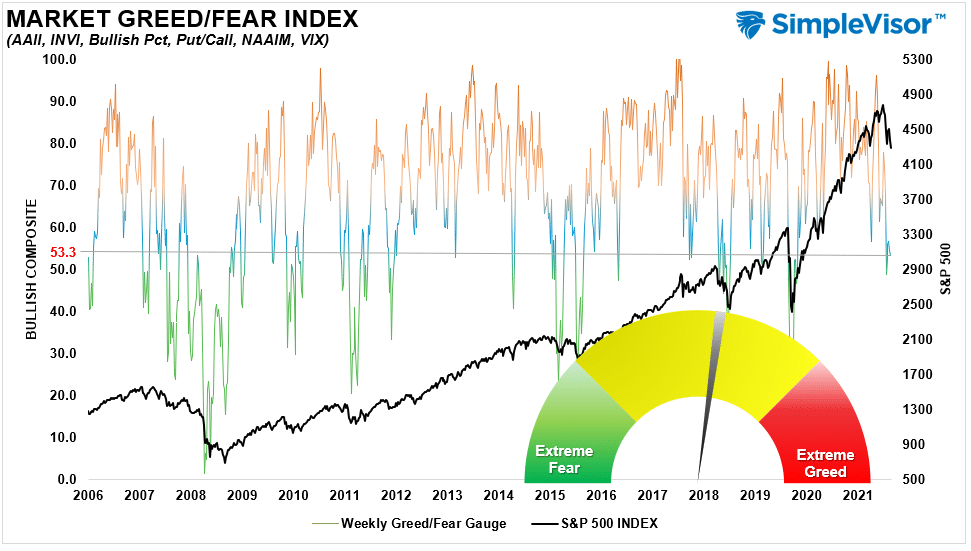
Portfolio Positioning “Fear / Greed” Gauge
Our “Fear/Greed” gauge is how individual and professional investors are “positioning” themselves in the market based on their equity exposure. From a contrarian position, the higher the allocation to equities, to more likely the market is closer to a correction than not. The gauge uses weekly closing data.
NOTE: The Fear/Greed Index measures risk from 0-100. It is a rarity that it reaches levels above 90. The current reading is 53.26 out of a possible 100.
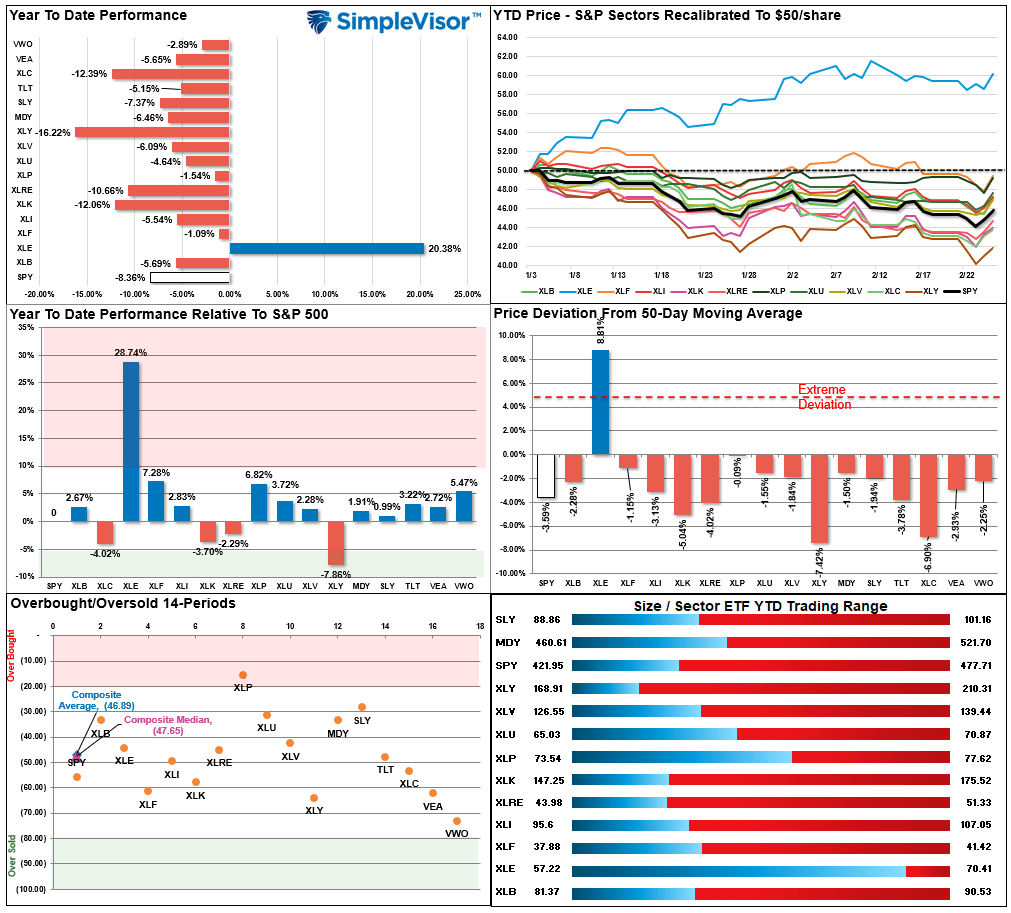
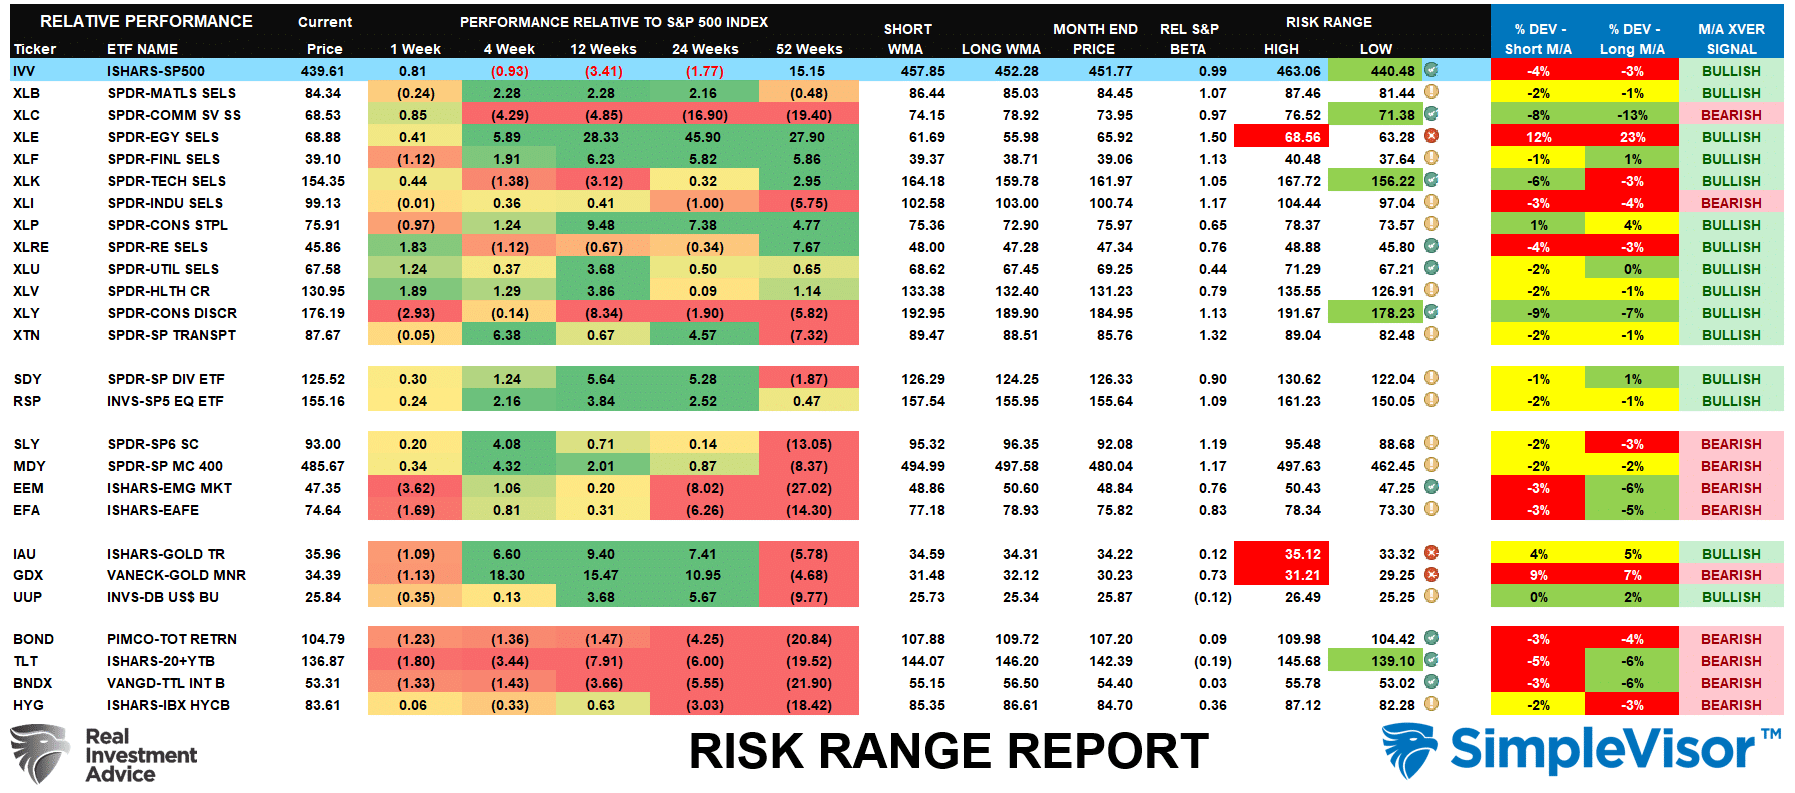
Sector Model Analysis & Risk Ranges
How To Read This Table
- The table compares each sector and market to the S&P 500 index on relative performance.
- “MA XVER” is determined by whether the short-term weekly moving average crosses positively or negatively with the long-term weekly moving average.
- The risk range is a function of the month-end closing price and the “beta” of the sector or market. (Ranges reset on the 1st of each month)
- Table shows the price deviation above and below the weekly moving averages.
- The complete history of all sentiment indicators is on under the Dashboard/Sentiment tab at SimpleVisor
Weekly Stock Screens
Each week we will provide three different stock screens generated from SimpleVisor: (RIAPro.net subscribers use your current credentials to log in.)
This week we are scanning for the Top 20:
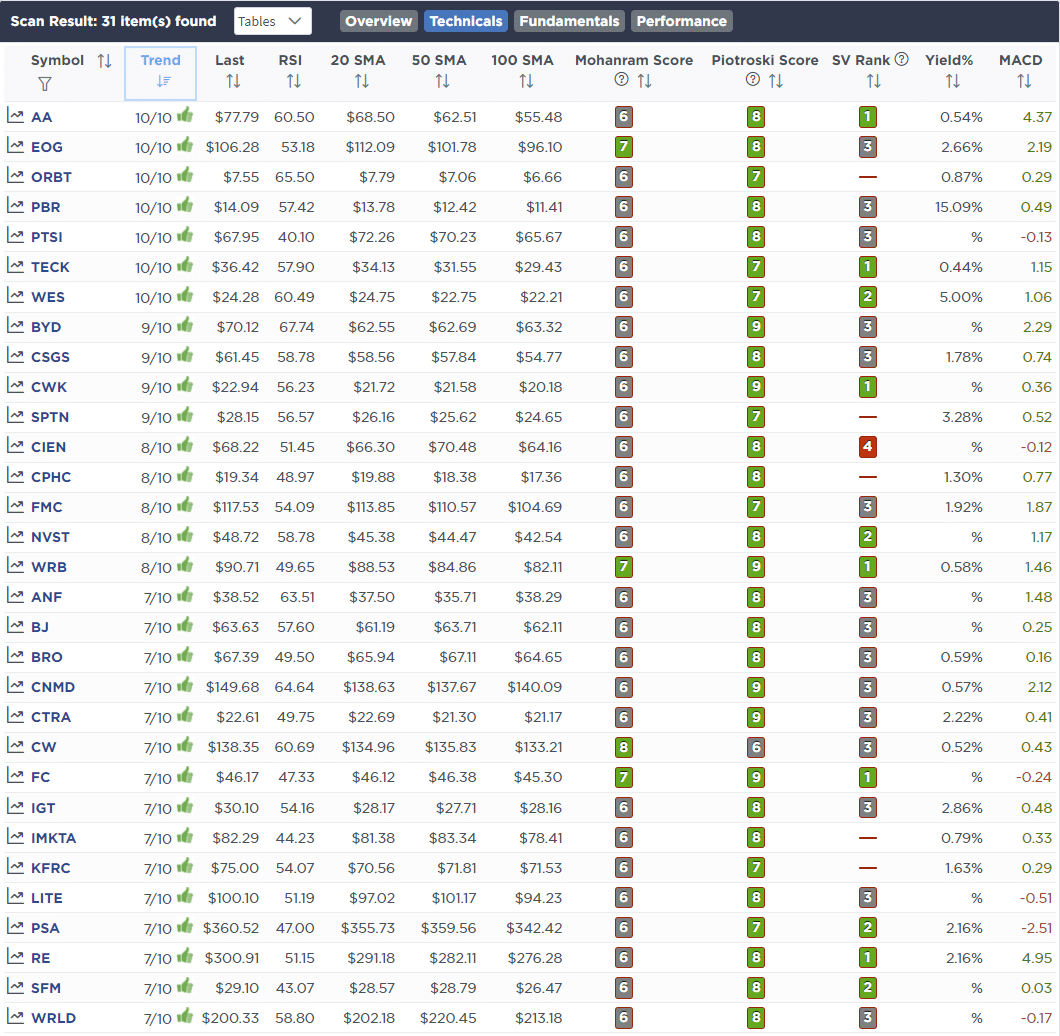
- Relative Strength Stocks
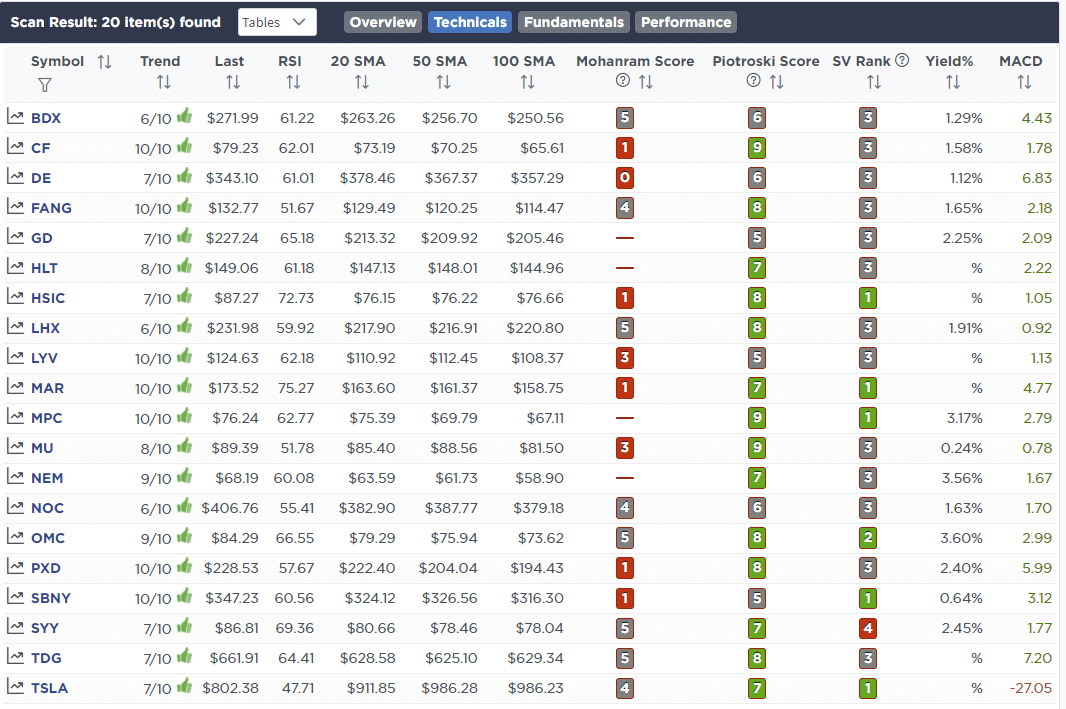
- Momentum Stocks
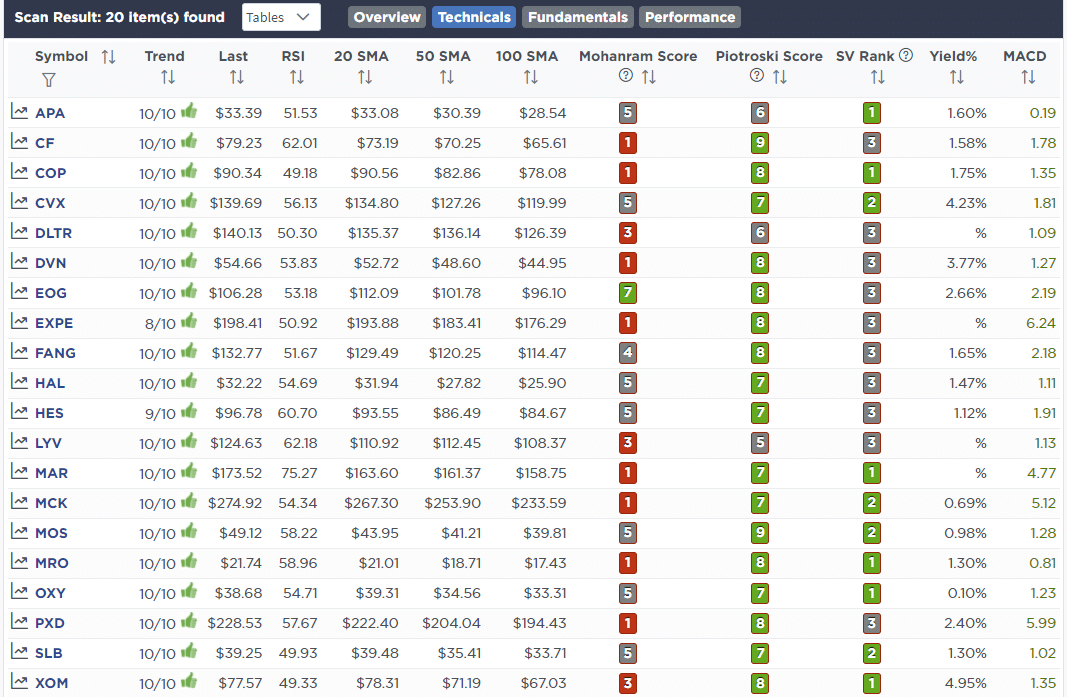
- Technically Strong With Strong Fundamentals
These screens generate portfolio ideas and serve as the starting point for further research.
(Click Images To Enlarge)
RSI Screen
Momentum Screen
Technical & Fundamental Strength Screen
SimpleVisor Portfolio Changes
We post all of our portfolio changes as they occur at SimpleVisor:
February 25th
We will be using the current rally to begin further reducing exposure in portfolios. As noted in this morning’s commentary:
“If we get some follow-through this morning, the market will negate the break of support on Wednesday and should set the market in motion for an initial retracement to the 200-dma.
With the market oversold and triggering a short-term buy signal, such a rally seems probable heading into the March FOMC meeting. We suggest using this rally to further reduce risk and rebalance holdings accordingly.”
Equity Model
- Selling 1% of ADBE reducing holding to 1% of portfolio.
- Sell 1% of PFF bringing it to 3%
ETF Model
- Sell 1% of PFF bringing it to 3%

Lance Roberts, CIO
Have a great week!


