
Inside This Week’s Bull Bear Report
- The Bear Market Has Been Cancelled
- J-Pow Throws In The Towel
- How We Are Trading It
- Research Report – Is The Fed Trying To Wean Markets Off Monetary Policy
- Youtube – Before The Bell
- Stock Of The Week
- Daily Commentary Bits
- Market Statistics
- Stock Screens
- Portfolio Trades This Week
The Bear Market Has Been “Cancelled.”
Last week’s message asked the question of whether the market’s break above the long-running downtrend line was a “head fake?” To wit:
As we noted, the inverse ‘head-and-shoulder’ pattern already suggests a market bottom has formed. A solid break above the downtrend line (with a successful retest) would confirm the completion of that pattern. Notably, the 50-DMA is rapidly closing in on a cross above the declining 200-DMA. Such is known as the ‘golden cross’ and historically signifies a more bullish setup for markets moving forward.
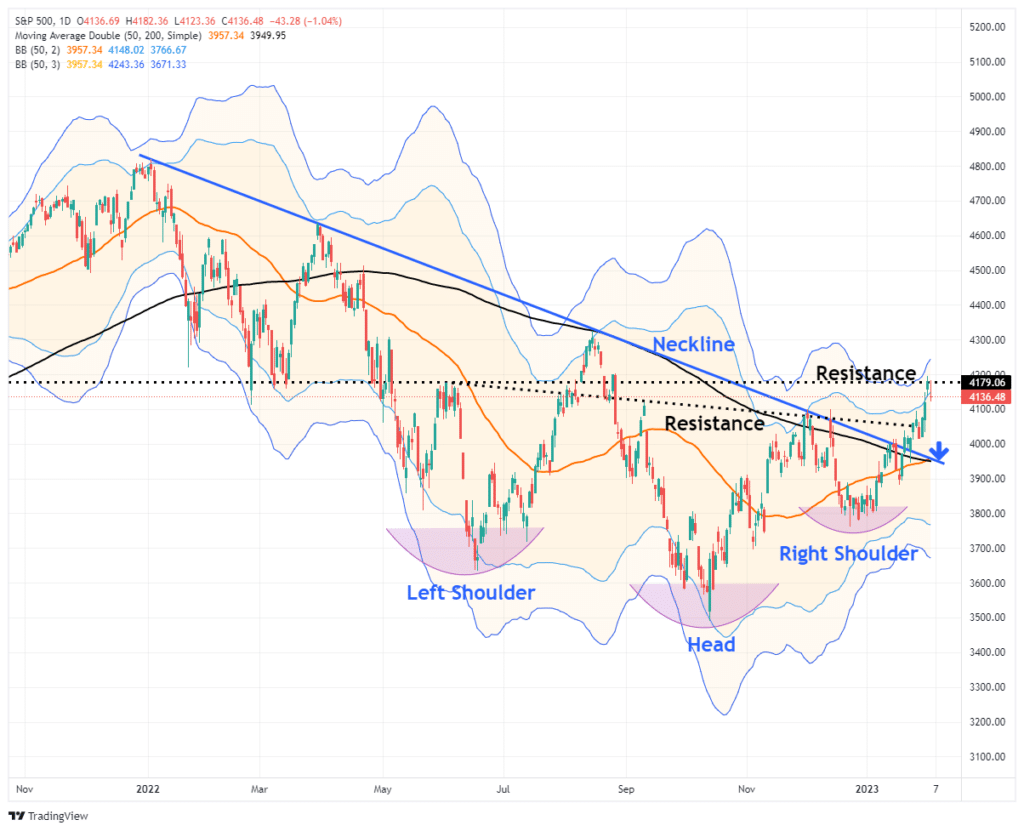
The market surge continued last week but ran into resistance on Friday as markets are pushing well into 3-standard deviations above the 50-DMA. However, while the weakness on Friday was not unexpected, it is also necessary to determine whether the current breakout is legitimate.
If the “bear market” is “canceled,” we will know relatively soon. To confirm whether the breakout is sustainable, thereby canceling the bear market, a pullback to the previous downtrend line that holds is crucial. Such a pullback would accomplish several things, from working off the overbought conditions, turning previous resistance into support, and reloading market shorts to support a move higher. The final piece of the puzzle, if the pullback to support holds, will be a break above the highs of this past week, confirming the next leg higher. Such would put 4300-4400 as a target in place.
A break BELOW the downtrend line, and the current intersection of the 50- and 200-DMA, will suggest the breakout was indeed a “head fake.” Such will confirm the bear market remains, and a retest of last year’s lows is likely.
Given that we don’t know with certainty where the market is headed next, we are remaining underweight equities at the moment and increased cash levels a bit last week due to the overbought conditions of the market. If the market confirms the “cancelation” of the bear cycle, we will aggressively add risk for the next leg higher. If not, we will add to bonds and reduce equity risk further for the next leg lower.
We will have to wait and see what happens now that “J-Pow threw in the towel.”
Need Help With Your Investing Strategy?
Are you looking for complete financial, insurance, and estate planning? Need a risk-managed portfolio management strategy to grow and protect your savings? Whatever your needs are, we are here to help.

J-Pow Throws In The Towel
This past week, the markets jumped higher as Jerome Powell (or J-Pow) threw in the towel on being “hawkish.” Such seems to suggest that political demands from the Democratic side of the aisle had some impact on political independence.

The change in tone from the Fed was marked given their previous hawkishness. As we discussed last week, financial conditions are a risk to the Fed.
“The risk to the markets is that while the bulls have been driving asset prices higher since the beginning of this year, that increase in price works against the Fed’s agenda. The goal of tighter monetary policy by the Fed is to tighten monetary conditions to slow economic growth, thereby reducing inflation. However, higher asset prices boost consumer confidence and loosen monetary conditions. As noted by Liz Ann Sonders, financial conditions have eased dramatically since October.”

The change in tone from the Fed was quick, given J-Pow’s focus on financial conditions at the FOMC just six weeks ago.
“Officials seek to reduce inflation by slowing the economy through tighter financial conditions—such as higher borrowing costs, lower stock prices, and a stronger dollar—which typically curb demand.”
That language of tighter conditions was replaced with comments that financial conditions have tightened significantly over the past year. He noted that “it is important that overall financial conditions reflect policy restraints put in place” but added that “our focus is not on short-term moves, but on sustained changes to financial conditions.“
It seems odd that while the Fed is still working to tighten monetary conditions, which are weakening, as shown above, they would choose to ignore the one thing they can control. Furthermore, financial conditions are now easier than last September when Powell “unleashed hell” at the Jackson Hole summit.
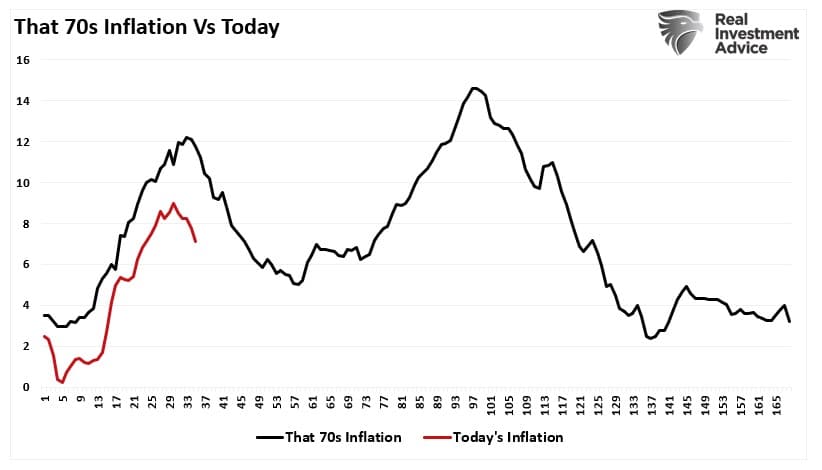
While Powell ignited the bulls with the flubbed comment regarding financial conditions, they absolutely do matter. J-Pow’s most significant concern should be a potential repeat of the 70s, where inflation ebbed and then reignited.
So the question is, why now?
That answer can be summed up in one word: “Disinflation.”
Disinflation Is The Word
No fewer than a dozen times on Wednesday did J-Pow utter the word “disinflation.” As Omair Sharif of Inflation Insights noted:
“Not sure I get this obsession with a ‘couple’ of more rate hikes as being dovish. I thought it was dovish after I read the statement! The change in the inflation language in the statement combined with the change in the language from ‘pace’ to ‘extent’ suggested that they were debating when to pause and indicated that 5.1%, which was the median dot for 2023 in the December SEP, was the ceiling, barring any big changes in the data.”
J-Pow’s repeated discussion of disinflation ignited the bulls as they entirely disregarded the language of higher rates. The key quote from Powell came about 20 minutes into his press conference, when, in response to a question from Reuters’ Howard Schneider, Powell said, in part: “We can now say, for the first time, that the disinflationary process has started. We can see that.”
This is a crucial statement, as noted by Yahoo Finance on Thursday:
“Unlike inflation (prices going up) or deflation (prices going down), both of which economists fear in large quantities, disinflation means prices rise at a slower pace. Headline CPI, for example, rose 6.5% over the prior year in December after having jumped as much as 9.1% over the prior year in July. This deceleration in the pace of price increases is disinflation.“
That deceleration of inflation is notable but remains elevated relative to historical averages. Such suggests that while the Fed is beginning to think about pausing its rate hikes, the concern of inflation is not over.
However, while the deceleration in prices may allow J-Pow to cease hiking rates, there are three crucial points to understand.
- Ceasing rate hikes is not the same as cutting them.
- Disinflation is not the same as the avoidance of a recession.
- As prices decline, disinflation also poses a risk to equities.
The Risk To Equities
The bullish hope is that a cessation of the rate of hikes by the Fed, combined with a slower pace of inflation, will equate to an economic “soft landing.” As we recently discussed, a “soft landing” is a bit of a Fed myth. To wit;
“There were three periods where the Federal Reserve hiked rates and achieved a ‘soft landing,’ economically speaking. However, the reality was that those periods were not ‘pain-free’ events for the financial markets.”
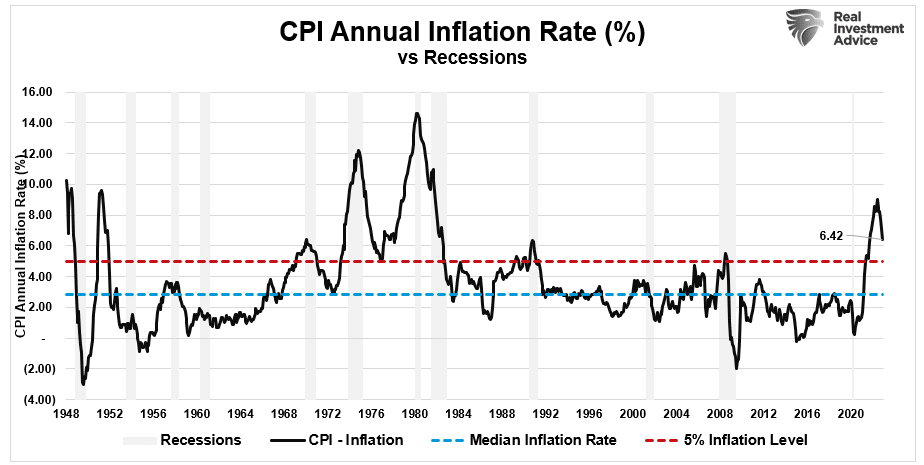
Such is particularly the case when inflation is running well above 5%. Throughout history, there are no instances when inflation ran above 5% annualized, with an inverted yield curve that did not result in a recession. Zero.
However, while the bulls are excited about the prospect of disinflation and a Fed “pause” on rate hikes, they have overlooked two key points.
- The lag effect of monetary policy changes
- The impact of disinflation on earnings.
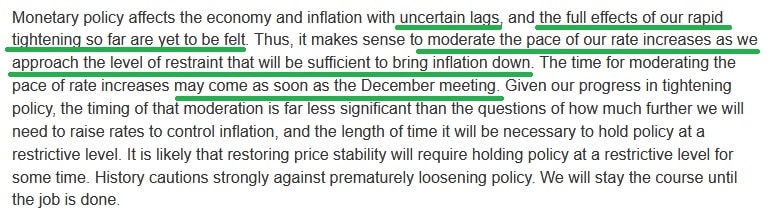
J-Pow was clear on two key points which should not get dismissed. The first was that while the Fed will likely hike two more times, they are NOT cutting rates anytime soon. Secondly, J-Pow stated that the lag effect of previous rate changes had not been fully felt yet.
The drag of higher rates on economic growth will lead to less economic activity, which will continue to slow the rate of inflation. However, as economic growth slows, combined with disinflation, so do corporate earnings and profit margins. As we discussed previously, disinflation is a substantial risk to the bulls.
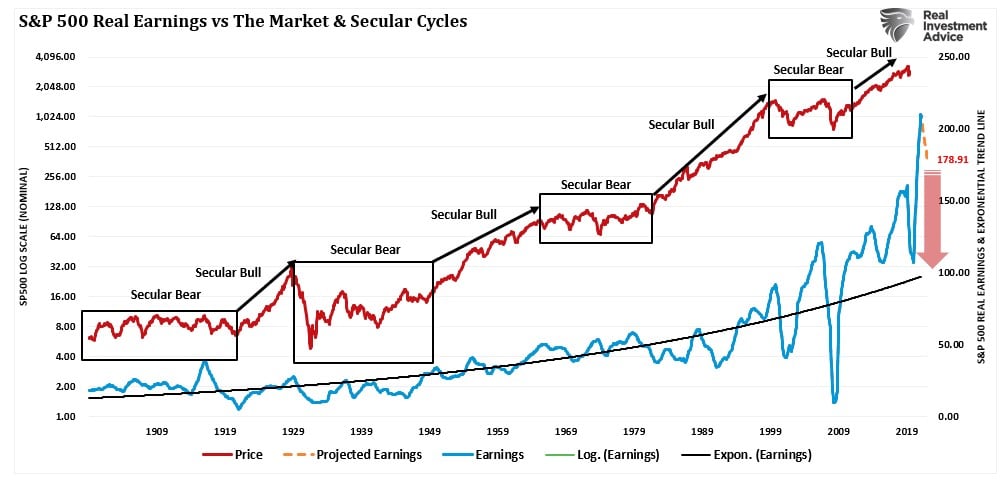
“The problem of overvaluation in a slow-growth economic environment is problematic. The massive surge in earnings during the pandemic-driven shutdown is unsustainable as the economy normalizes. Massive stimulus programs, combined with enormous unemployment, led to surging profits that are not replicable in the future. As shown, earnings are one of the most mean-reverting data series in existence, and ultimately if earnings don’t revert, capitalism is no longer functioning correctly.”
Given that the fiscal interventions and supply chain shutdown gave corporations massive pricing power, the lack of both must equate to a decline in earnings. Given that earnings can not outgrow the economy over the long term, the bulls are likely mistaken in assuming current valuations reflect fair value.
The outcome seems inevitable without either the Federal Reserve reverting to quantitative easing or the Government injecting more fiscal stimulus. J-Pow has strongly commented that neither a reversal of QT nor rate cuts are on the table anytime soon.
In other words, disinflation risk is likely Wall Street’s most significant blind spot this year.
How We Are Trading It
As portfolio managers, we must trade the market we have, not the one we want. For the moment, we are in a “bull market.” As noted, the “bear market” of 2022 has been canceled, but most likely not permanently. With the market overbought short-term and getting well deviating from underlying moving averages, we are maintaining our underweight equity positioning. However, we will likely move our portfolios back to full target portfolio allocations across asset classes on a pullback to support that holds.
Does this mean that the bear market is permanently over? No. We suspect that we will see another downturn sometime this year as the impact of tighter Fed policy and disinflation is realized in corporate earnings and margins. However, for now, price momentum has put the bulls in charge, and we want to participate in those gains.
As we discussed in our recent post on “Contrarianism,” there are plenty of reasons to be bearish, but that is precisely when markets tend to do the opposite of what you expect.
Such is the point where we are today. The technical improvements in the market suggest investors should be buying. It’s hard. It also doesn’t mean it will immediately work, as the markets could correct first before the final bottom. Until the technical backdrop tells us differently, we are back to “buying dips.”
On a pullback to support, we will bring our allocations up to full weightings and raise stops accordingly.
However, that does not mean we won’t reduce those weightings again when the technicals change. As Greg Feirman said:
“The stock market is a crowd of people trying to figure out what’s happening. It is a subjective phenomenon, not an objective one. Can 10,000 Frenchmen be wrong?”
Yes, they can. If, in fact, the underlying conditions do not support the premise that the bear market has been canceled, eventually, the crowd will get the message, and the market will roll over again. It may not happen today or tomorrow, but it will happen eventually if economic reality does not support this rally. It’s hard to keep your head in the heat of the moment, but 10,000 Frenchmen can be wrong – and I’m betting they are.
We agree.
Research Report
Subscribe To “Before The Bell” For Daily Trading Updates (Formerly 3-Minutes)
We have set up a separate channel JUST for our short daily market updates. Be sure and subscribe to THIS CHANNEL to receive daily notifications before the market opens.
Click Here And Then Click The SUBSCRIBE Button
Subscribe To Our Youtube Channel To Get Notified Of All Our Videos
Stock Of The Week In Review
Following our three-part series on dividends and value, it’s time to switch gears and search from a different perspective. We’re going for growth this week by screening the constituents of Cathy Wood’s ARKK ETF. The ETF’s theme is “disruptive innovation”- per ARK’s webpage:
ARK defines “disruptive innovation’’ as the introduction of a technologically enabled new product or service that potentially changes the way the world works.
Thus, the stocks in our initial scanning populations have already garnered expectations for high growth. Our objective is to identify five constituents offering growth at a (somewhat) reasonable price. We utilize the r-squared of 5y sales growth to check for consistency in sales growth. The closer to 1, the more consistent growth was over the period.
Here is a link to the full SimpleVisor Article For Step-By-Step Screening Instructions.
Here is one of the companies we screened.

Login to Simplevisor.com to read the full 5-For-Friday report.
Daily Commentary Tidbits
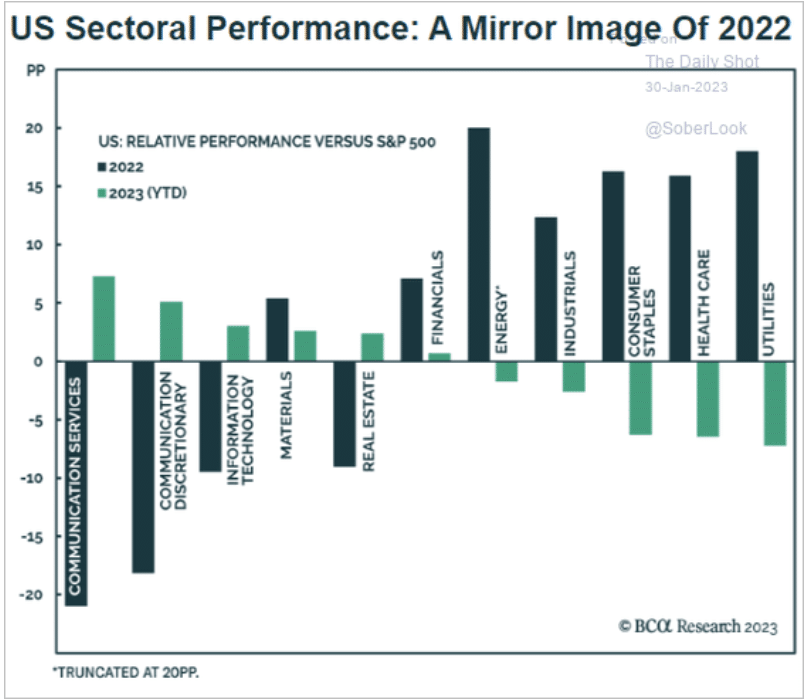
Sector Rotation – 2022 vs. 2023
While only a month into the new year, 2023 has been marked by a sector rotation that has mainly been opposite of last year’s rotation trends. Thus far, consumer staples, utilities, and healthcare stocks are underperforming the S&P 500 by about 8%. In 2022, those three sectors outperformed as investor rotations focused on conservative, dividend, and value traits. This year, communications, last year’s worst-performing sector, is beating the S&P 500 by approximately 10%. Following closely behind is 2022’s second-worst performer, consumer discretionary. The graph below shows what worked last year is not working this year and vice versa.
The big question in 2023 is whether or not last year’s sector rotation trends will hold again in 2023. If a durable bottom has formed, the economy has a soft landing, and the Fed gently lowers rates, we should expect high growth and beaten-down sectors to follow their January performance. However, a deeper recession bodes well for 2022’s conservatism.
Click Here To Read The Latest Daily Market Commentary (Subscribe For Pre-Market Email)
Bull Bear Report Market Statistics & Screens

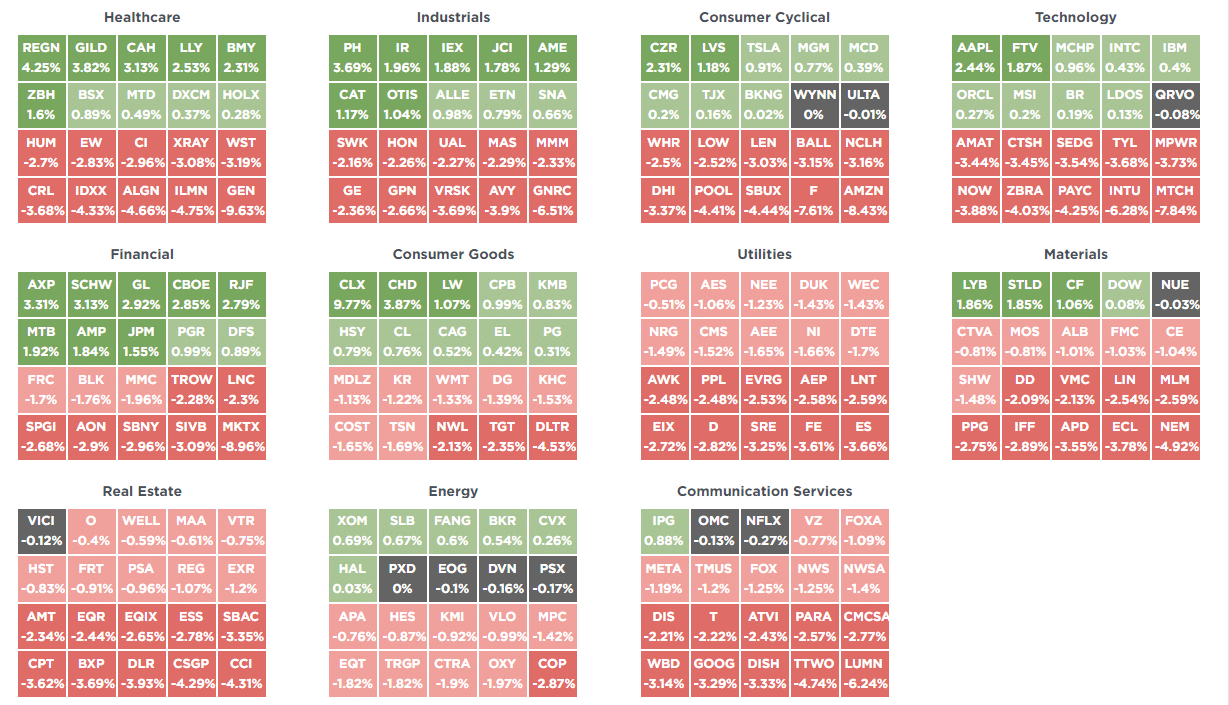
SimpleVisor Top & Bottom Performers By Sector
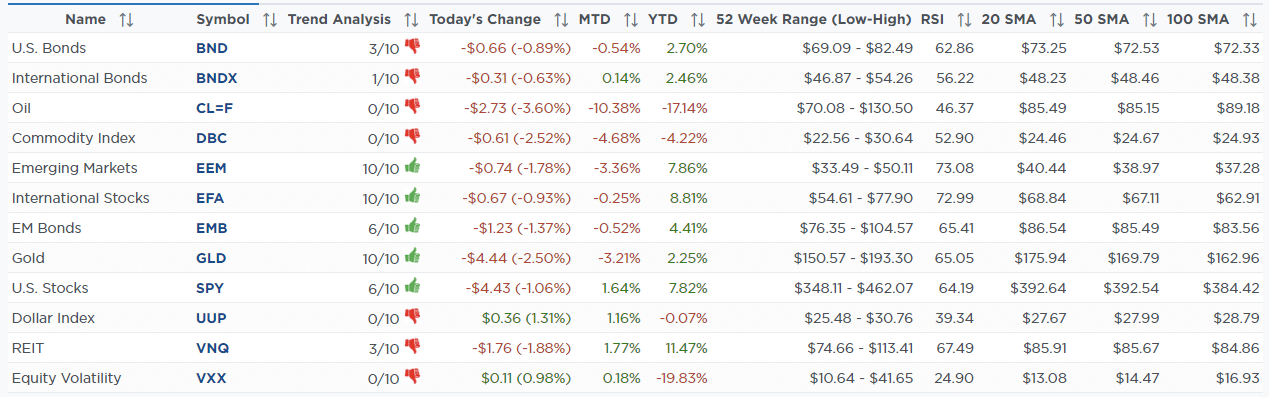
Broad Market Performance
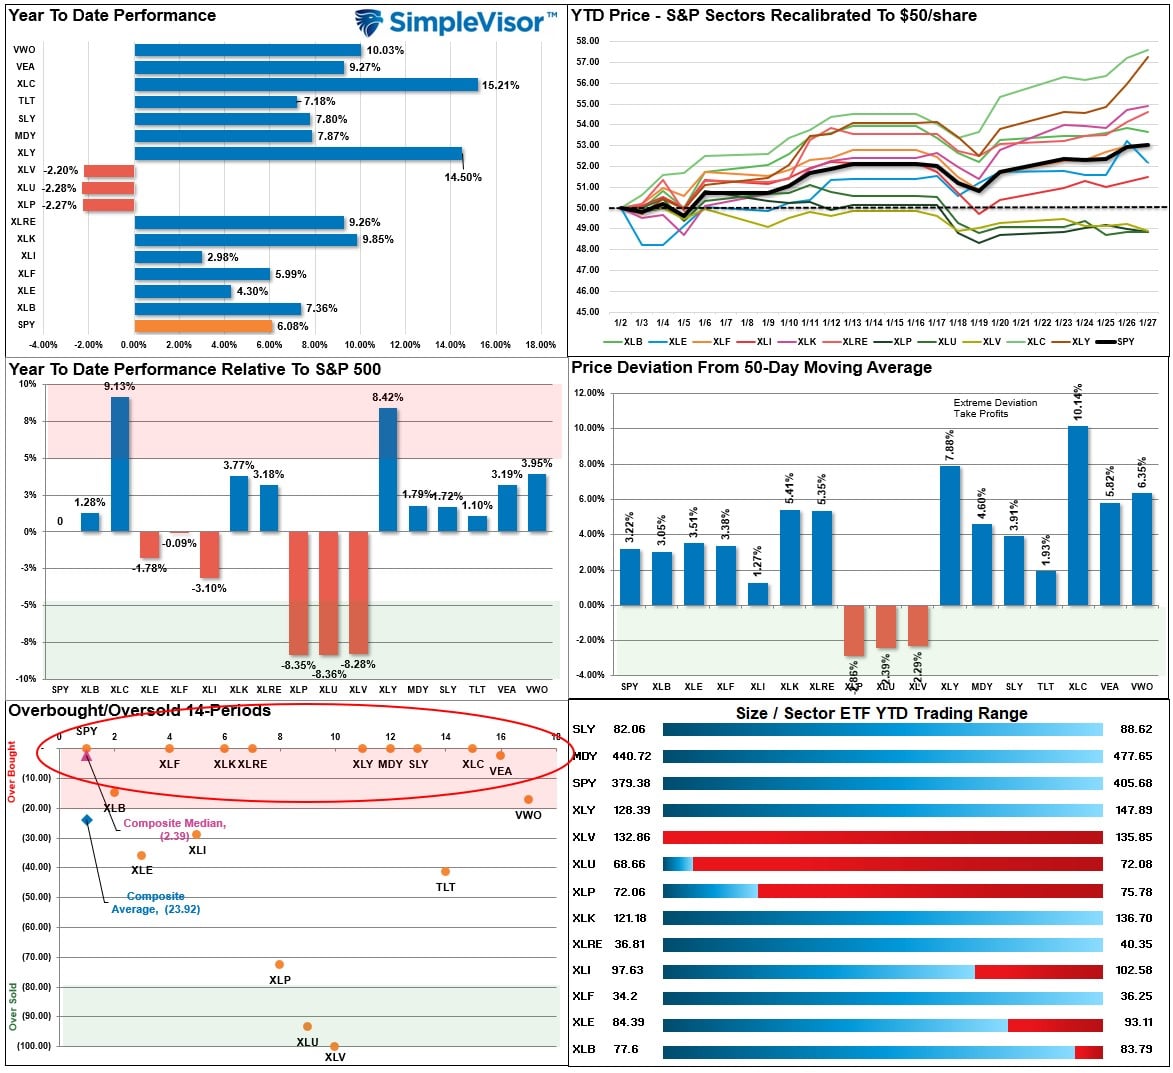
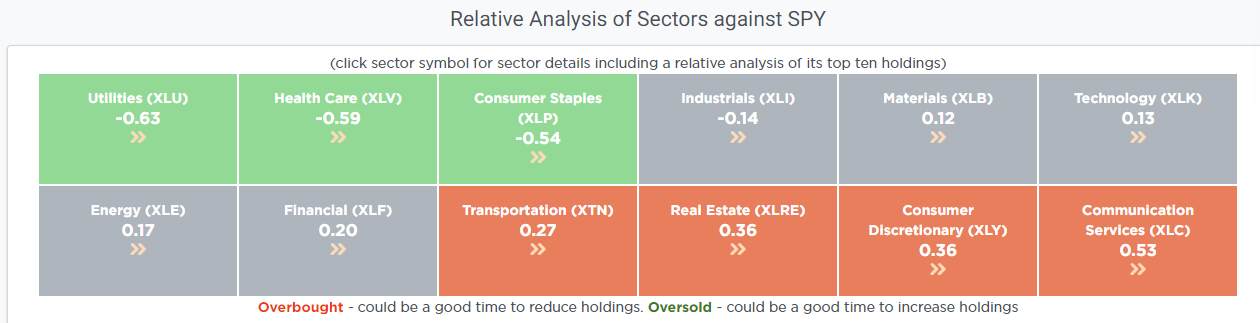
Relative Performance Analysis
As noted last week, while still hated, Technology has improved markedly, while Staples, Healthcare, and Utilities are the most oversold due to the recent rise in bond yields. The massive surge in Communications and Discretionary in January leaves these sectors ripe for profit-taking. With many sectors and markets trading well above normal monthly ranges (see risk range report below), look to take some profits and rebalance risk. We will likely have a short-term market correction within the next week or two.
Technical Composite
The technical overbought/sold gauge comprises several price indicators (RSI, Williams %R, etc.), measured using “weekly” closing price data. Readings above “80” are considered overbought, and below “20” are oversold. Markets tend to peak when those readings are at 80 or above, which suggests profit-taking and risk management are prudent. The best buying opportunities exist when those readings are 20 or below.
The current reading is 79.51 out of a possible 100 and rising. Remain long equities for now.

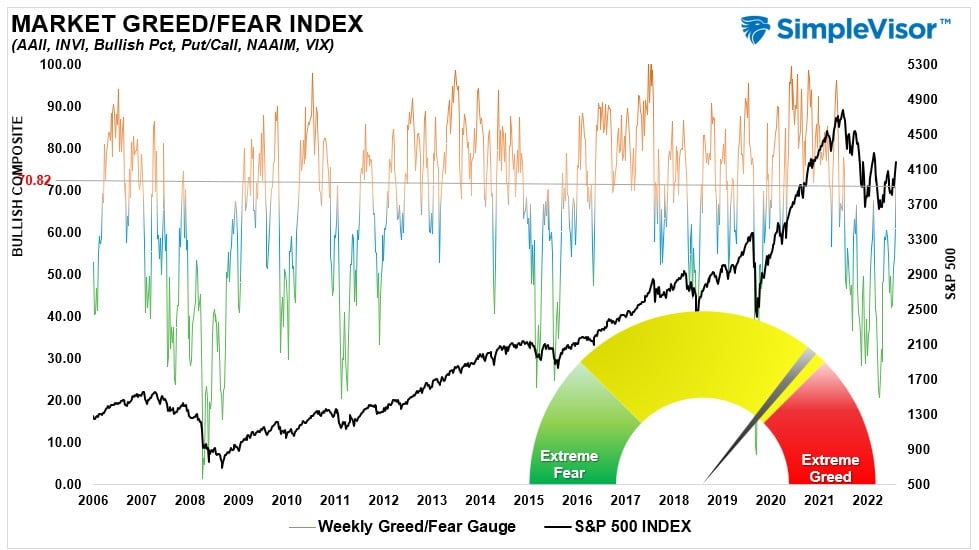
Portfolio Positioning “Fear / Greed” Gauge
The “Fear/Greed” Gauge is how individual and professional investors are “positioning” themselves in the market based on their equity exposure. From a contrarian position, the higher the allocation to equities, the more likely the market is closer to a correction than not. The gauge uses weekly closing data.
NOTE: The Fear/Greed Index measures risk from 0 to 100. It is a rarity that it reaches levels above 90. The current reading is 70.82 out of a possible 100.
Sector Model Analysis & Risk Ranges
How To Read This Table
- The table compares the relative performance of each sector and market to the S&P 500 index.
- “M” XVER” “Moving Average Cross Over) is determined by the short-term weekly moving average crossing positively or negatively with the long-term weekly moving average.
- The risk range is a function of the month-end closing price and the “beta” of the sector or market. (Ranges reset on the 1st of each month)
- The table shows the price deviation above and below the weekly moving averages.
As noted last week, “Despite the short-term volatility, the bullish backdrop remains with numerous sectors and markets back on intermediate-term weekly “buy signals.” Continue to look for pullbacks in areas where you want to add exposure and “buy dips” accordingly. Communications, Technology, and Transportation are already trading outside their normal risk ranges in the first 3-days of the month. Energy and Gold started out the month with a correction. Look to add exposure to sectors that are strengthening in terms of relative performance (moving from red bands towards green over the previous weekly periods) and are on bullish buy signals.

Weekly SimpleVisor Stock Screens
Each week we will provide three different stock screens generated from SimpleVisor: (RIAPro.net subscribers use your current credentials to log in.)
This week we are scanning for the Top 20:
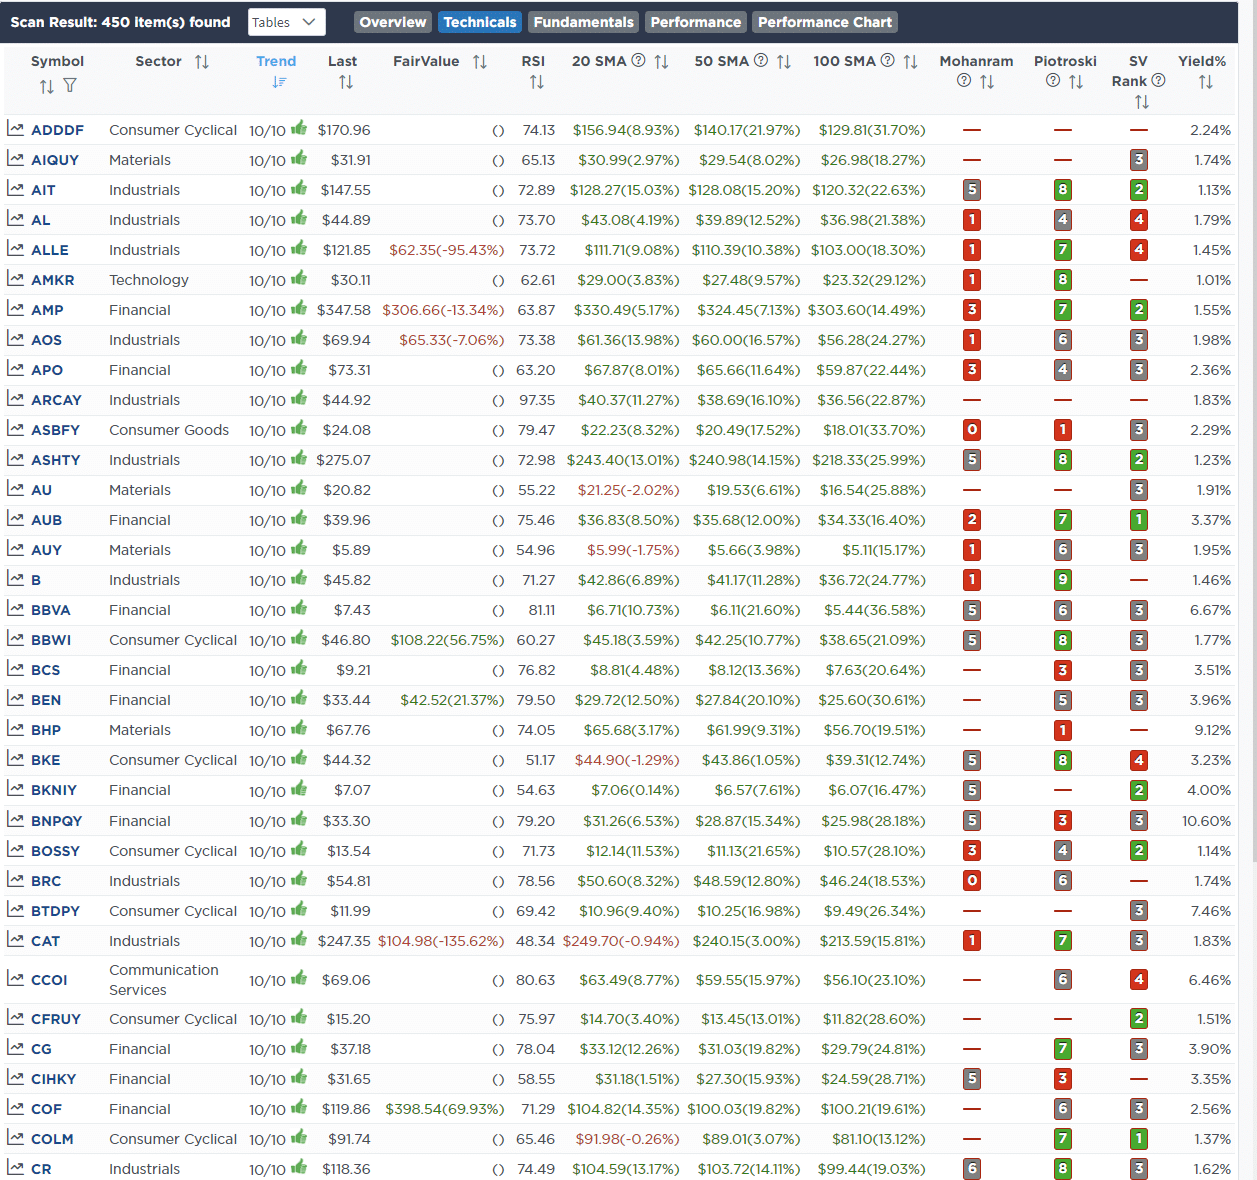
- Relative Strength Stocks
- Momentum Stocks
- Highest Rated Stocks With Dividends
These screens generate portfolio ideas and serve as the starting point for further research.
(Click Images To Enlarge)
RSI Screen
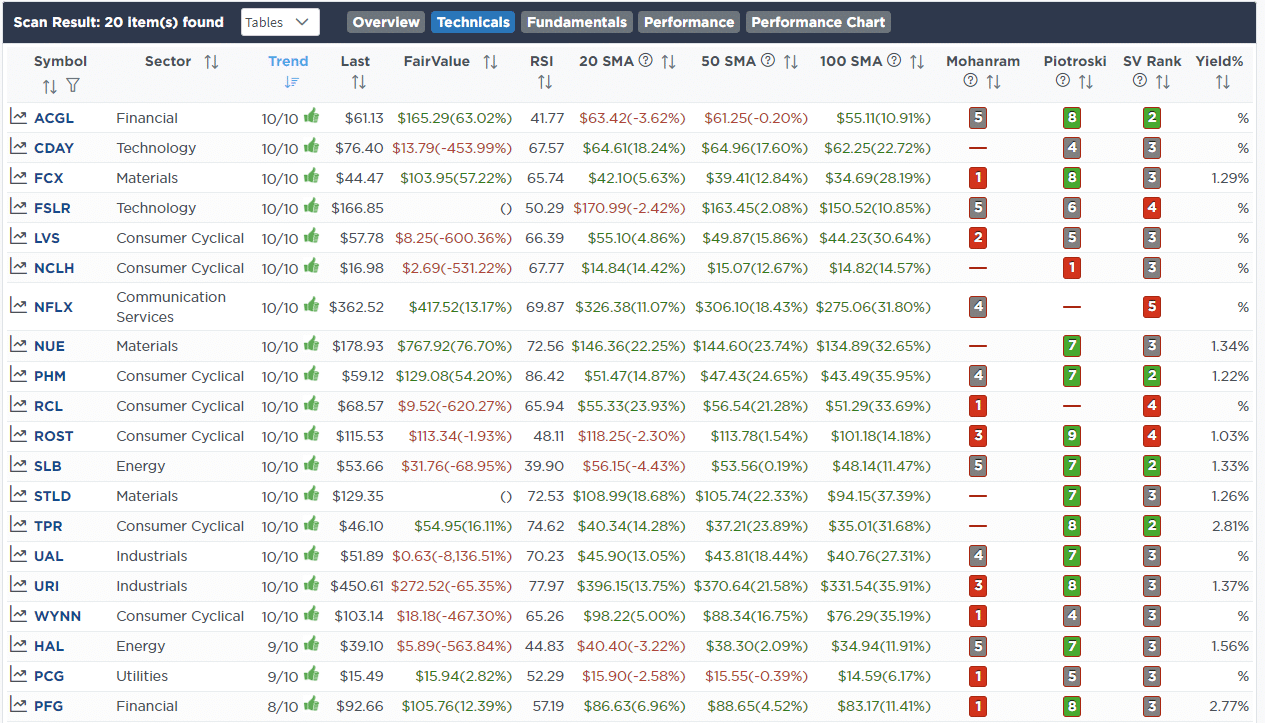
Momentum Screen

Highest Rated Stocks With Dividends
SimpleVisor Portfolio Changes
We post all of our portfolio changes as they occur at SimpleVisor:
January 30th
“This morning we are taking some gains off the table in our S&P 500 Equal Weight Index (RSP) ahead of the Federal Reserve meeting on Wednesday. We suspect that Powell could be extremely hawkish, which could further knock markets back. There is a cluster of support currently between the 20-, 50- and 200-DMAs, which, if the market holds, will confirm the recent bullish breakout. If such is the case, we will increase equity allocations accordingly.
Also, as noted in our Relative Analysis page, we are taking some profits in Communications and Technology, which are extremely overbought, and adding to Healthcare, which is very oversold. If the market pulls back, we should see some rotation between these sectors.”
Equity Model
- Sell 100% of the S&P 500 Equal Weight Index (RSP)
- Reduce Comcast (CMCSA) and Nvidia (NVDA) back to model weights of 1.5% and 0.5%, respectively.
- Increase CVS Healthcare (CVS) to 3% of the portfolio.
ETF Model
- Sell 100% of the S&P 500 Equal Weight Index (RSP)

Lance Roberts, CIO
Have a great week!

