FOMC Minutes Excites The Bulls


Inside This Week’s Bull Bear Report
- Market Really Overbought For Now
- FOMC Minutes Excites The Bulls
- 50% Retracements In The 60-70s
- How We Are Trading It
- Research Report – Why Long-Term Returns Are Unsustainable
- Stock Of The Week
- Daily Commentary Bits
- Market Statistics
- Stock Screens
- Portfolio Trades This Week
Market Really Overbought For Now
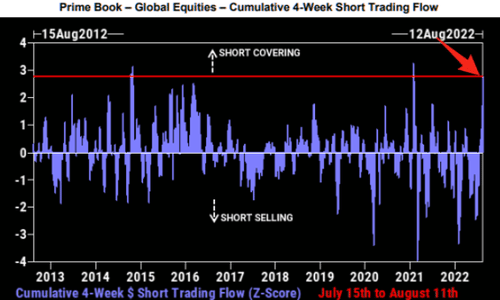
Over the last 10 weeks, the market staged an impressive rebound from the June lows, increasing nearly 17%. That rise also reversed the vast majority of the previous “extreme bearish” sentiment as “Reddit Traders” plunged back into the “Meme Stock” game.

As discussed in last week’s report, the bearish reversal has been swift and caught many traders and investors flatfooted. Short-covering has been an essential driver of the advance, which has now hit record levels.
As we will discuss momentarily, the recent FOMC minutes also added to the bullish thesis by suggesting the Fed may be closer to slowing the pace of rate hikes as well. Furthermore, the market’s technical backdrop has also turned more bullish.
For investors, the market is now back to highly overbought conditions. As shown, the market is not only testing resistance at the 200-dma but is also well deviated above the 50-dma with the Relative Strength Index (RSI) back to more extreme overbought levels. The sell-off on Friday was expected, but we will have to wait and see if it is a one-day dip or a more sizeable retracement. We suspect we may see the latter with the MACD close to a sell signal.
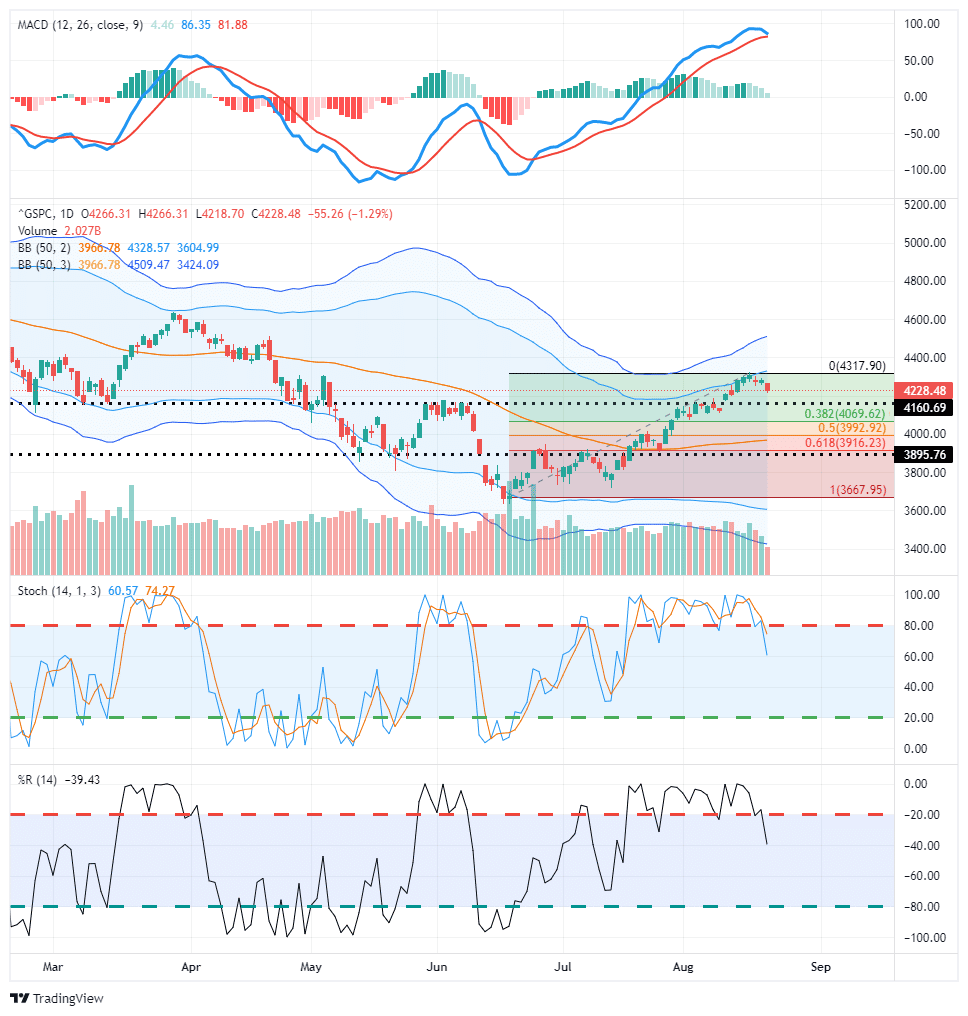
The most logical retracement rallies are at the 100-dma (black-dotted line) and the 50% retracement level, coinciding with the 50-dma and previous support levels. A break below that, and we will retest lows.
As noted on Thursday,
“Such suggests that investors should consider taking profits and rebalancing portfolio risks while waiting for the market to pull back. A pullback would reduce the more extreme conditions and allow for a better risk/reward entry for increasing portfolio allocations. This rally has mostly focused on fundamentally sub-par companies, which now provides a better opportunity to swap into more fundamentally sound businesses.”
We are currently open to increasing equity exposure on a pullback to support. However, we are also well aware of the risk of a secondary decline if, as the FOMC minutes noted, the Fed does indeed further tighten monetary policy.
FOMC Minutes Excite The Bulls
On Wednesday, the FOMC minutes from the July meeting got released. Overall, a very measured group of statements meant not to upset the financial markets got bulls excited after their initial release. It was an interesting split of messages, effectively suggesting the Federal Reserve has no clue what will happen next.
On the one hand, “Fed Officials judged moving to a restrictive stance was required as inflation remains unacceptably high and inflationary pressures as broad-based.” However, on the other hand, officials also “Judged that a bulk of tightening effect was yet to be felt.”
While the FOMC minutes discussed the need to hike rates further as inflation remains “unacceptably high,” they also suggested moderation as the lag effect of rate hikes becomes apparent. Such was evident in their “dovish” statement that many officials saw a risk of over-tightening because of constant changes in the economic environment and the lag in the effect of monetary policy. In other words, that is the risk of a “policy error” we discussed previously.
“Notably, Fed rate hiking campaigns correlate with poor financial market outcomes, as higher rates impacted the credit and leverage markets.”
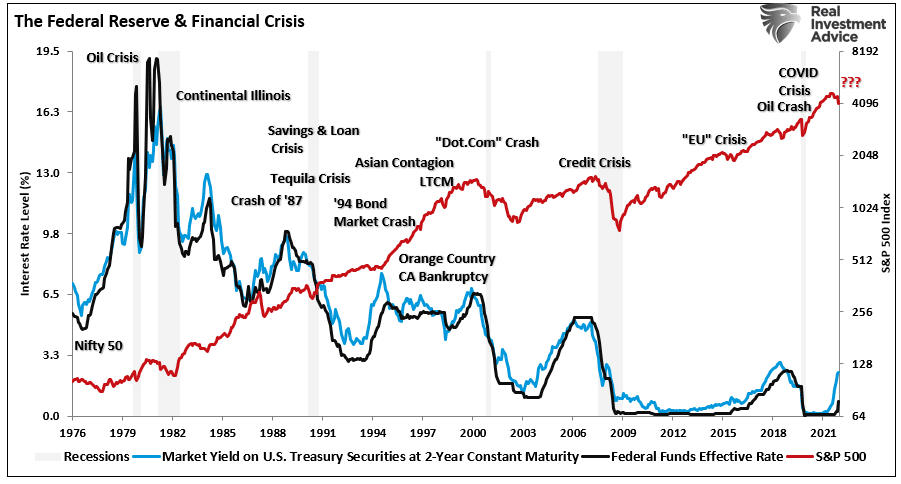
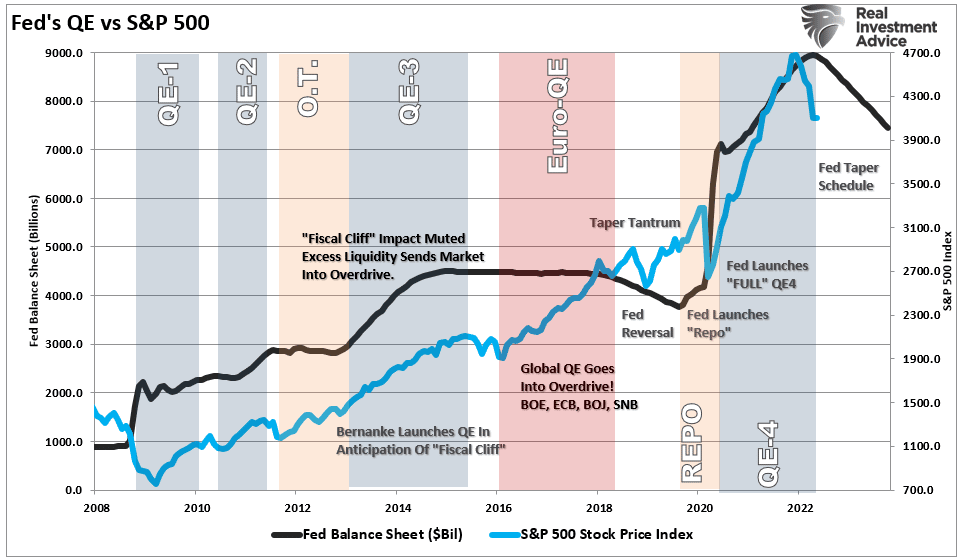
Such is particularly the case with QT running at $95 billion per month. When the Fed reduced its balance sheet in 2018, it ran at a pace of $30 billion monthly with very low inflation. Starting this month, the Fed will ramp up that reduction to 3-times the previous run rate, with inflation at nearly 9%.
That point was missing in the FOMC minutes on Wednesday.
The Bulls May Be Early
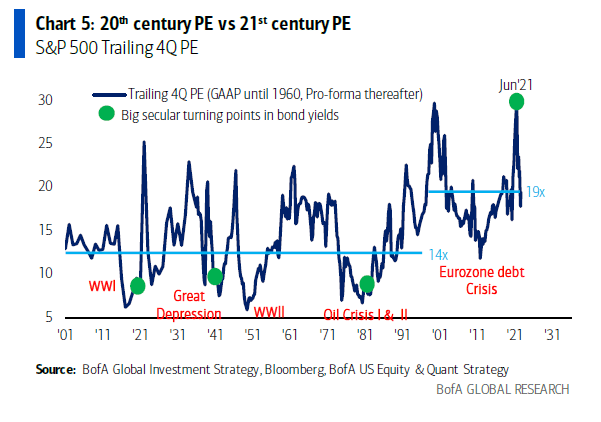
While the Fed believes it can achieve this reduction without disrupting the equity markets or causing an economic contraction, history suggests otherwise. As Michael Hartnett from BofA noted:
“S&P500 companies generated $220 of EPS per 12 months; applying a 20th century PE of roughly 15x gets you to an S&P500 index of 3300, applying a 21st century PE of 20x gets you to an S&P500 of 4400; there’s your range.
We say drivers of high 21st century PE all reversing. From QE to fiscal austerity, free movement of trade, people, capital, geopolitical peace there is a new regime of higher inflation. Such means the secular view remains cash, commodities, volatility to outperform bonds & stocks, It also means inflation in things we don’t have enough of such as energy, workers, places to rent, food, raw materials, good infrastructure, and military equipment. The deflation will be in things we have too much of from government debt, office space, mobile phones and streaming content.”
He further notes the recent rally was in line with historical bear market rallies.
“The average S&P gain in 43 bear market rallies since 1929 was 17.2%, with an average duration of 39 trading days. The current rally was 17.4% in 41 days, or as Hartnett puts it, textbook. Furthermore, bear-market rallies are always “narrow.” The recent rally was also narrow 30% of the entire gain in the S&P 500 coming from just 4 stocks: AAPL, MSFT, AMZN, and TSLA.
To Hartnett’s point, the Fed’s focus on combatting inflation, which means slowing economic growth, removes the drivers of the previous bull market. As the Fed noted:
“Once the policy rate had reached a sufficiently restrictive level, it likely would be appropriate to maintain that level for some time to ensure that inflation was firmly on a path back to 2%”.
Nowhere in that statement is a notion of cut rates anytime soon, which belies those jumping into stocks hoping for a “pivot.”
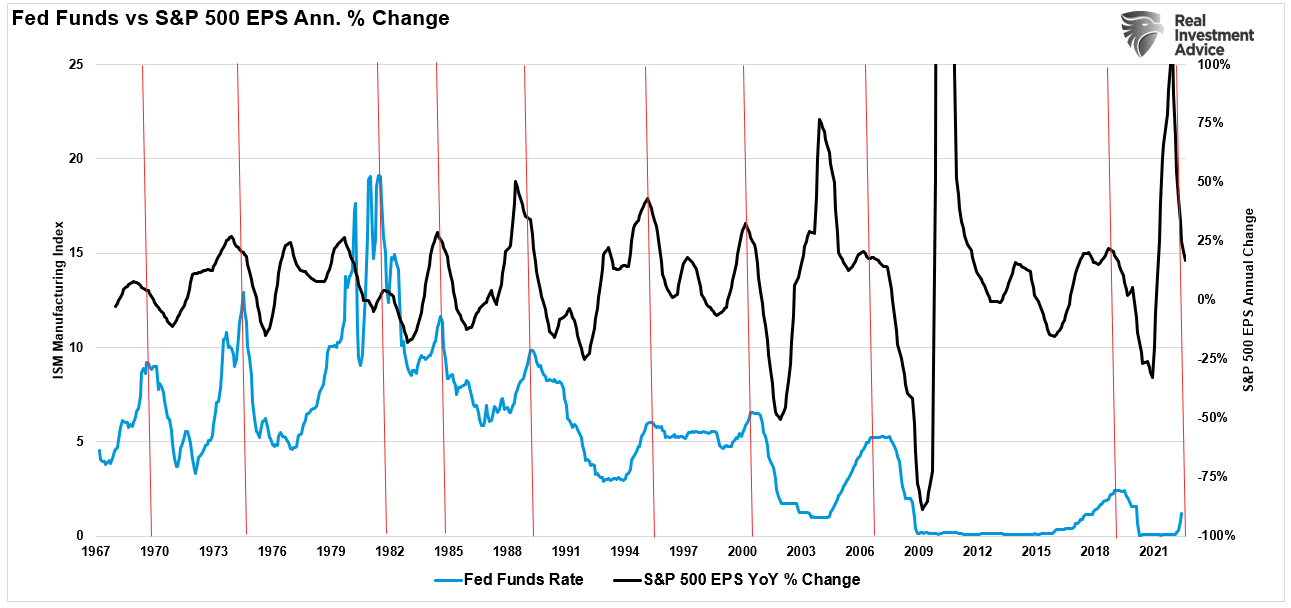
Critically, when it comes to the markets, both high inflation and rising Fed funds rates are already impacting both profit and earnings growth. Such will only worsen as the “monetary lag effect” arrives in early 2023. Such is where the risk of a further repricing of risk assets is most present. As shown, when Fed fund rates peaked, earnings growth continued to decline until well into Fed reversals.
We suspect the bulls may be a bit ahead of themselves.
50% Retracements & The 1960-70s
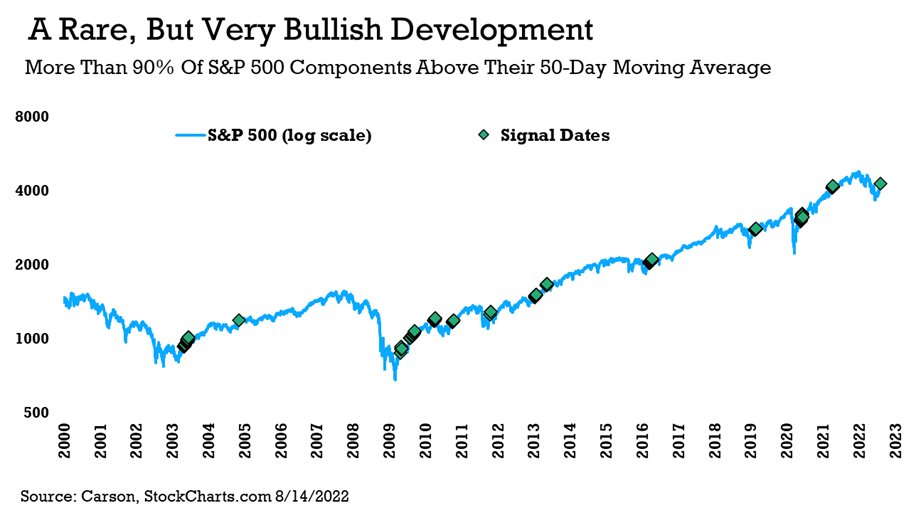
From a technical perspective, there is a rising bed of evidence supporting the “bear market is over” claim. One such bit of evidence comes from Ryan Detrick, CMT, who recently stated:
“Friday triggered a rare, but quite bullish signal. More than 90% of the components in the S&P 500 are now above their 50-day moving average. As you can see, these signals take place in strong uptrends historically.”
However, it isn’t just the number of stocks above the 50-dma but the market itself technically performing better. As noted above, an important indicator is a 50% decline retracement. When stocks have historically accomplished such a reversal, markets performed better over the next 12 months.
“Since WWII, every time the S&P recovered 50% of the bear market price decline, while the 500 may have re-tested the prior low, it never set a lower low,” Sam Stovall, Chief Investment Strategist at CFRA Research
Such is what happened in mid-August as the market rallied to its 200-dma.
Many have suggested a 50% retracement of peak to trough declines always marked the end of a bear market. As shown below, that is true, except for a couple of essential points. First, as shown, there was only one period where the market rallied while the Fed was hiking rates, and the bear market, induced by higher rates, recovered and went on to new highs. Secondly, such was the beginning of a multiple bear market sequence that ended in the 1974 bear market that brought valuations down to 7x earnings.
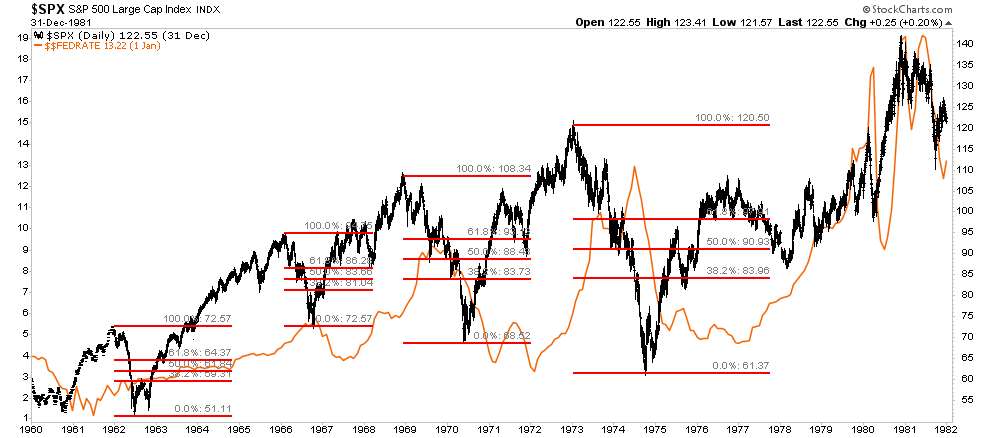
Notably, during this entire period, the Fed was regularly hiking and cutting interest rates to combat a period of steadily rising inflationary pressures. Yes, each 50% retracement rallied to new highs as the Fed cut rates, only to collapse back to lower lows again.
While such a technical measure has a strong track record of suggesting the lows are in, it does NOT mean you should jump into markets immediately.
“Prior 50% retracements in 1974, 2004, and 2009 all saw decent shakeouts shortly after clearing that threshold.” – Jonathan Krinsky, Chief Market Technician at BTIG
While the short-term technicals are indeed bullish and argue for further gains over the next 12 months, such does not preclude another “bearish decline” in the markets first.
Not Getting The Bull Bear Report Each Week In Your Mailbox? Subscribe Here For Free.
3-Minutes On The FOMC Minutes
Subscribe To Our Youtube Channel To Get Notified Of All Our Videos
How We Are Trading It
As noted above, the FOMC minutes kicked kept the bulls alive for now. However, as discussed above, a deeper read of those FOMC minutes doesn’t paint an extremely “dovish” story. Such is why, as noted last week:
“We remain highly vigilant to the current climate where the bulls cling from one report to the next in hopes of a reprieve from the Fed. However, we suspect such won’t come soon, and the risk of disappointment remains elevated. But, as always, we remain focused on what the market is telling us.”
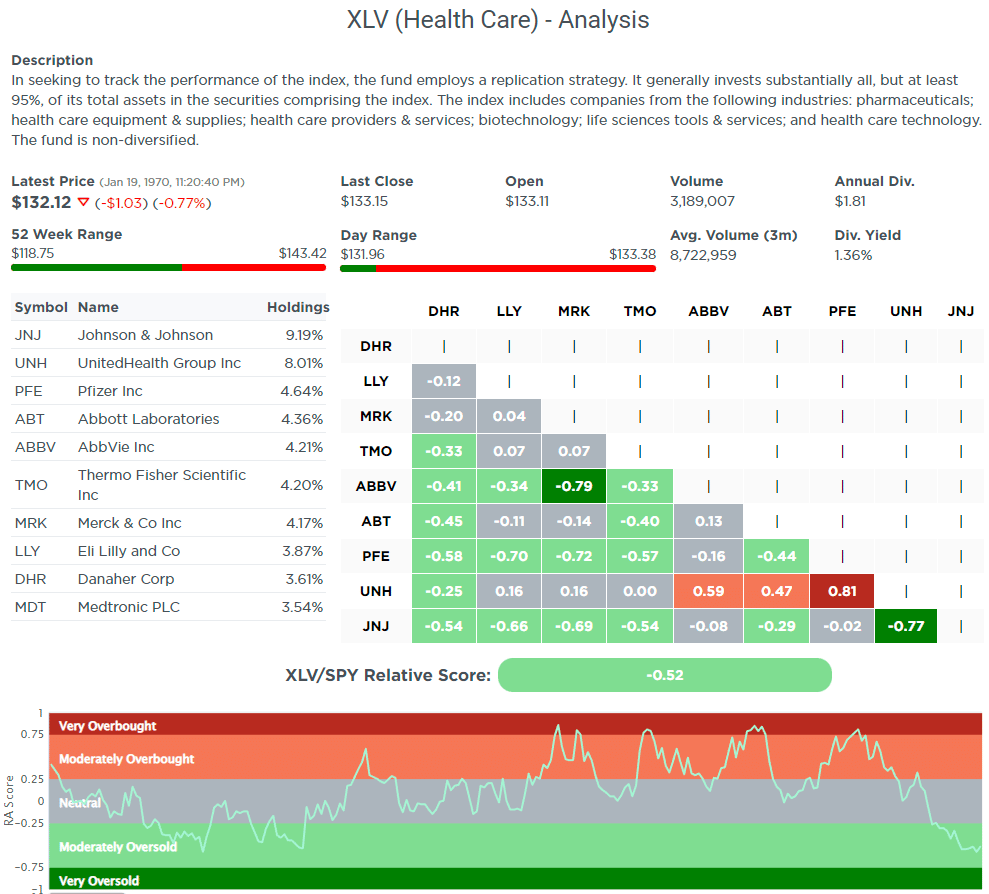
With the markets extremely overbought short-term, challenging the 200-dma, and deviating well above the 50-dma, we remain cautious with our exposures. One area we are looking at is Healthcare, which, as shown on the SimpleVisor Relative Analysis page, is very oversold relative to the market. Within the top-10 healthcare companies, ABBV is very oversold relative to MRK, and JNJ is very oversold relative to UNH. Given we already own ABBV and UNH in our portfolio, we are digging into JNJ for possible addition.
We also remain underweight technology, but we will wait for a pullback to work off some of the overbought technical conditions of the overall market before adding to the “growth” side of the portfolio. Such should perform better as disinflationary pressures become more prevalent later this year.
We made no portfolio changes this week, so allocations remain the same as last week.
With the FOMC minutes behind us, and Jackson Hole ahead, we suggest taking some action now with markets elevated.
- Sell losers and laggards.
- Trim winners back to portfolio weights
- Rebalance allocations
- Hold cash for opportunities
We realize it isn’t easy, but patience will lead to better outcomes.
Need Help With Your Investing Strategy?
Are you looking for complete financial, insurance, and estate planning? Need a risk-managed portfolio management strategy to grow and protect your savings? Whatever your needs are, we are here to help.

Research Report

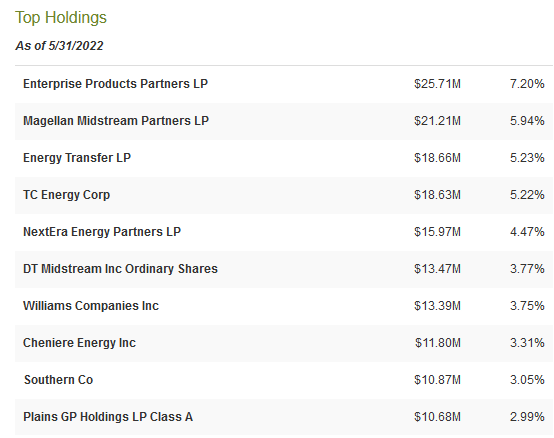
Stock Of The Week In Review – Closed-End MLPs
In the Bull Bear Report, we will post one of the stocks from our research at SimpleVisor to find stocks worth taking a deeper look. The 5-For-Friday report is published each week in full for SimpleVisor.com subscribers.
This week we explore Close End Funds (CEFs). CEFs are mutual funds that trade on stock exchanges, unlike popular open-ended funds. Open-ended funds are bought and sold through the fund manager. Its price always equals its net asset value (NAV). However, CEFs often trade at a premium or discount to that NAV. While liquidity is often lacking in many CEFs, it can allow an investor to buy a fund at a discounted price versus the aggregate value of its holdings.
The scan seeks CEFs that predominately hold energy MLPs. The four funds that met our criteria are trading at steep discounts compared to the years before the pandemic. Continued economic normalization should result in a reduction of the discount, which will benefit performance. Further, the funds offer leverage which boosts their distribution rates.
We caution that these funds can be illiquid. As such, the bid-offer spread is often wider than typical with most stocks and can impede returns. Additionally, the discount to NAV can move quickly, resulting in better or worse performance than an equivalent open-ended fund or individual MLPs.
The screen and data are courtesy of CEF Connect- Nuveen Closed-End Funds.
Screening Criteria
- Sector = CEF MLP
- Leverage <20%
- Discount to NAV < -10%
- Distribution rate >5%
Login to Simplevisor.com to read the full 5-For-Friday report.
Daily Commentary Bits
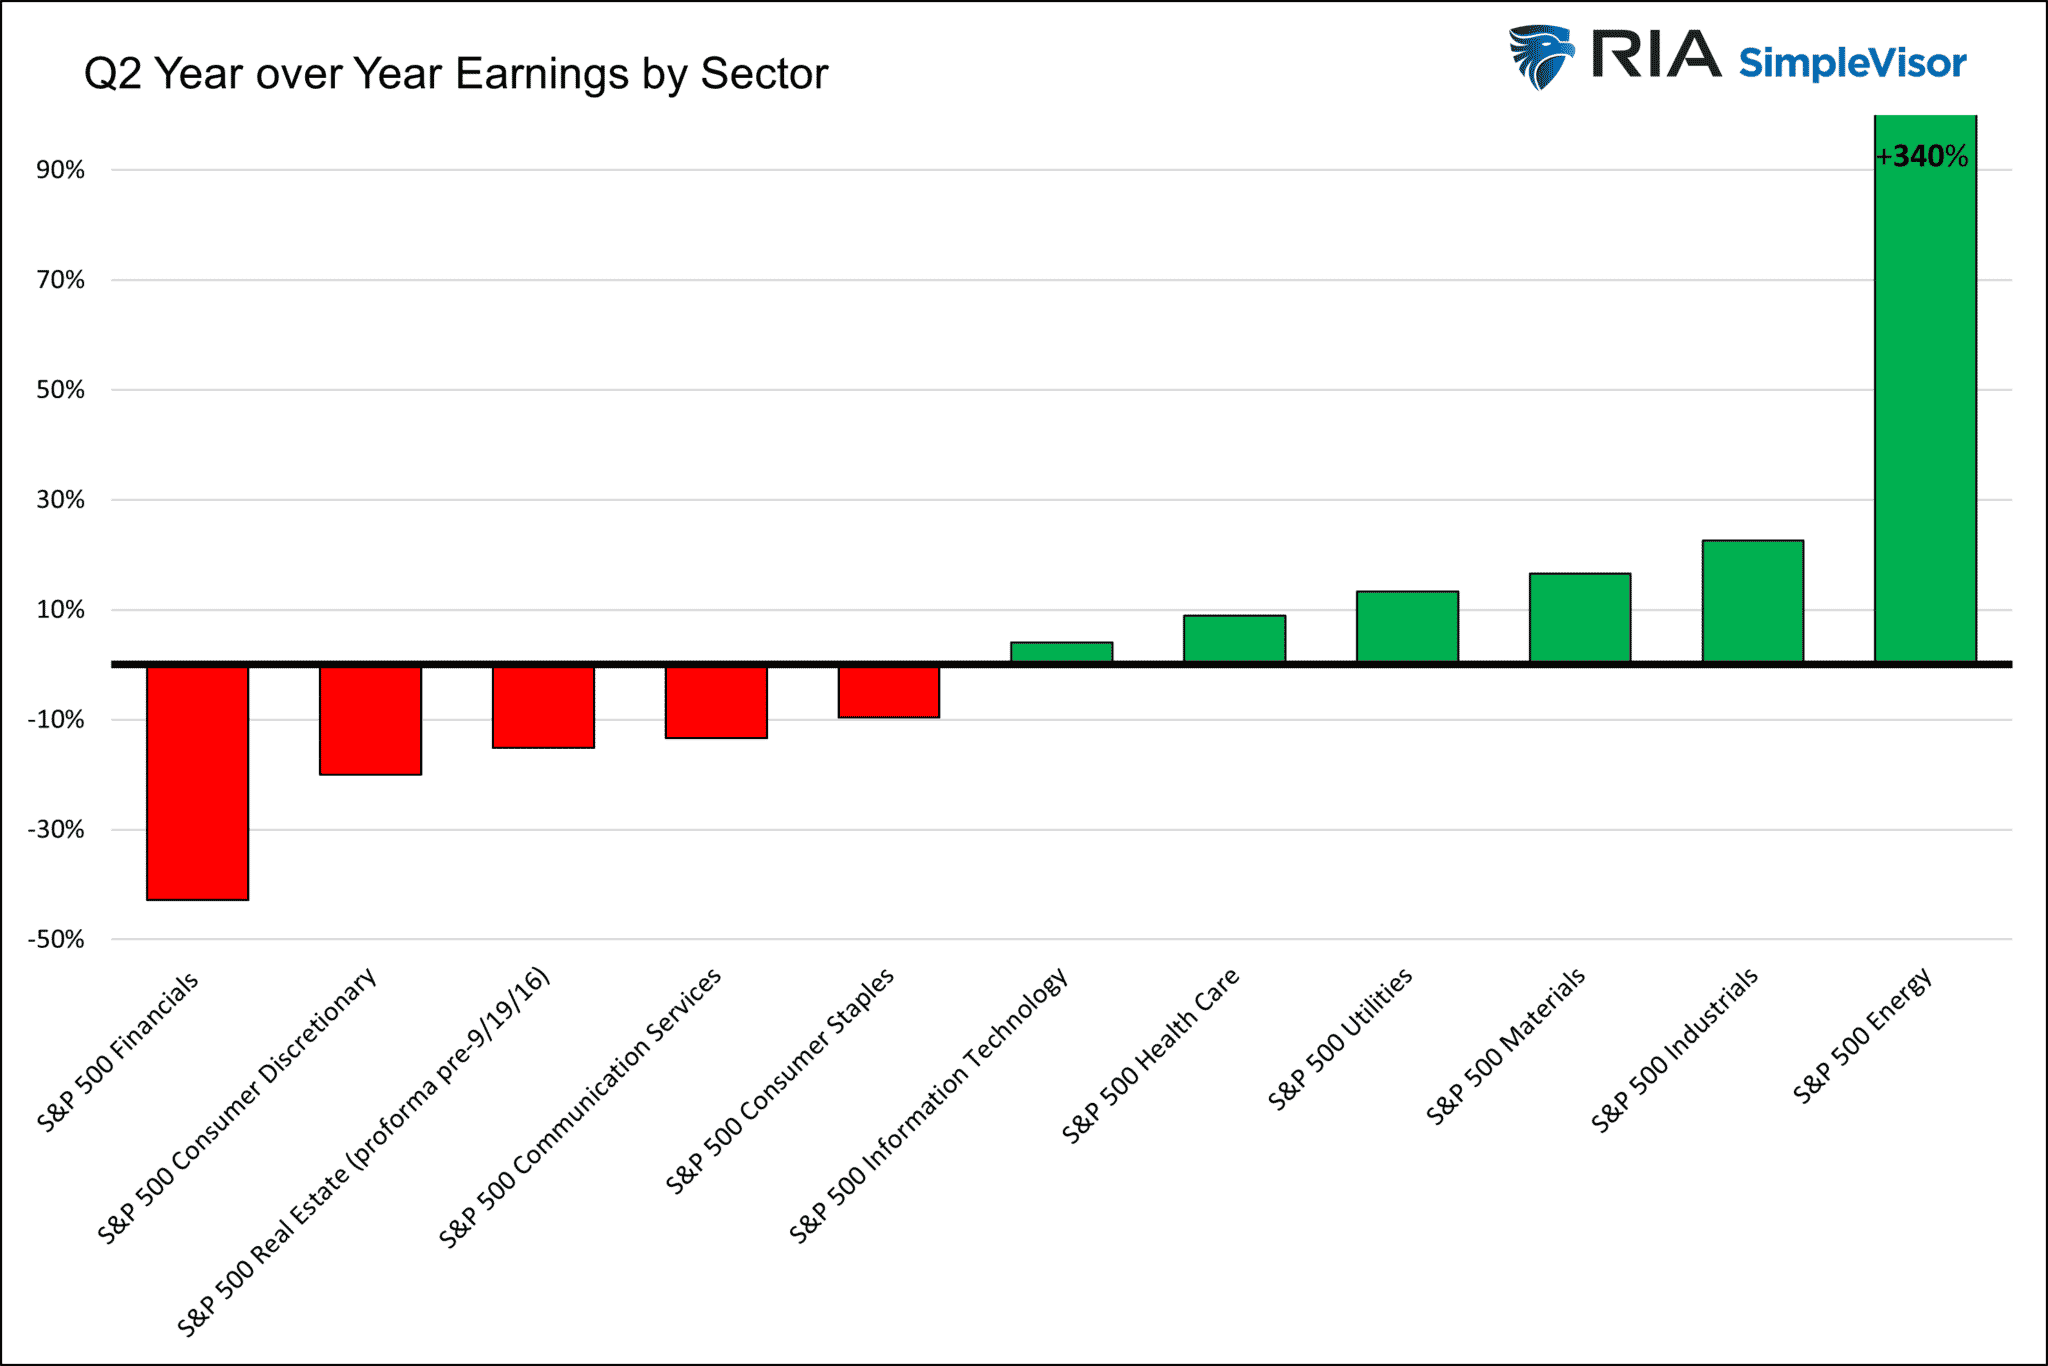
Energy Saves The Quarter
The following commentary from Yahoo Finance and the graph below highlight energy stocks’ massive influence on Q2 S&P earnings despite its small weighting (4.4%).
According to data from FactSet, with over 87% of companies in the S&P 500 having reported earnings, the blended earnings growth rate for the index is 6.7% for the second quarter. In a vacuum, mid-single-digit earnings growth is roughly in line with the average rate of earnings growth over the last 20 years — suggesting the second quarter was a fairly typical period for America’s largest businesses. No quarter, of course, exists in a vacuum, and few periods have been as eventful for investors as the second quarter of 2022 turned out to be.
Six of the S&P 500’s 11 sectors have reported positive earnings growth in the quarter. But if we take energy out of the equation, the second quarter is a bit more dodgy.In fact, this growth rate of 6.7% would flip to a decline of 3.7% if energy were excluded from the index.
And energy holds just a 4.4% weight in the S&P 500.
Click Here To Read The Latest Daily Market Commentary (Subscribe For Pre-Market Email)
Bull Bear Report Market Statistics & Screens
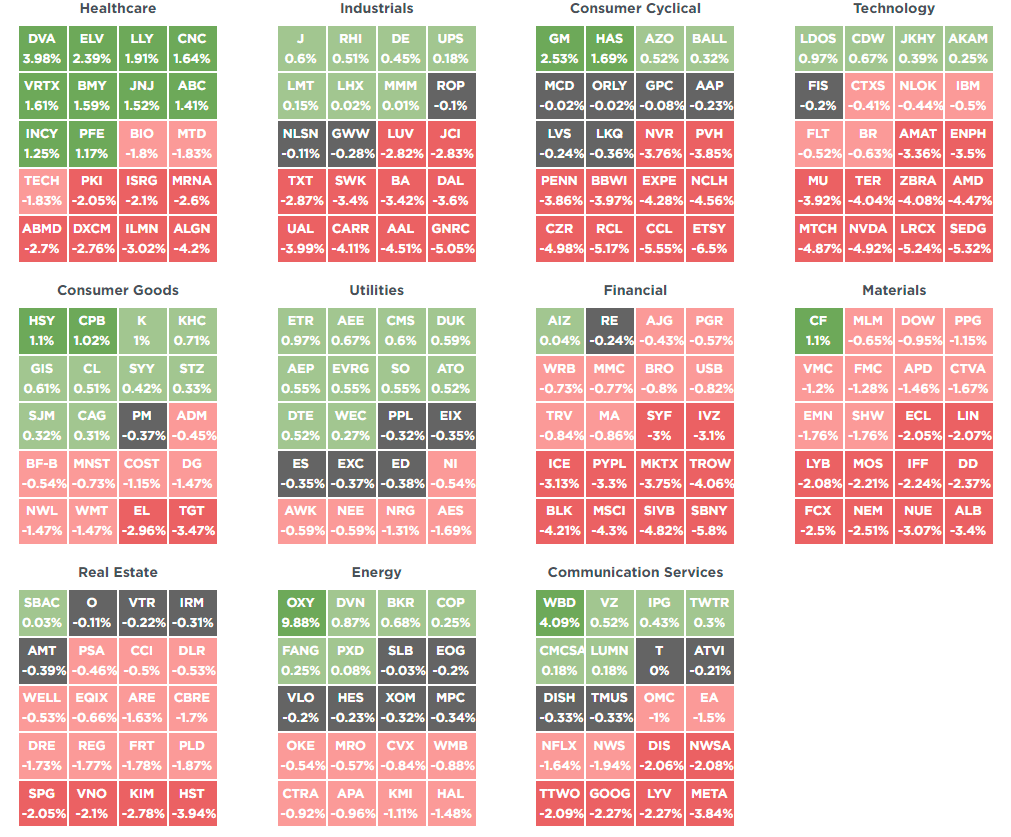
SimpleVisor Top & Bottom Performers By Sector
SimpleVisor S&P 500 Snapshot

Relative Performance Analysis
As we noted last week: “The market surge pushed EVERY MARKET and SECTOR into extreme overbought territory. As is usually the case, this analysis indicates the market has likely extracted the majority of the rally, so taking profits remains a profitable strategy.“
That analysis was very timely this week as markets pulled back on Friday. Price deviations from the 50-dma (middle right panel) remain very extended, suggesting this correction may have more work to do.
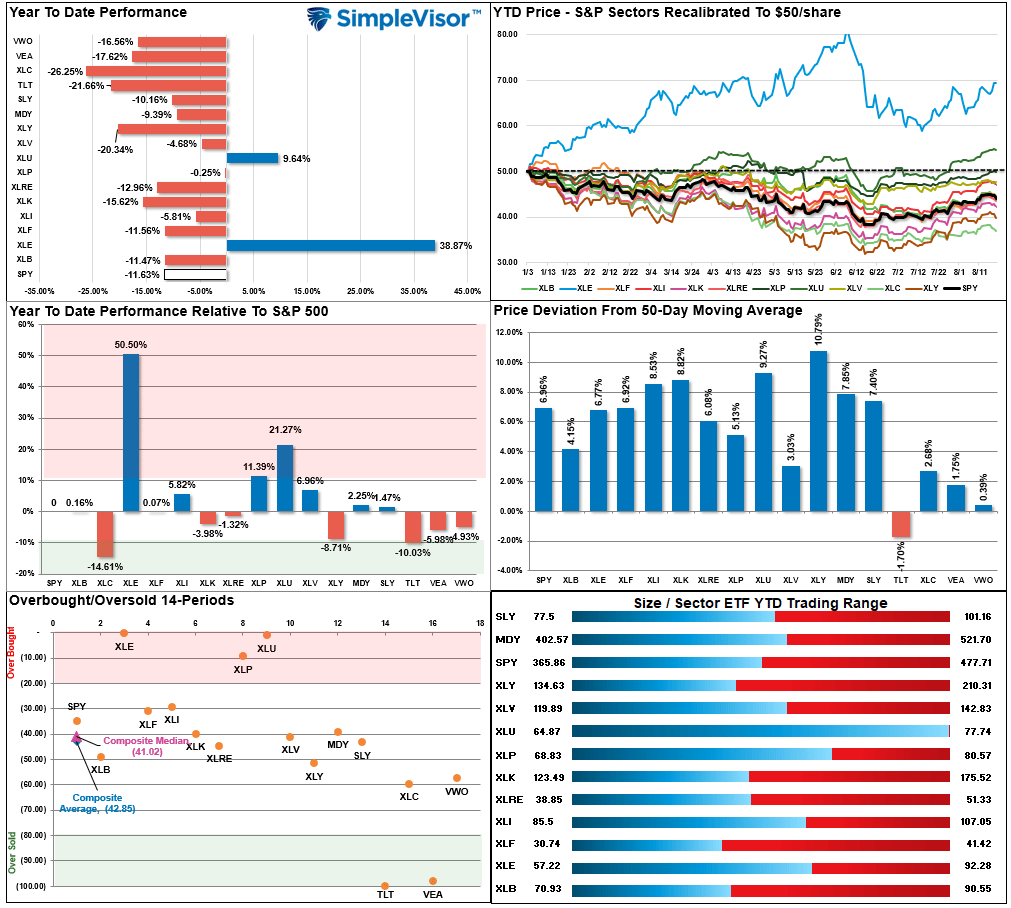
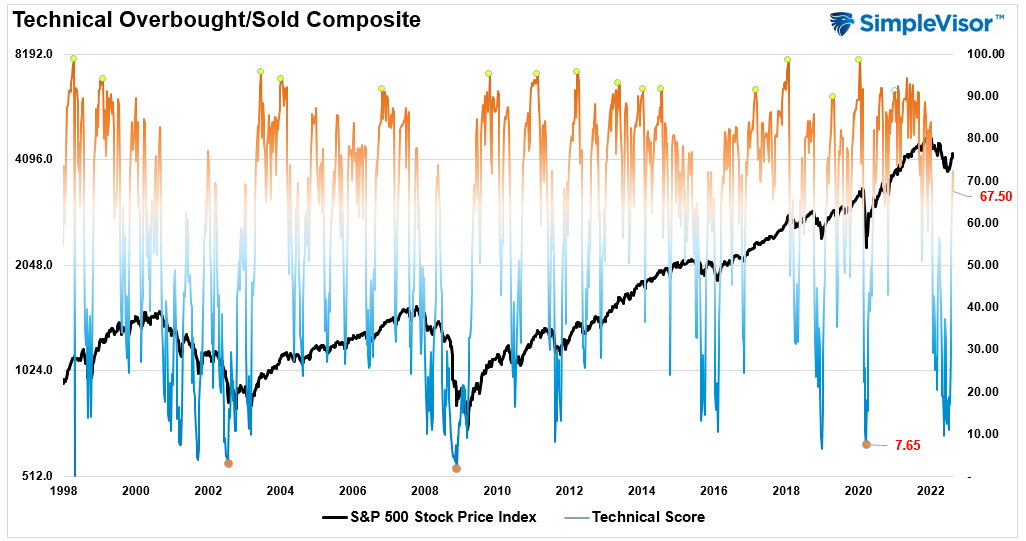
Technical Composite
The technical overbought/sold gauge comprises several price indicators (RSI, Williams %R, etc.), measured using “weekly” closing price data. Readings above “80” are considered overbought, and below “20” are oversold. Markets tend to peak when readings are at 80 or above, which suggests profit taking and risk management are prudent. The best buying opportunities are when readings are 20 or below.
The current reading is 67.50 out of a possible 100 and rising. Remain long equities for now.
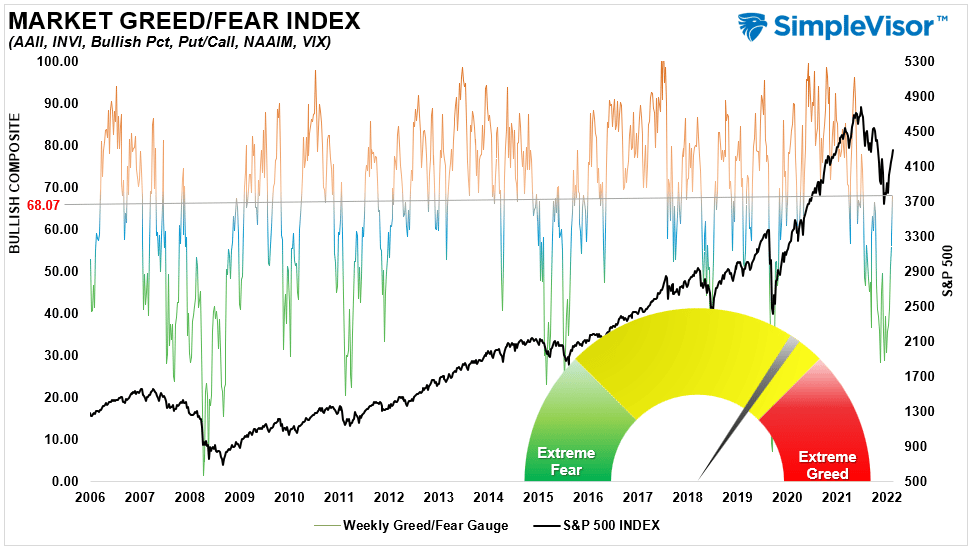
Portfolio Positioning “Fear / Greed” Gauge
The “Fear/Greed” gauge is how individual and professional investors are “positioning” themselves in the market based on their equity exposure. From a contrarian position, the higher the allocation to equities, to more likely the market is closer to a correction than not. The gauge uses weekly closing data.
NOTE: The Fear/Greed Index measures risk from 0 to 100. It is a rarity that it reaches levels above 90. The current reading is 68.07 out of a possible 100.
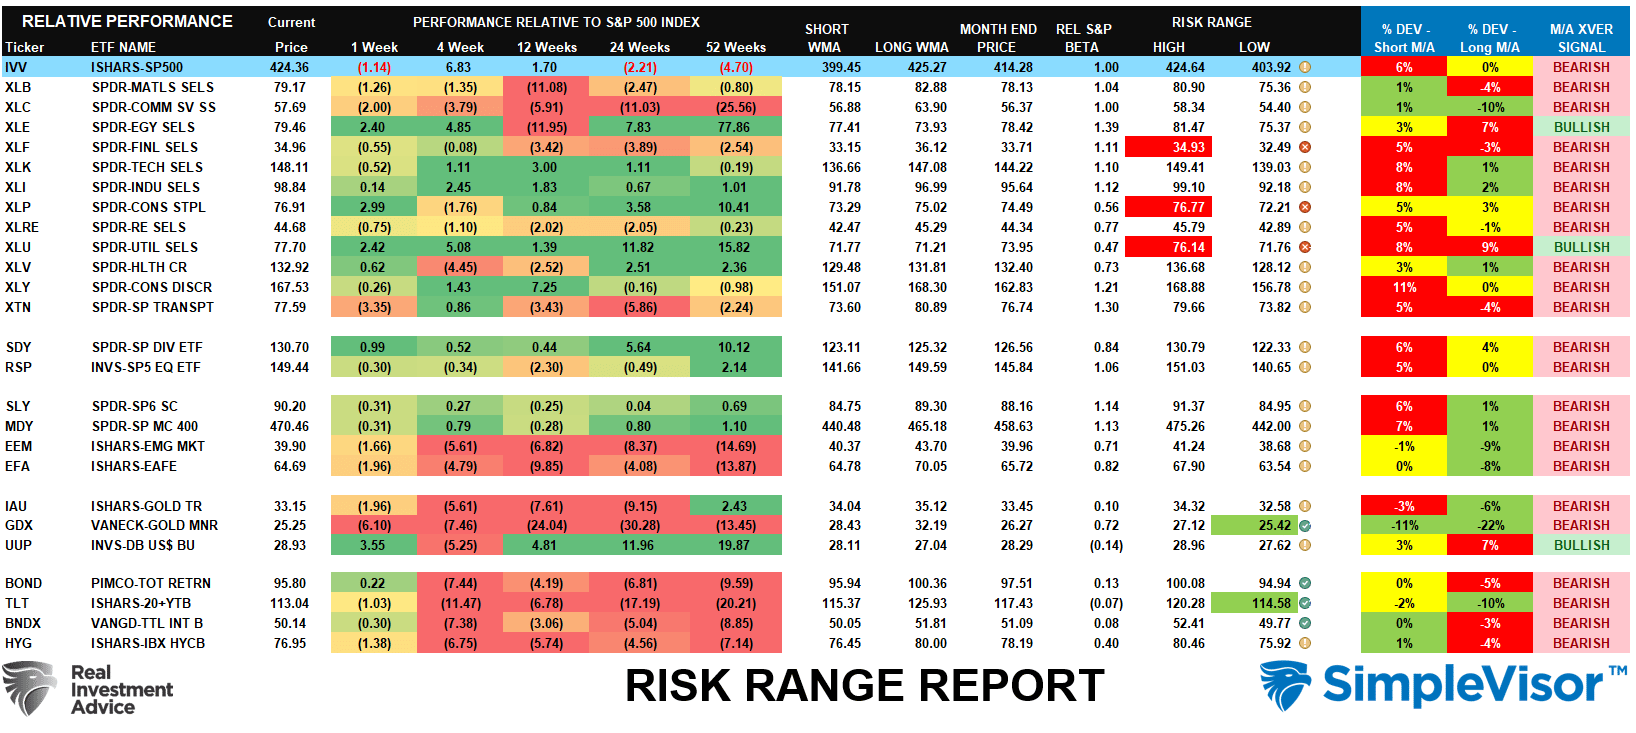
Sector Model Analysis & Risk Ranges
How To Read This Table
- The table compares the relative performance of each sector and market to the S&P 500 index.
- “M/A XVER” is determined by whether the short-term weekly moving average crosses positively or negatively with the long-term weekly moving average.
- The risk range is a function of the month-end closing price and the “beta” of the sector or market. (Ranges reset on the 1st of each month)
- The table shows the price deviation above and below the weekly moving averages.
As noted last week, “just two weeks into the month, many markets and sectors are trading well above their historical monthly trading ranges. Such usually is not sustainable.” We suggested a pullback was likely this week from that analysis. It is worth noting that Communications, Gold Miners, and Bonds (TLT) are trading at double-digit percentage deviations from the long-term weekly means. Historically, such has provided excellent long-term entry points into assets, although it may take some time for the thesis to play out.
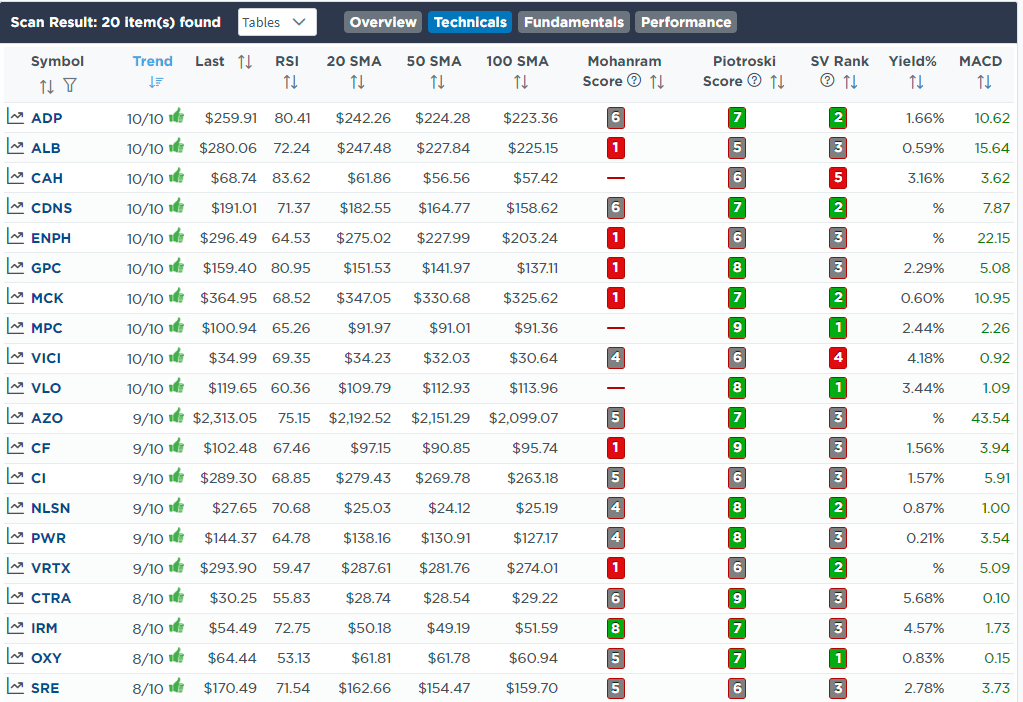
Weekly SimpleVisor Stock Screens
Each week we will provide three different stock screens generated from SimpleVisor: (RIAPro.net subscribers use your current credentials to log in.)
This week we are scanning for the Top 20:
- Relative Strength Stocks
- Momentum Stocks
- Technically Strong With Strong Fundamentals
These screens generate portfolio ideas and serve as the starting point for further research.
(Click Images To Enlarge)
RSI Screen
Momentum Screen

Technical & Fundamental Strength Screen

SimpleVisor Portfolio Changes
We post all of our portfolio changes as they occur at SimpleVisor:
No Trades This Week

Lance Roberts, CIO
Have a great week!


