Markets Hold Support As Bulls Defy The Fed


Inside This Week’s Bull Bear Report
- Markets Hold Support
- Surging Stocks Are The Last Thing The Fed Wants
- How We Are Trading It
- Research Report – Small Business Sales Send A Warning
- Webinar – Market Review With Adam Taggart
- Stock Of The Week
- Daily Commentary Bits
- Market Statistics
- Stock Screens
- Portfolio Trades This Week
Markets Hold Support, But Resistance Is Ahead
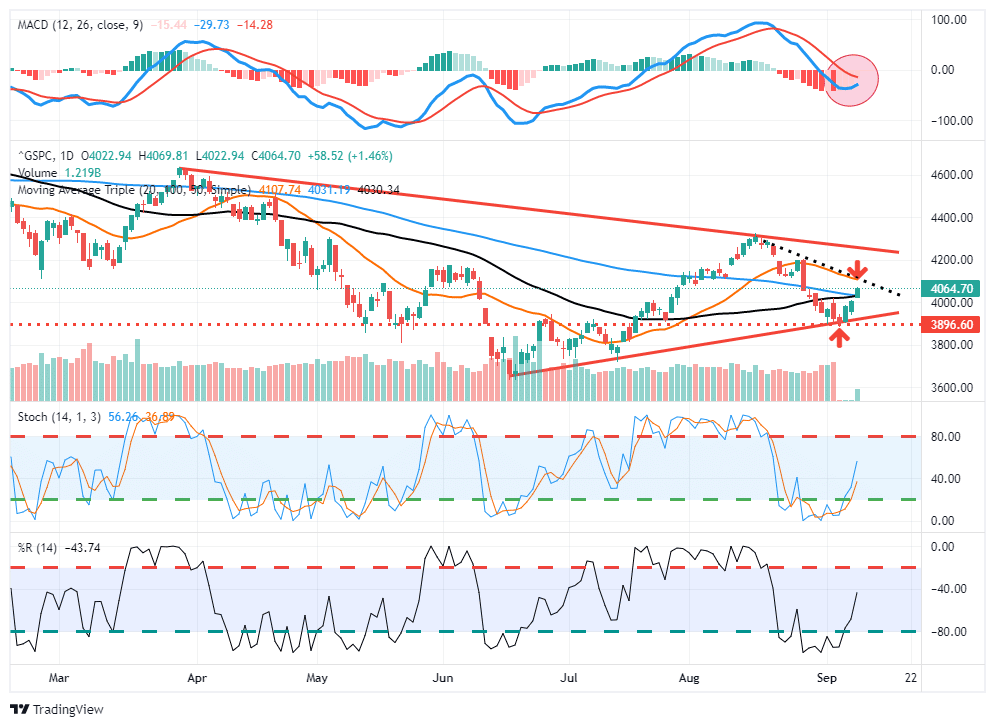
“That was the case as the markets sold off sharply all week, taking out the important 50-day moving average. However, with the markets deeply oversold, a reflexive bounce is likely. On Friday, the market attempted a test to break above the 50-dma, but failed. With the market sitting on important support, an attempt at a rally next week is likely. However, with the MACD on a “sell signal,” we continue to suggest selling any rallies to reduce risk.“ – Last week’s commentary.
This week, that reflexive rally started on Wednesday and carried through into Friday as the bulls took charge, ignoring warnings from Central Bankers that tighter monetary policy was coming. Notably, the market is setting up a more bullish posture short term, as shown below. First, the market held support at the rising bullish trend line and managed to climb through resistance at the 50- and 100-day moving averages (dma), which now sets up a potential rally to the 20-dma. With markets not overbought, there is fuel for an additional rally into next week, and importantly, the market is very close to flipping the MACD onto a “buy signal.”
With inflation raging, the economy slowing, and the Fed tightening monetary policy, it isn’t easy to process the more bullish undertones of the market. However, we must trade the market for what it is rather than what we wish it to be. As such, we are looking opportunistically to add exposure to portfolios in a controlled manner, and if the bullish trend gets confirmed over the next couple of weeks, we will slowly put cash back to work.
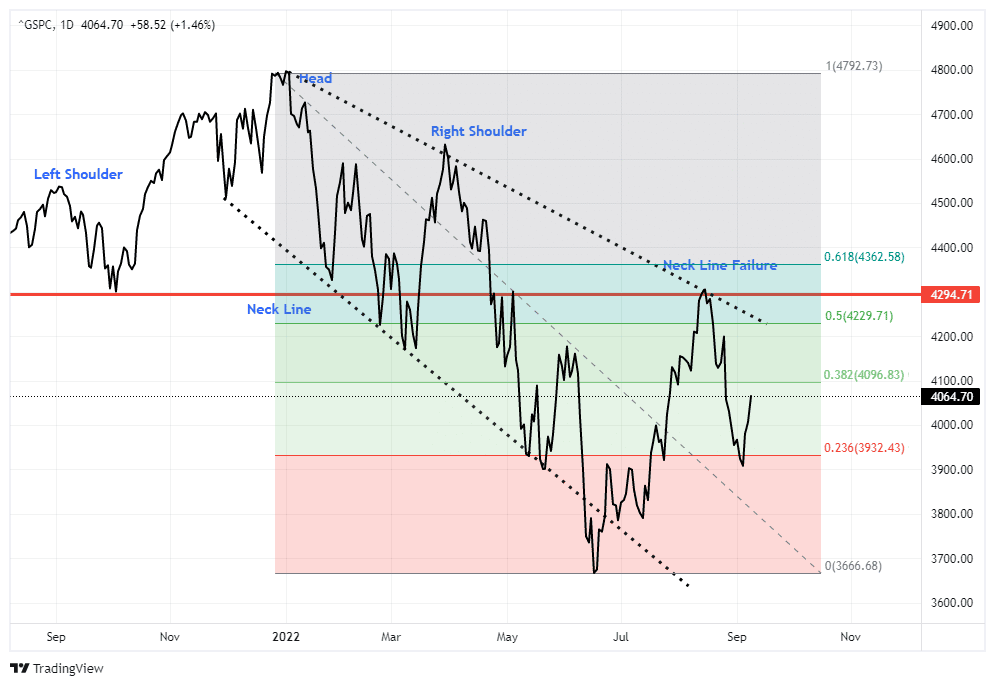
However, with that stated, we also recognize the overall risk. Therefore, if we decide to increase equity exposures, we will do so in a very controlled manner with very tight stop-loss levels and size limitations. There is also the issue of the confirmed “head and shoulder” pattern which suggests there is still downside risk to the market. Therefore, while we may add exposure for a short-term rally, we will likely “sell” any rally to 4250 for the time being.
The media often states that investors should not “fight the Fed.” Notably, surging stock markets are the last thing the Fed wants.
Surging Stocks Are The Last Thing The Fed Wants
On Wednesday, a report from the Wall Street Journal caught investors’ attention suggesting another 75-basis point rate hike at the September FOMC meeting is likely. As noted, the Fed is trying to “tighten” monetary policy by hiking interest rates and reducing liquidity. The goal is to increase borrowing costs to reduce demand, which should reduce inflation.
However, rising stock markets, likely we saw in July and early August, boost consumer confidence and act to ease the very financial conditions the Fed is trying to tighten. While financial conditions have tightened recently between higher interest rates and surging inflation, they remain below zero for now. Such is hardly the environment desired by the Fed to quell inflation.
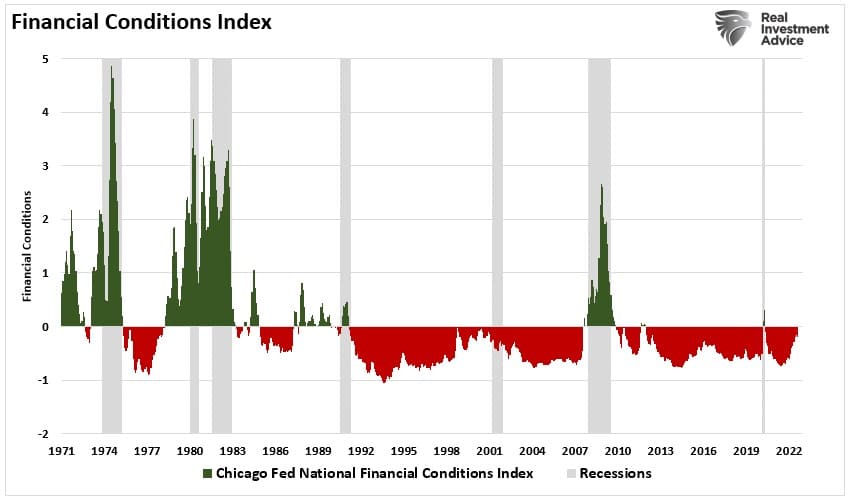
Tighter financial conditions are a function of several items:
- A stronger US dollar relative to other currencies (Check)
- Wider spreads across bond markets (There is no credit stress currently)
- Lower stock prices.
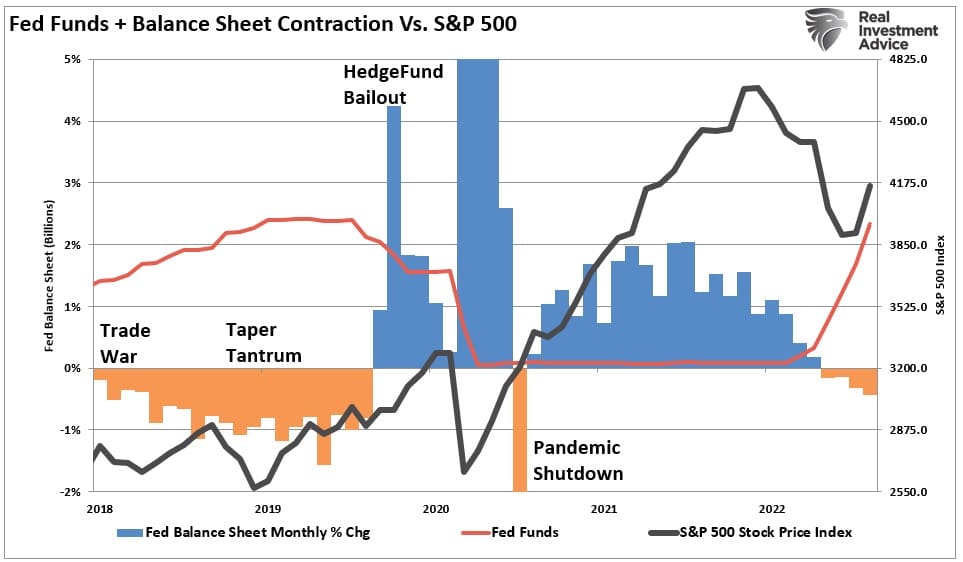
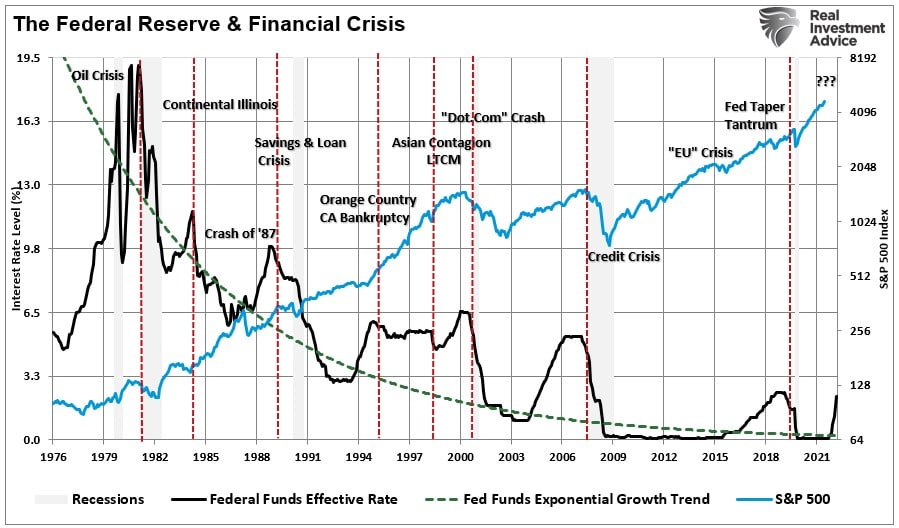
The more bullish market participants should be aware the Fed is ultimately pushing for lower stock prices. The Fed is removing liquidity by reducing its balance sheet twice as fast as in 2018. For those who don’t remember, the last QT ended in a 20% market plunge over three months.
While the Fed is focused on hiking rates and reducing its balance sheet, there is a lag effect between changes to monetary policy and their impact on the economy. Over the next 6-9 months, the rate hikes earlier this year will begin to weigh on the economy. Higher borrowing costs and prices will start to force consumers to choose what and where to spend.
Notably, the Fed has not accomplished its task and remains committed to fighting inflation. On Thursday, Jerome Powell reiterated his case, stating:
“We need to act now, forthrightly, strongly as we have been doing. It is very important that inflation expectations remain anchored. What we hope to achieve is a period of growth below trend.”
That last sentence is the most important.
Below Trend Growth
There are some important financial implications to below-trend economic growth. As we discussed in “The Coming Reversion To The Mean Of Economic Growth:”
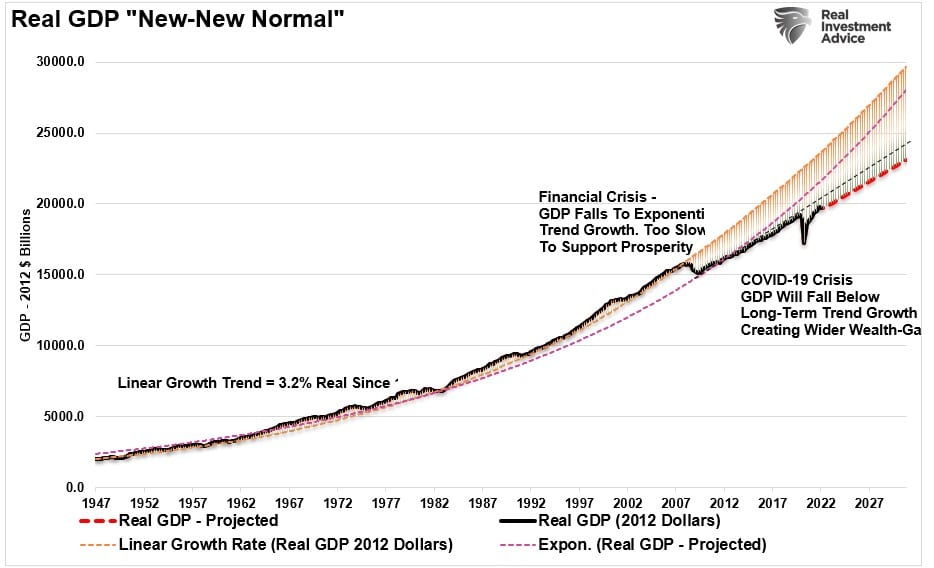
“After the ‘Financial Crisis,’ the media buzzword became the ‘New Normal’ for what the post-crisis economy would like. It was a period of slower economic growth, weaker wages, and a decade of monetary interventions to keep the economy from slipping back into a recession.
Post the ‘Covid Crisis,’ we will begin to discuss the ‘New New Normal’ of continued stagnant wage growth, a weaker economy, and an ever-widening wealth gap. Social unrest is a direct byproduct of this “New New Normal,” as injustices between the rich and poor become increasingly evident.
If we are correct in assuming that PCE will revert to the mean as stimulus fades from the economy, then the ‘New New Normal’ of economic growth will be a new lower trend that fails to create widespread prosperity.”
As shown, economic growth trends are already falling short of both previous long-term growth trends. The Fed is now talking about slowing economic activity further in its inflation fight.
As noted, there are significant implications for investors. As I discussed in “Earnings Decline,” there is a long-term correlation between economic and earnings growth. To wit:
“There should be no surprise, given that economic growth and earnings have a long-term historical correlation. Such would seem logical, given that economic activity generates revenues for companies. Therefore, while it is possible for earnings to grow faster than the economy at times, i.e., post-recession, they can not outgrow the economy indefinitely. The earnings surge in 2021 is something never witnessed previously and must eventually revert to norms.”
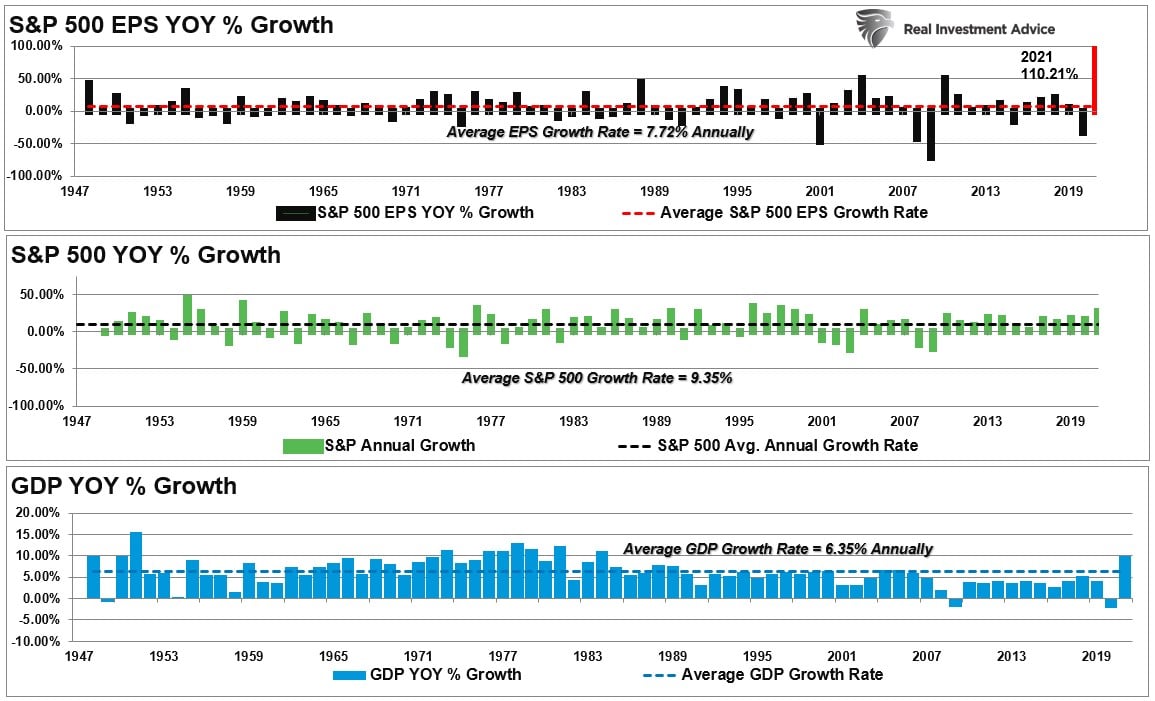
Therefore, earnings will also slow as the Fed continues its campaign to degrade economic growth. Since markets still trade at rich valuations and remain deviated from long-term growth trends, investors should expect lower future asset prices as earnings decline.
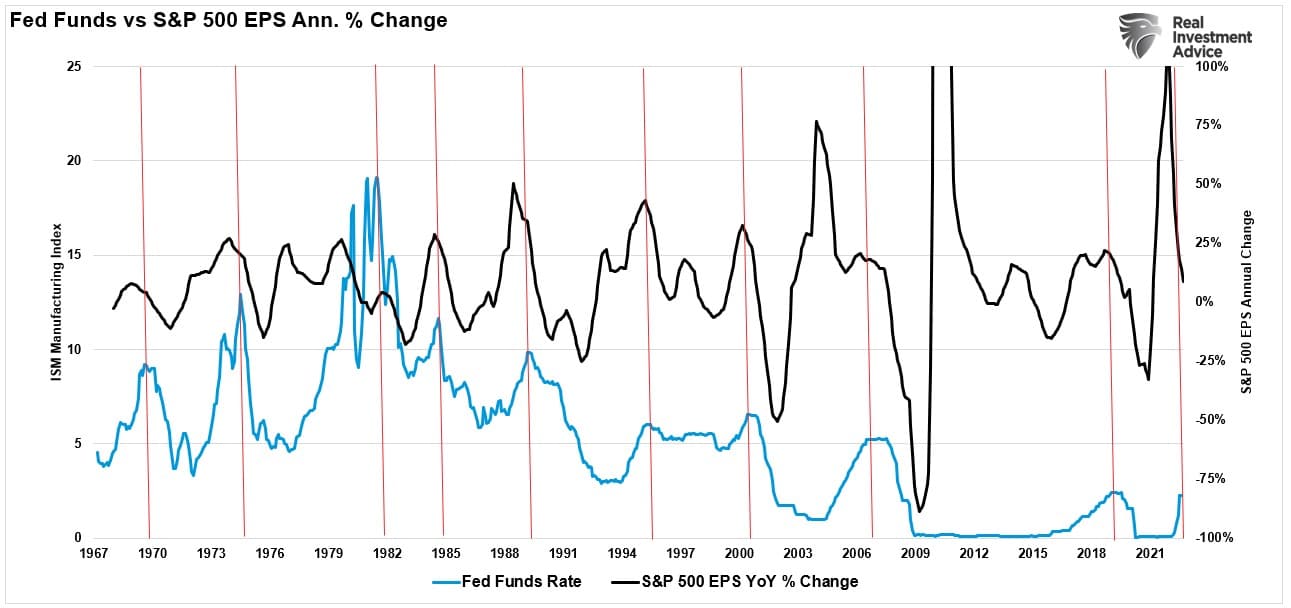
One last warning. Investors expect that as soon as the Fed stops hiking rates, they will begin to lower them. While that is likely true, it is not a “consequence-free” action. Historically, when the Fed reverses rates, that is NOT the time to buy stocks as the Fed is historically combatting a recession, bear market, or worse.
The time to buy will be when rates return to the “zero bound.”
Not Getting The Bull Bear Report Each Week In Your Mailbox? Subscribe Here For Free.
Market Week In Review With Adam Taggart
Subscribe To Our Youtube Channel To Get Notified Of All Our Videos
How We Are Trading It
As noted last week, the failure of the bull rally was not surprising. However, the reversal over the last couple of weeks reversed the overbought conditions, providing a setup for the short-term reflexive rally we saw this week as stocks rallied off key support. However, as noted above, while the rally is pushing some bullish indicators towards positive territory, suggesting an increase in equity exposure, we are still dealing with a more hostile monetary and economic backdrop.
As such, it is important not to be overly aggressive currently but take some positioning as needed to participate in the rally if it continues into next week, which seems likely. There are clear stop levels at the recent lows, and the upside to 4240 seems the most probable. Such doesn’t provide a great risk/reward setup, but it is a tradeable range if you need additional equity exposure.
This past week we only made minor changes to our portfolio by adding a trading position in FXE (Euro Currency Trust) and increasing our longer-duration bond holdings.
The dollar is now significantly extended technically and is due for some corrective action. Such should also bode well for lower bond yields. As noted in our Daily Market Commentary:
- Given the soaring rate of inflation, especially energy prices, this instance of a stronger dollar is wreaking havoc on Europe and Japan. Making matters worse, many foreign borrowers borrow in dollars. If they do not hedge the currency risk, as many do not, a strong dollar results in higher interest and principal payments. Therefore, they must acquire more expensive dollars to pay interest and principal. Further, a strong dollar is a de facto global monetary policy tightening.

We suggest using any short-term market rally to reduce risk, rebalance holdings, and raise cash levels.
Need Help With Your Investing Strategy?
Are you looking for complete financial, insurance, and estate planning? Need a risk-managed portfolio management strategy to grow and protect your savings? Whatever your needs are, we are here to help.

Research Report
Stock Of The Week In Review
Staples Stocks
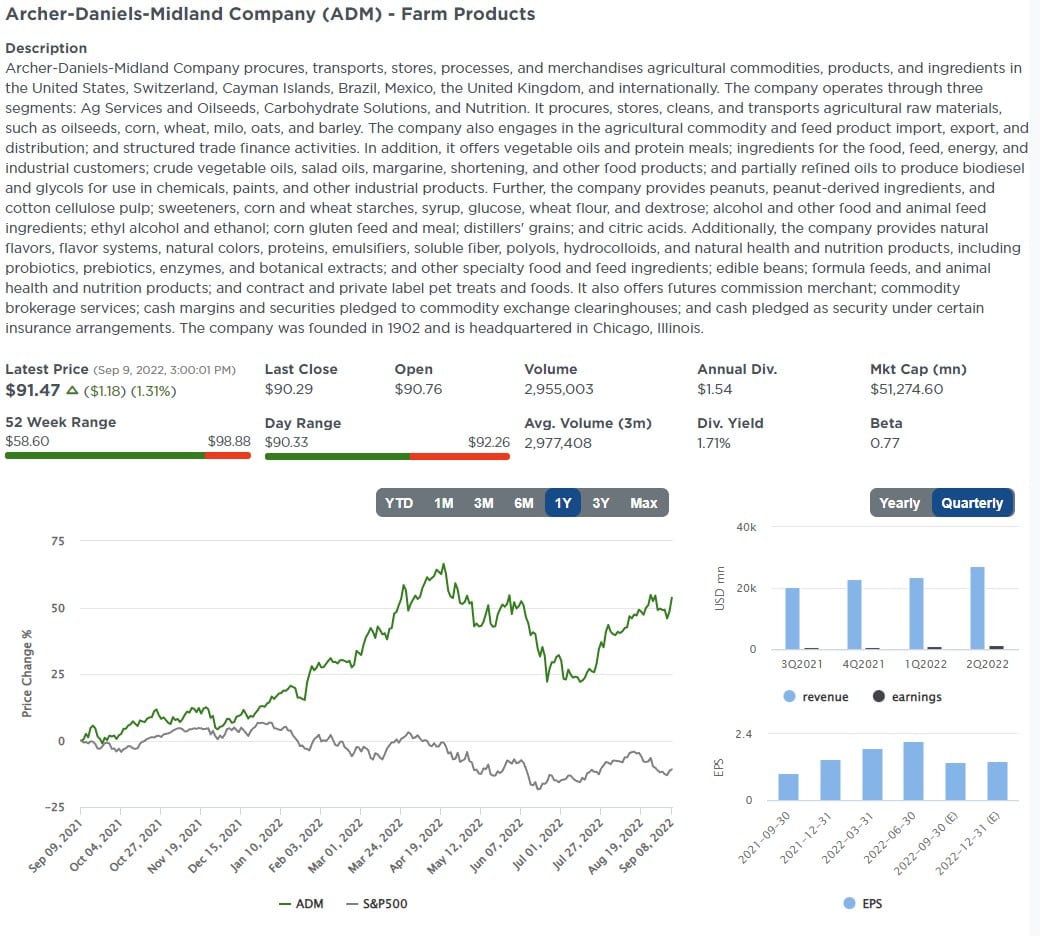
This week we published Consumer Staples vs. Discretionary. The article highlights how consumer staples and discretionary stocks fared through the inflation storm of the last year. Typically, in an environment with higher inflation and slowing economic activity, staples should be better able to maintain margins and sales. Surprisingly, discretionary companies held up better in that respect.
The reason discretionary margins and sales were better than those of staples appears to be credit card usage and the drawing down of savings.
This week’s scan searches the consumer staples sector for stocks that have held up well year-to-date. If the economy weakens and inflation normalizes, we suspect these companies will continue to outperform the market vastly.
Screening Criteria
- Sector = Consumer Staples – USA
- Market Cap >$1.0 bn
- P/E <20
- Forward P/E < 15
- YTD Performance >+10%
Archer-Daniels-Midland (ADM)
Login to Simplevisor.com to read the full 5-For-Friday report.
Daily Commentary Bits
OPEC Production Cuts
On Friday, the G7 announced a price cap on Russian oil. Russia retaliated by cutting gas supply to zero to Germany due to a “leaking pipe.” OPEC then piled on yesterday by reducing its oil production. Accordingly, OPEC will reduce its oil output target by 100k barrels per day (BPD) starting in October. It is unclear if OPEC is siding with Russia or reducing production to counter recently lower oil prices. The United States will likely continue to draw down its Strategic Petroleum Reserverves (SPR) to offset reduced OPEC and Russian oil production. In the section below, we provide historical context for the recent unprecedented draining of the SPR.
Crude oil prices surged on the OPEC production news Monday but quickly retreated and gave up their gains by Tuesday morning. Many investors are questioning whether the reduction is meaningful. As we shared below from BofA, OPEC production was already running well below its quota. Another 100k BPD reduction is not likely to move the needle and may signal Russia’s support from OPEC.

Click Here To Read The Latest Daily Market Commentary (Subscribe For Pre-Market Email)
Bull Bear Report Market Statistics & Screens

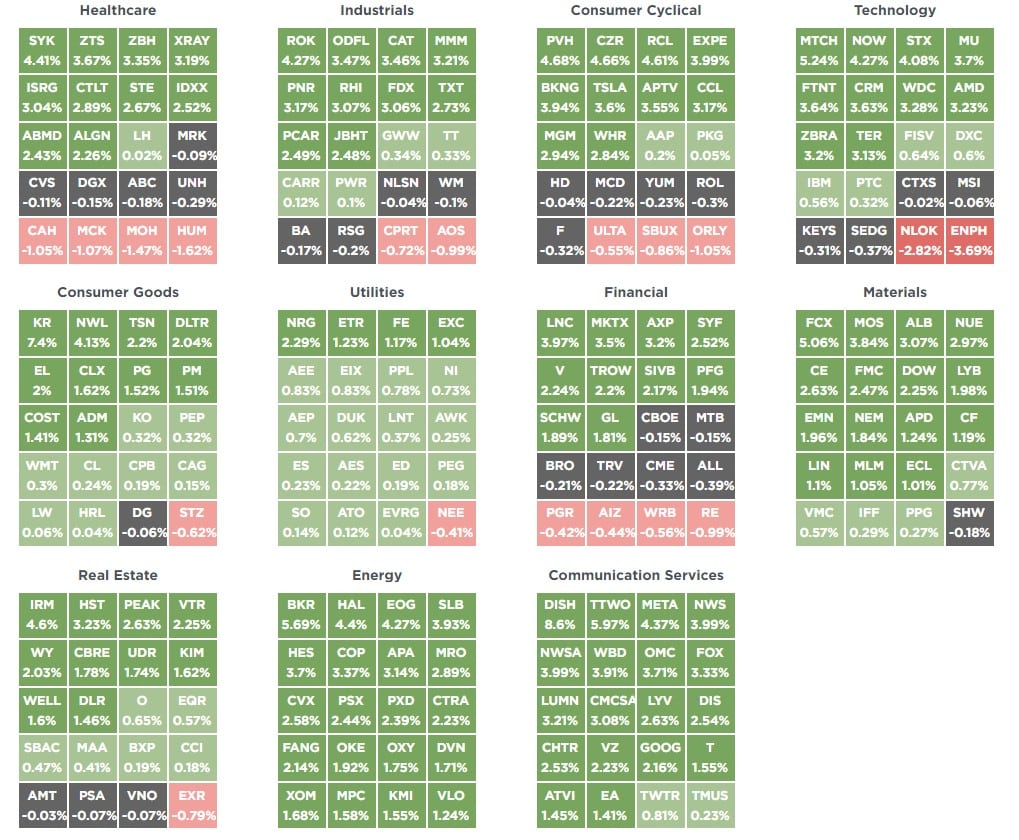
SimpleVisor Top & Bottom Performers By Sector
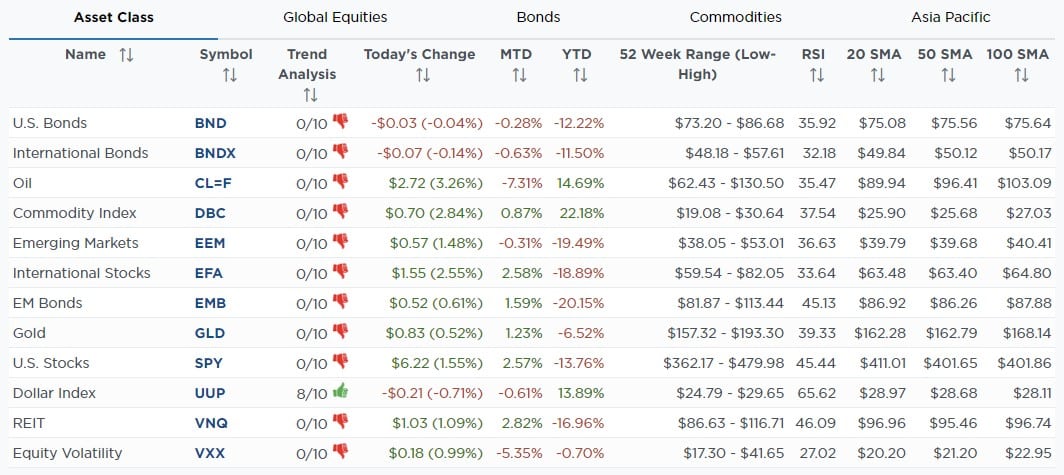
SimpleVisor Asset Class Trend Analysis
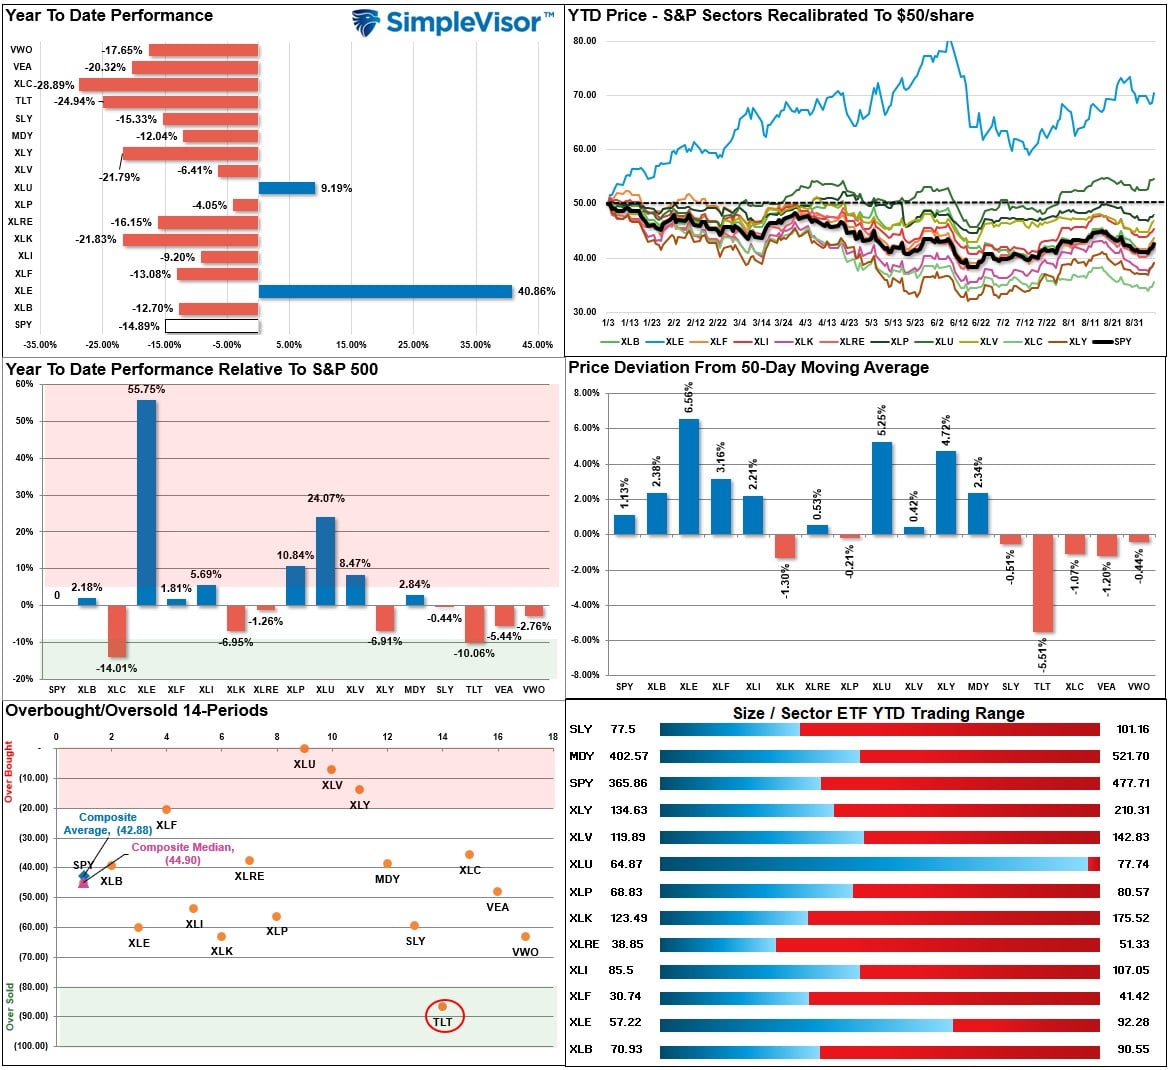
Relative Performance Analysis
Last week, we stated:
“The markets are not yet back to extreme overbought, so further gains next week will not be surprising. However, for now, we continue to suggest selling rallies as markets remain highly vulnerable to reversals,.“
That remains the case this week as most sectors and markets remain between oversold and overbought. The exceptions are Utilities, Healthcare, and Discretionary, which are now overbought, suggesting profit taking is warranted. The good news is that relative underperformance is getting reduced across sectors and markets, but the overall market environment remains at risk. A consistent process of rebalancing risks, and holding higher cash levels, remains warranted for now.
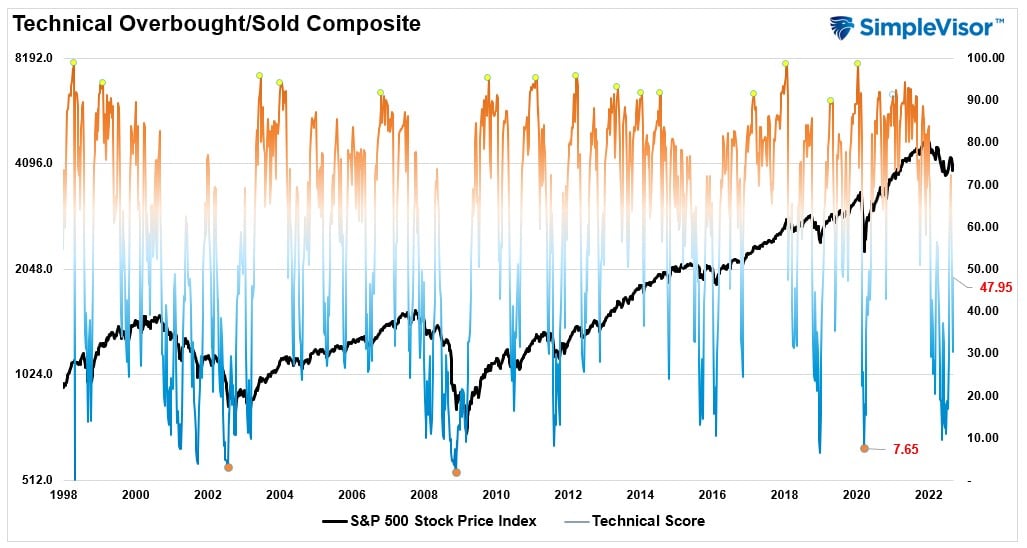
Technical Composite
The technical overbought/sold gauge comprises several price indicators (RSI, Williams %R, etc.), measured using “weekly” closing price data. Readings above “80” are considered overbought, and below “20” are oversold. Markets tend to peak when readings are at 80 or above, which suggests profit taking and risk management are prudent. The best buying opportunities exist when readings are 20 or below.
The current reading is 47.95 out of a possible 100 and rising. Remain long equities for now.
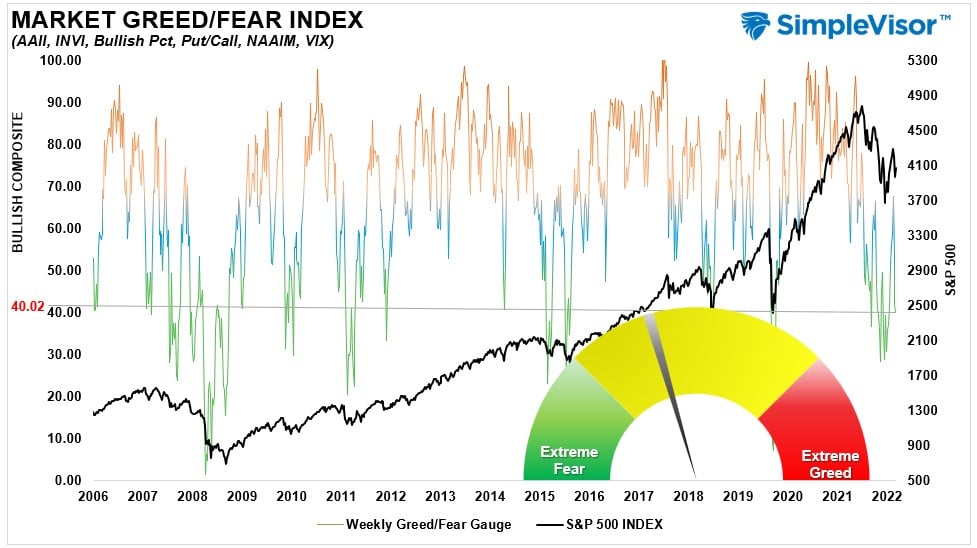
Portfolio Positioning “Fear / Greed” Gauge
The “Fear/Greed” gauge is how individual and professional investors are “positioning” themselves in the market based on their equity exposure. From a contrarian position, the higher the allocation to equities, to more likely the market is closer to a correction than not. The gauge uses weekly closing data.
NOTE: The Fear/Greed Index measures risk from 0 to 100. It is a rarity that it reaches levels above 90. The current reading is 40.02 out of a possible 100.
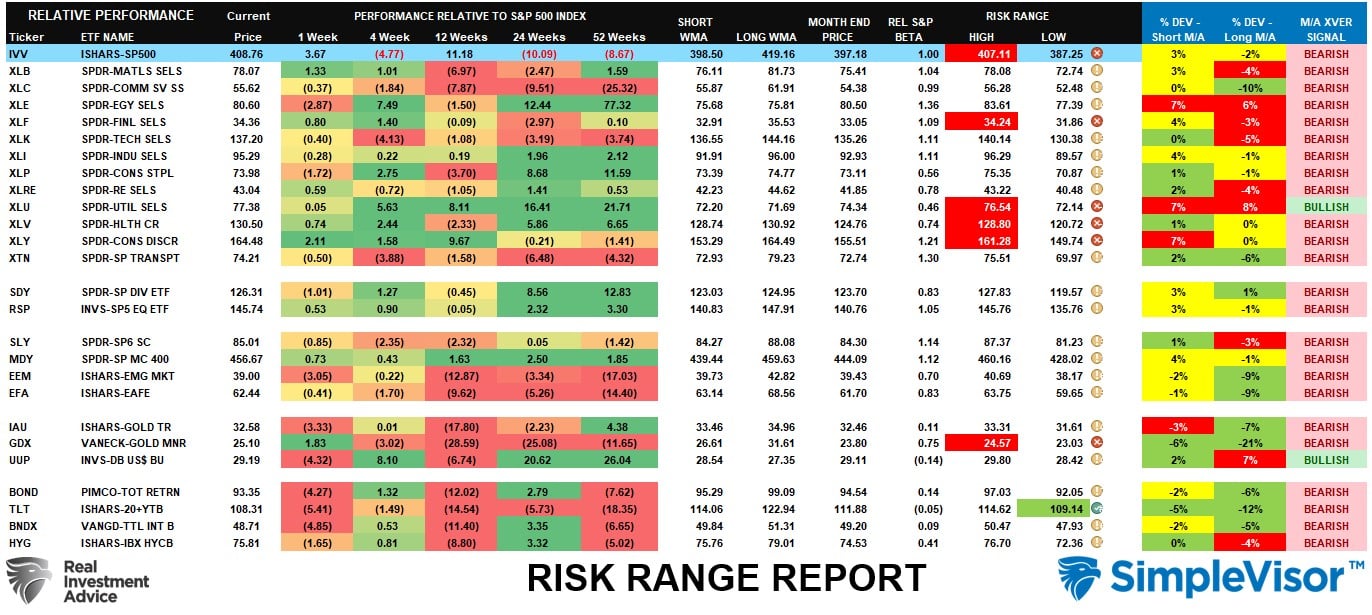
Sector Model Analysis & Risk Ranges
How To Read This Table
- The table compares the relative performance of each sector and market to the S&P 500 index.
- “M/A XVER” is determined by whether the short-term weekly moving average crosses positively or negatively with the long-term weekly moving average.
- The risk range is a function of the month-end closing price and the “beta” of the sector or market. (Ranges reset on the 1st of each month)
- The table shows the price deviation above and below the weekly moving averages.
The S&P 500, Financials, Utilities, Healthcare, Discretionary, and Gold Miners are trading well above their historical monthly ranges in the last week. While the market does have room to rally a bit more next week, some profit-taking would be warranted. The risk of a market reversal remains present for now.
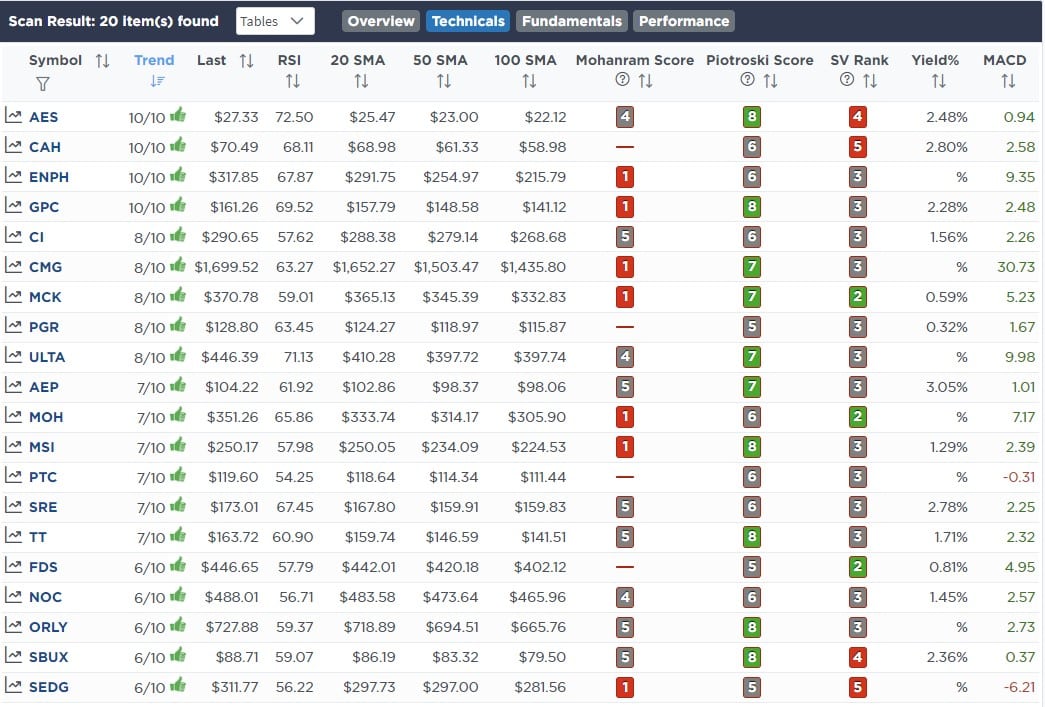
Weekly SimpleVisor Stock Screens
Each week we will provide three different stock screens generated from SimpleVisor: (RIAPro.net subscribers use your current credentials to log in.)
This week we are scanning for the Top 20:
- Relative Strength Stocks
- Momentum Stocks
- Technically Strong With Strong Fundamentals
These screens generate portfolio ideas and serve as the starting point for further research.
(Click Images To Enlarge)
RSI Screen

Momentum Screen
Technical & Fundamental Strength Screen

SimpleVisor Portfolio Changes
We post all of our portfolio changes as they occur at SimpleVisor:
Read Our Full Explanation On Why Added Euros and Bonds To Our Portfolio
Equity & ETF Models
- Adding 2.5% of FXE (Euro Currency Trust)
- Increase TLT to Model Weight of 10% of the Portfolio.

Lance Roberts, CIO
Have a great week!


