Market Oversold As “Sell In May” Approaches


In this 04-15-22 issue of “Market Oversold As ‘Sell In May’ Approaches.”
- Market Review And Update
- Sell In May As The Fed Hikes Rates?
- Portfolio Positioning
- Sector & Market Analysis
Follow Us On: Twitter, Facebook, Linked-In, Sound Cloud, Seeking Alpha
Need Help With Your Investing Strategy?
Are you looking for complete financial, insurance, and estate planning? Need a risk-managed portfolio management strategy to grow and protect your savings? Whatever your needs are, we are here to help.
Schedule your “FREE” portfolio review today.

Market Review & Update
Given this is Easter Weekend, we are just providing a short-market update on our market thoughts as we begin the wrap-up of the seasonally strong period of the year.
On Thursday, markets sold off, reversing the previous day’s gains as April options expiration led to a bout of volatility. The good news is that the market held support at the 50% Fibonacci retracement level even with the selloff. Furthermore, the market is oversold and close to triggering a short-term buy signal.
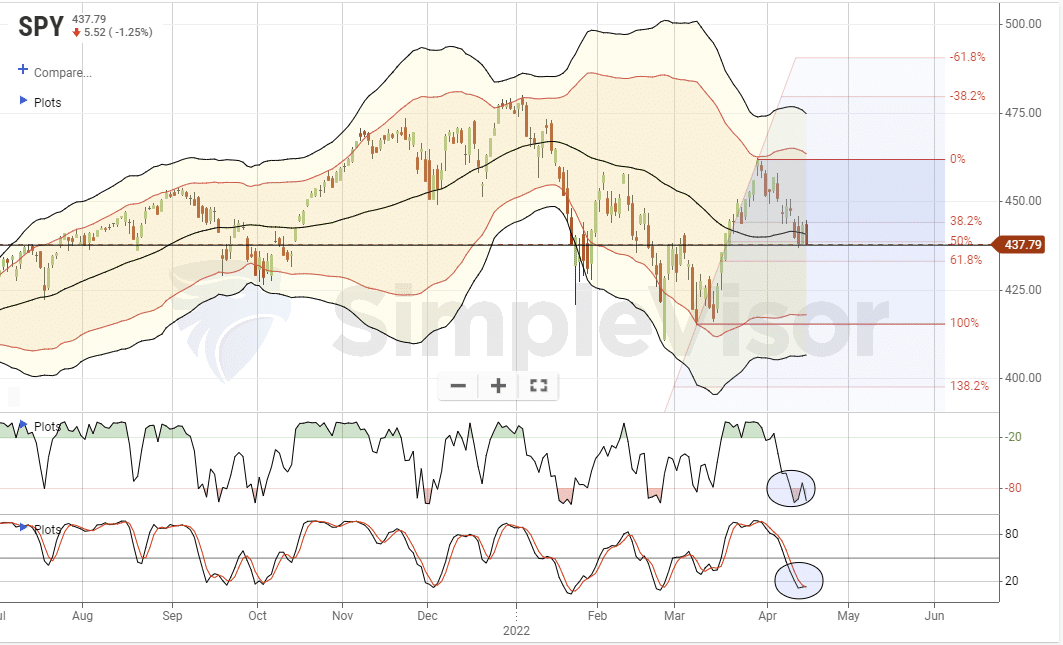
Given the oversold market condition and the fact the week after “tax day” trends positive as liquidations to pay tax bills complete, the odds for a reflexive rally are encouraging.
However, as we will discuss next, any rally into May is likely a good opportunity to reduce and rebalance portfolio equity risk.

Not Always What We Think
“If you believe something that you learned from your parents, or teachers, when you were young and have never questioned; how many things about investing and finance do you believe today but have never questioned?” – Greg Morris
From this point, I want to discuss the issue of “Sell In May.”
Let’s start with a basic assumption.
I am going to give you an opportunity to make an investment where 70% of the time you will win, but by the same token, 30% of the time you will lose.
It’s a “no-brainer,” right?
So, you invest and immediately lose. In fact, you lose the next two times, as well. Unfortunately, you just happened to get all three instances where you lost money out of ten. Does it make the investment any less attractive? No.
However, this is what happens to investors all the time. They read about some investment strategy or discipline that historically has had a very high success rate, so they jump in. Of course, as luck would have it, the next year, market dynamics change, and the strategy doesn’t work. Since that strategy is obviously flawed, they jump to the next “hot” trend from last year.
This “rotation” can be seen in the JP Morgan Periodic Table Of Returns. Most investors tend to “buy” whatever was “hot” last year, but as you can see, it rarely stays that way for long. I have highlighted Momentum and Value factors. Not surprisingly, those that bought into the Value or Momentum story when it was hot found out soon after it was not.
Wash. Rinse. Repeat.

This Week’s MacroView

Should You Sell In May
Over the past two summers, “sell in May” did not work as the market rallied strongly. As such, you missed the gains in the summer of 2021, for example, but caught the current patch of weakness heading into May.
Does this mean the strategy is broken? Periods like the last two years have investors questioning it.
However, the history of “Sell In May” clearly shows the benefit of avoiding the weaker months.
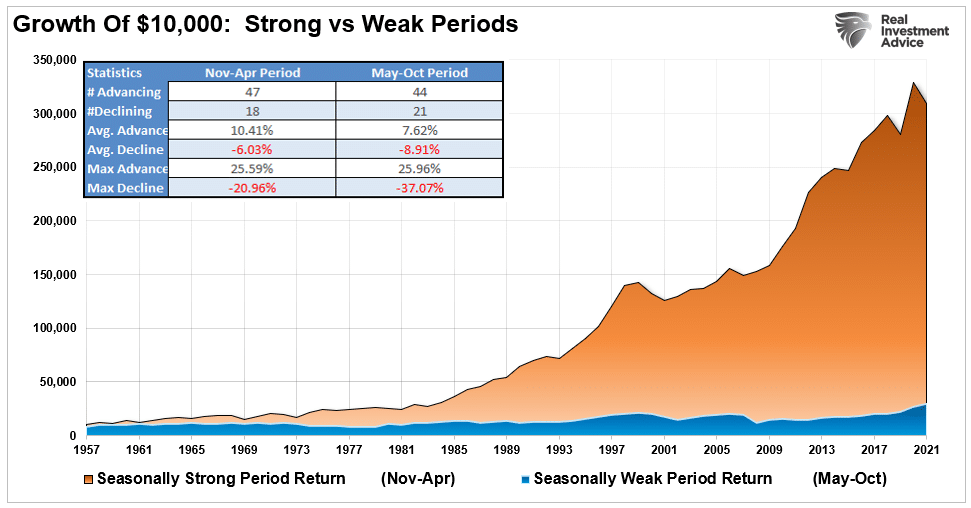
In practice, however, it is not an advisable strategy.
While getting completely out of the market is fairly easy, the psychology of reinvesting those funds is a more difficult challenge. Investors never want to take on risk when stocks sell-off.
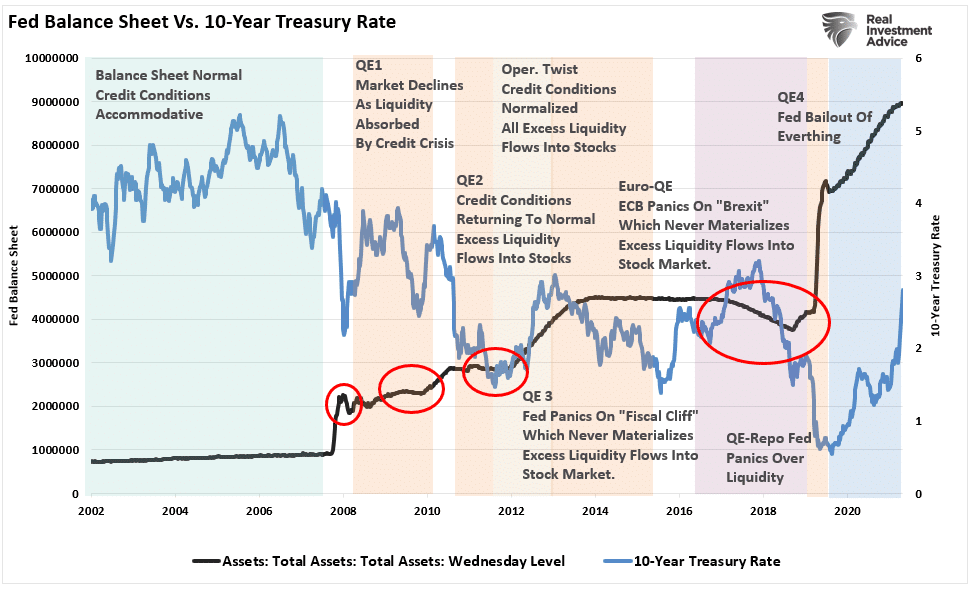
However, as we head into this particular summer season, it may be worth being more cautious on the equity side of the ledger. As shown below, when the Fed is hiking interest rates AND reducing its balance sheet, equity markets tend not to perform well.
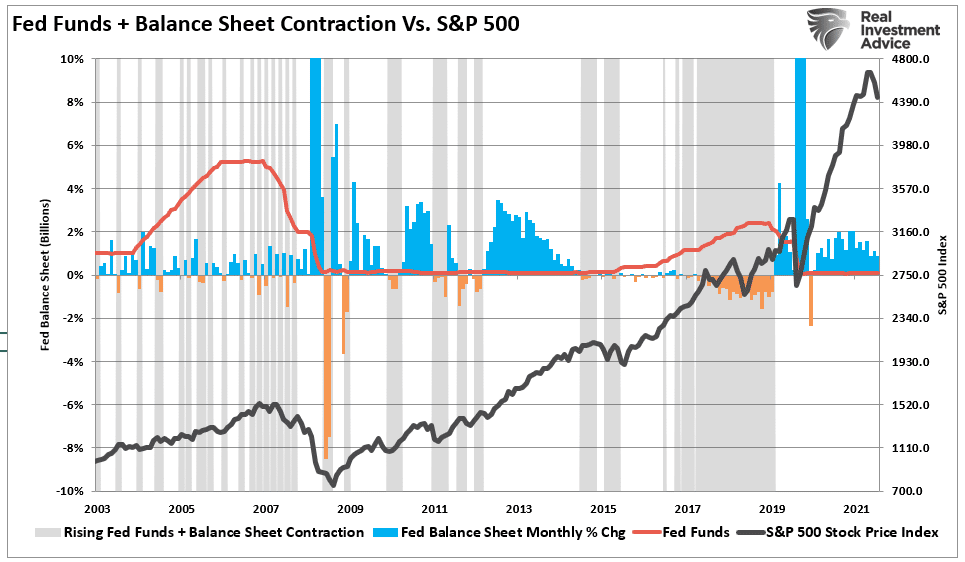
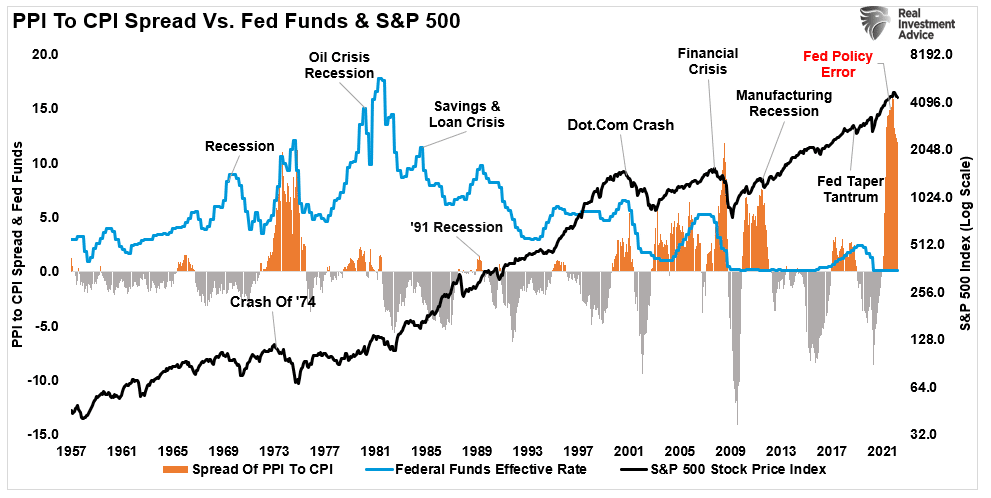
Such does not absolutely guarantee poor performance. However, it is hard to imagine stocks performing exceptionally well when monetary liquidity is removed as consumers wrestle with higher inflationary pressures. Speaking of inflation, the spread between the consumer and producer price indices continues to widen, suggesting difficulty for equity markets.
While we don’t suggest “getting out” of the market entirely heading into the summer months, remaining underexposed to equity risk will likely provide better outcomes. Also, the bond market oversold condition is extreme. Importantly, bonds tend to outperform equities when “times get rough.” As noted previously, bonds also perform much better when the Fed is tapering its balance sheet.
The Fed will announce the start of its balance sheet tapering in May as it hikes rates by 0.5%.
We will see just how much the markets have priced in.

Portfolio Update
We made no changes to our models last week. We continue to expect the next few weeks, and even the next couple of months could remain frustrating. As noted above, the markets are oversold short-term, but there is a good bit of selling pressure remaining in the market currently, limiting the upside to markets near term.
The one catalyst that could help stocks next week is the ramp-up of the earnings season. However, forward guidance will likely be more negative than many expect, which could create additional volatility in pockets of the market. Over the next few weeks, the difference in portfolios will likely be the choice of equity selection and weightings more than anything else.

However, with that said, I do want to repeat our conclusion from last week.
“Due to fund managers’ negative sentiment, seasonality, and high cash levels, we remain more optimistic about the markets. However, we remain cautious due to the broader macro risks.
There is little value in trying to predict market outcomes. The best we can do is recognize the environment for what it is, understand the associated risks, and navigate cautiously.
Leave being “bullish or bearish” to the media.”
Have a very Happy Easter.
Market & Sector Analysis
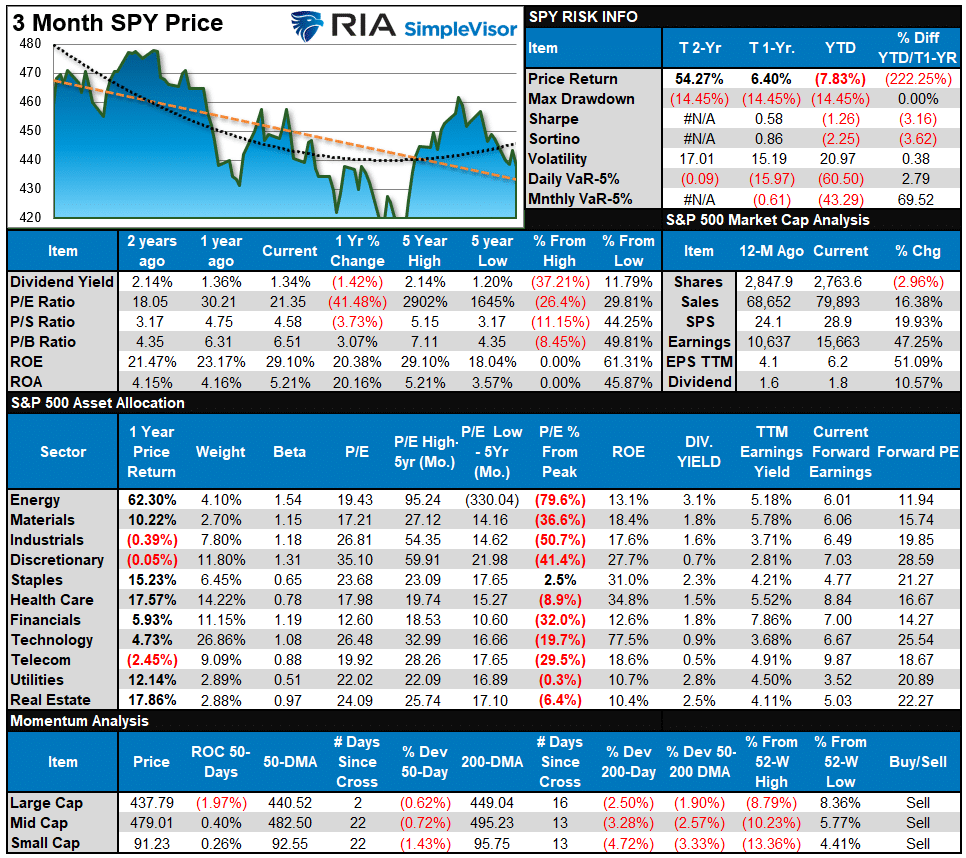
S&P 500 Tear Sheet
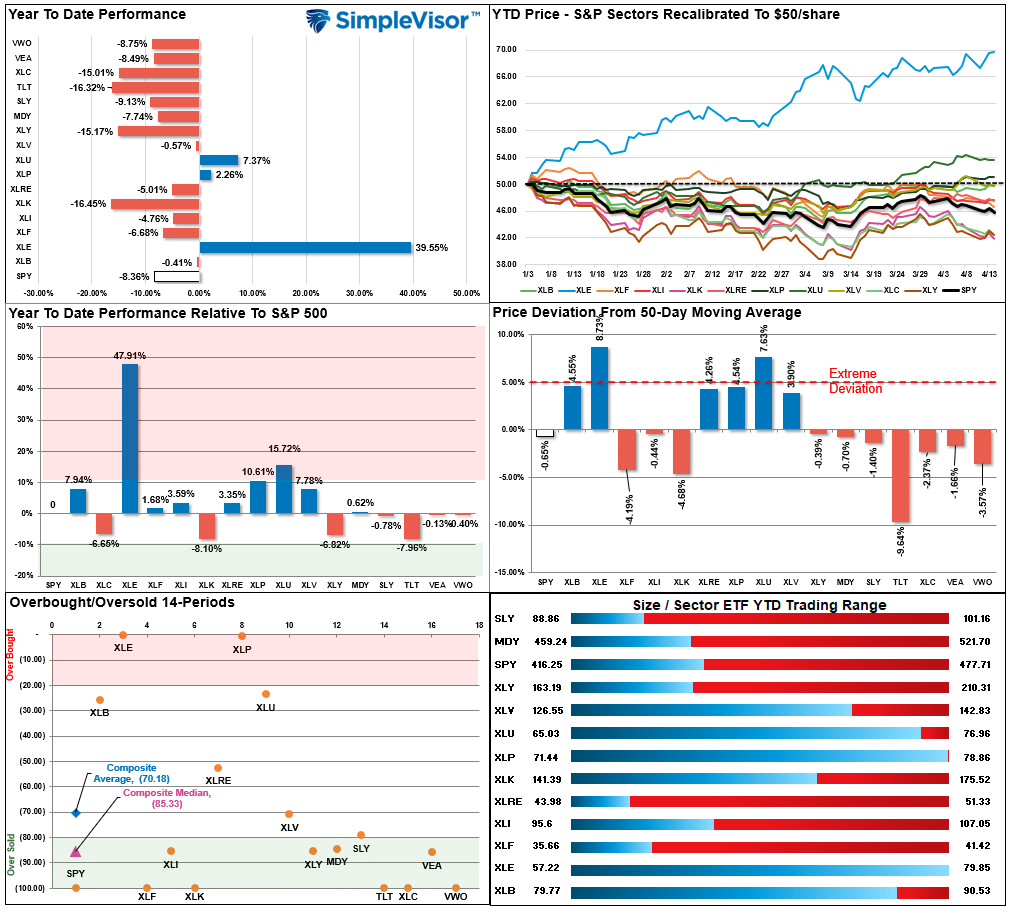
Relative Performance Analysis
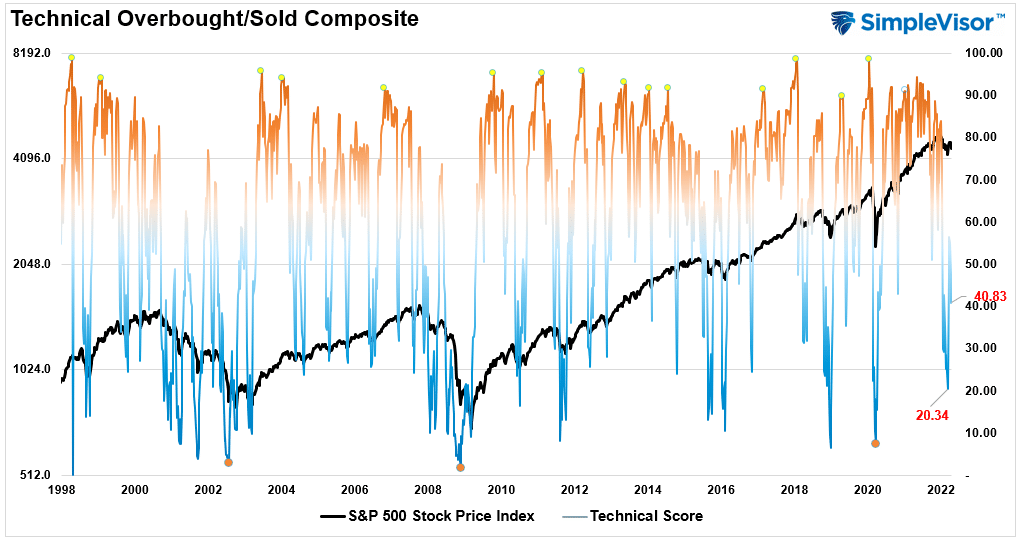
Technical Composite
The technical overbought/sold gauge comprises several price indicators (RSI, Williams %R, etc.), measured using “weekly” closing price data. Readings above “80” are considered overbought, and below “20” are oversold. The current reading is 40.83 out of a possible 100.
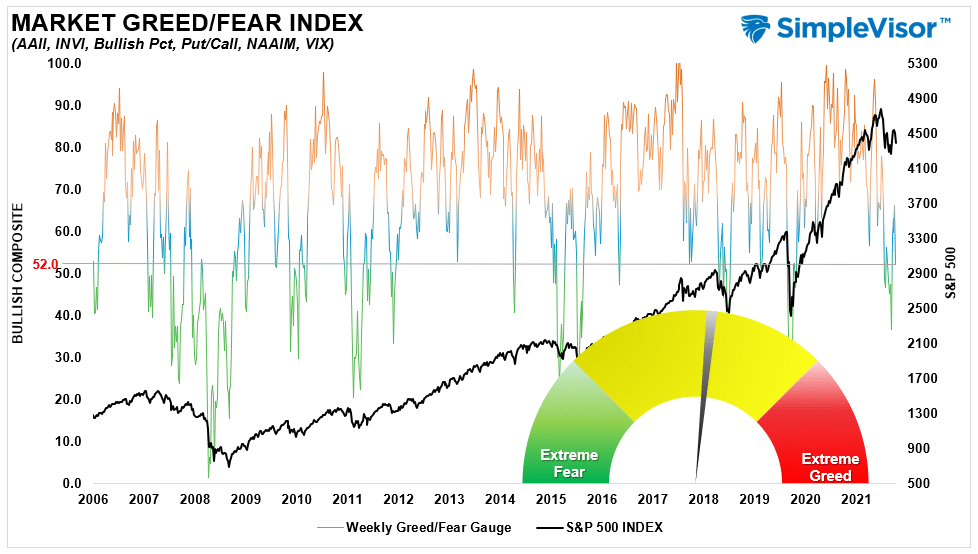
Portfolio Positioning “Fear / Greed” Gauge
The “Fear/Greed” gauge is how individual and professional investors are “positioning” themselves in the market based on their equity exposure. From a contrarian position, the higher the allocation to equities, to more likely the market is closer to a correction than not. The gauge uses weekly closing data.
NOTE: The Fear/Greed Index measures risk from 0 to 100. It is a rarity that it reaches levels above 90. The current reading is 52.0 out of a possible 100.
Sector Model Analysis & Risk Ranges
How To Read This Table
- The table compares the relative performance of each sector and market to the S&P 500 index.
- “M/A XVER” is determined by whether the short-term weekly moving average crosses positively or negatively with the long-term weekly moving average.
- The risk range is a function of the month-end closing price and the “beta” of the sector or market. (Ranges reset on the 1st of each month)
- The table shows the price deviation above and below the weekly moving averages.
- The complete history of all sentiment indicators is under the Dashboard/Sentiment tab at SimpleVisor.

Weekly Stock Screens
Each week we will provide three different stock screens generated from SimpleVisor: (RIAPro.net subscribers use your current credentials to log in.)
This week we are scanning for the Top 20:
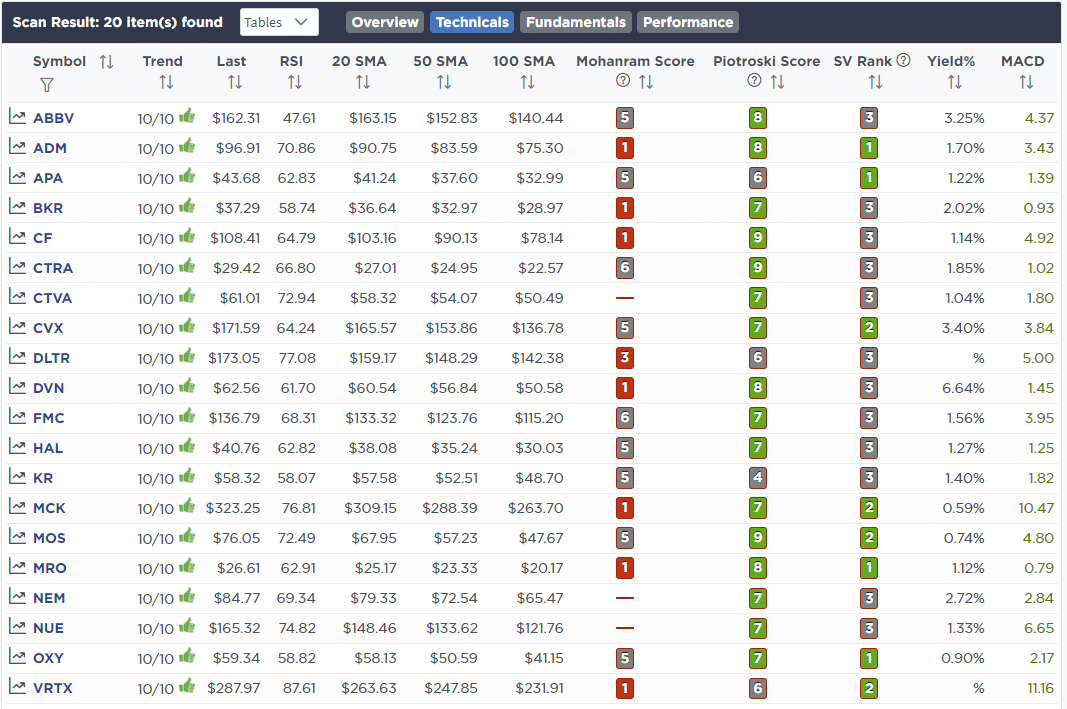
- Relative Strength Stocks
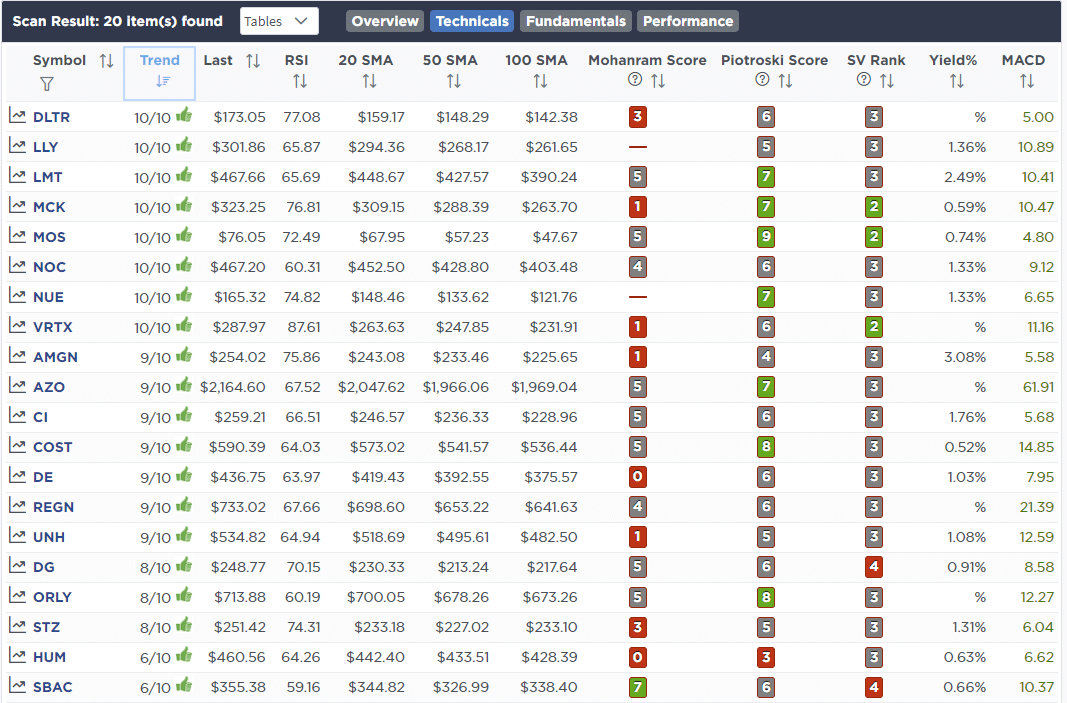
- Momentum Stocks
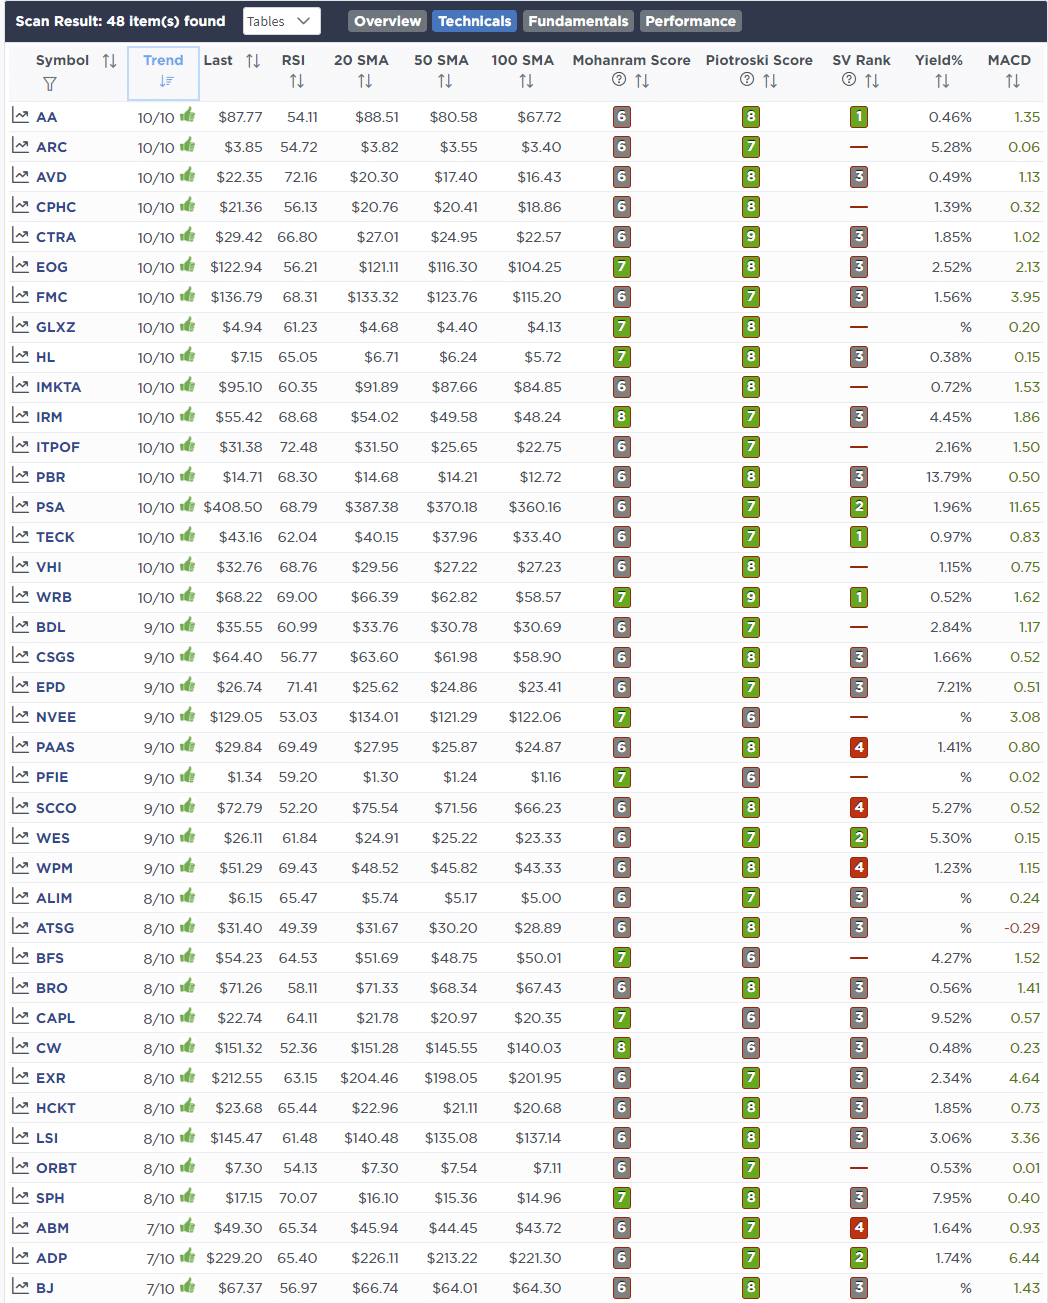
- Technically Strong With Strong Fundamentals
These screens generate portfolio ideas and serve as the starting point for further research.
(Click Images To Enlarge)
RSI Screen
Momentum Screen
Technical & Fundamental Strength Screen
SimpleVisor Portfolio Changes
We post all of our portfolio changes as they occur at SimpleVisor:
No portfolio changes this week.

Lance Roberts, CIO
Have a great week!


