Fed Signals Taper. Will It Be Different This Time?


In this 06-18-21 issue of “Fed Signals Taper. Will It Be Different This Time?“
- Market Fails At Highs
- Will It Be Different This Time.
- Inflation Is Surging But Will It Last
- Portfolio Positioning
- #MacroView: Rates, Dollar & The 2021 Outlook
- Sector & Market Analysis
- 401k Plan Manager
Follow Us On: Twitter, Facebook, Linked-In, Sound Cloud, Seeking Alpha
Are you worried about the potential for a market correction, a surge in inflation, or are you unsure how to invest for your retirement? We can help. If you are not yet a client and would like to discuss your portfolio construction, please schedule a time to meet with one of our advisors below.

Market Fails At Highs As Fed Spooks Markets
Last week, we reviewed our “buy signals” and the advance over the past month. As we concluded:
“While the market did hit all-time highs this week, it was a feeble rally. Such is not a sign of confidence the ‘highs’ will stick.”
Well, not only did the highs not stick, but the 50-dma failed during Friday’s sell-off. The market closing at its lows suggests we could see some more selling early next week. The “good news,” if you want to call it that, is that the “sell signal” is moving quickly through its cycle. Such suggests that selling pressure may remain limited and may resolve itself by the end of June.
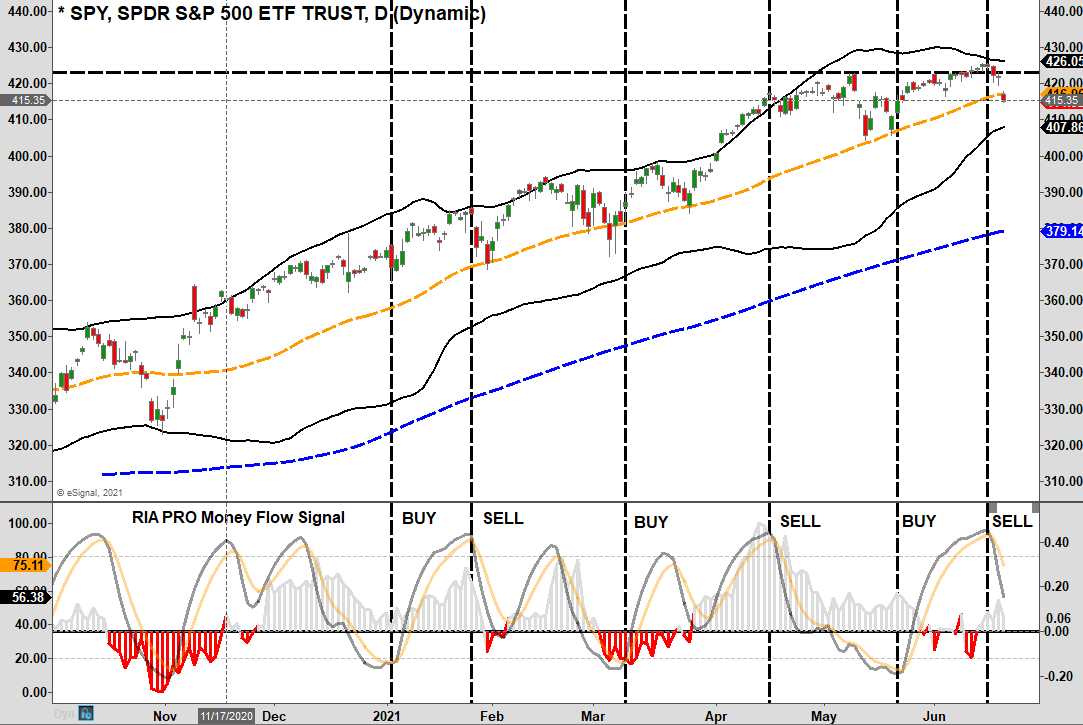
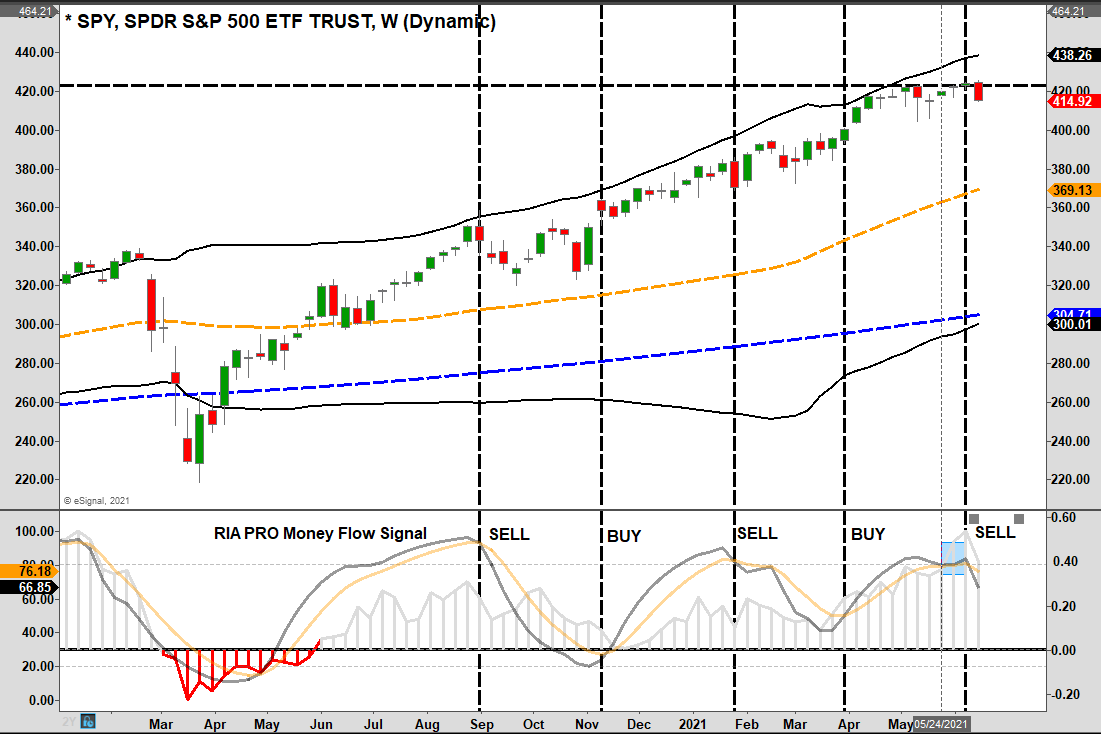
The “not-so-good” news is on the weekly chart. Our previous discussions warned that if the daily and weekly “sell signals” align, such has often coincided with more “corrective” rather than “consolidative” actions. Importantly, weekly signals are only valid at the close of the week. On Friday, the weekly “sell signal” triggered suggests a period of correction/consolidation is probable.
As we noted several times over the last few weeks, we set our expectations for a 5-10% correction between mid-June and July. With both signals triggered, we reduced our equity exposure and raised cash levels further.
Let me reiterate what we said last week:
“For now, the bullish trend remains intact. Therefore, there is no need to get overly defensive at this juncture. However, being excessively complacent and not applying some risk management to portfolios will leave you flat-footed when the correction does come.
There are plenty of warnings that suggest ‘carrying an umbrella’ may come in handy.
This past week, the Fed’s perceived change in policy stance allowed those with an “umbrella” to weather the sudden storm.

Will It Be Different This Time
Both Michael Lebowitz and I recently discussed the Fed starting to “think about thinking about tapering.” This week’s Fed meeting was a clear indication such was in play and will likely get announced at the annual Jackson Hole “confab” of Central Bankers.
https://www.youtube.com/watch?v=R9xzSGpPqpk
As noted following the latest FOMC meeting, the Fed kept the benchmark rate and the pace of bond-buying unchanged at $120 Billion per month. However, the most significant shift was the more hawkish tilt to its rate forecasts. As shown below, courtesy of Zerohedge, the median projections now show 2-rate hikes by end-2023. Notably, 7 of the FOMC members see a rate hike in 2022.
Chart courtesy of Zerohedge
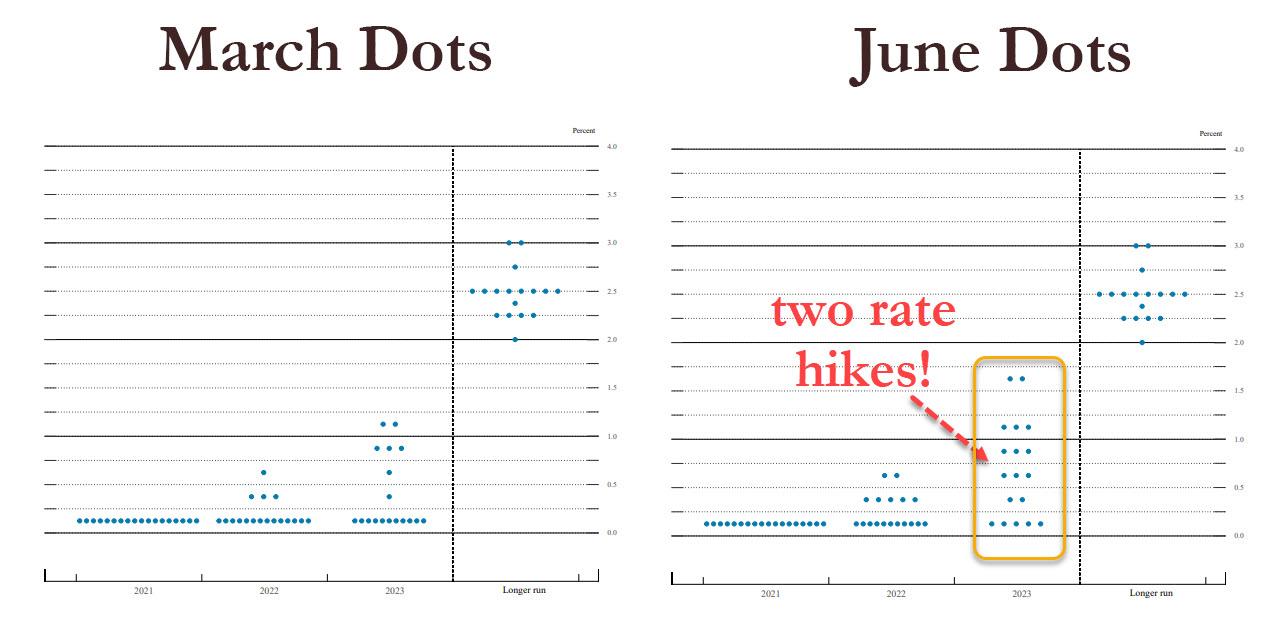
“For those confused by the Rorschach above, the 2023 median dot was a lot higher; in fact, only five members had rates unchanged up from 11 in March. The median is now 0.625% higher than anyone was reasonably expecting! That said, the sheer dispersion of dots in 2023 suggests the Fed doesn’t really know what the outlook looks like. Rather, the ‘median of 2 hikes’ in 2023 a byproduct of a lot of different views (on hawkish/dovish side). Such is not a clear message to the markets, and can easily change as soon as there is a deflationary whiff in the economy.” – Zerohedge
There are two essential things to take away from that analysis.
- The announcement is very positive for the dollar and sets up the Fed to announce the beginning of the “taper” of the bond-buying programs; and,
- “This time is not different” as the taper and eventual rate hikes are bond positive and stock negative.
Taper Starts The Clock
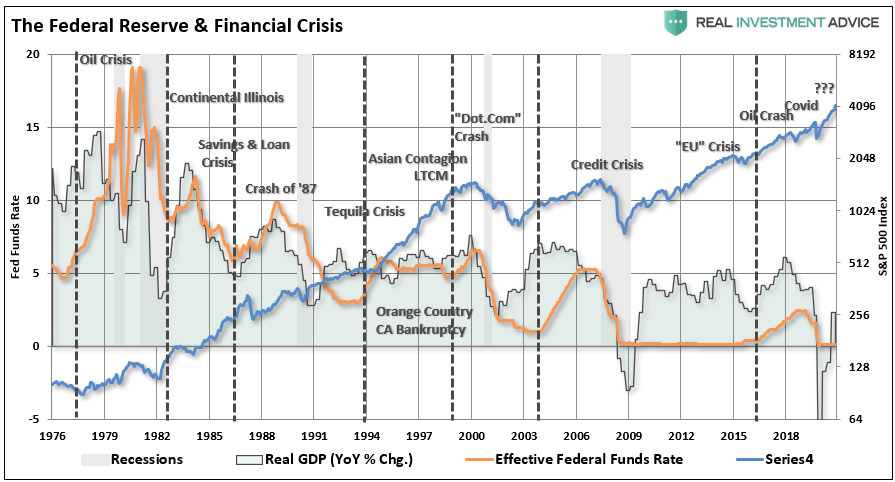
Despite comments to the contrary, the correlation between the Fed’s balance sheet and the S&P 500 is evident. Whether the correlation is due to liquidity moving into assets through leverage or just the “psychology” of the “Fed Put,” the result is the same.
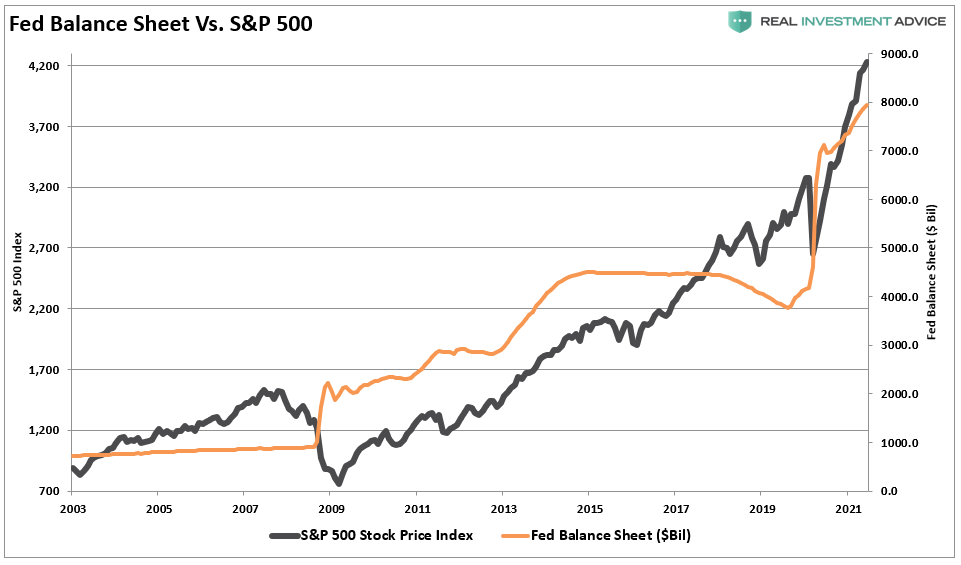
Therefore, it should also not be surprising that when the Fed starts “tapering” their bond purchases, the market tends to witness increased volatility. The grey shaded bars in the chart below show when the balance sheet is either flat or contracting.
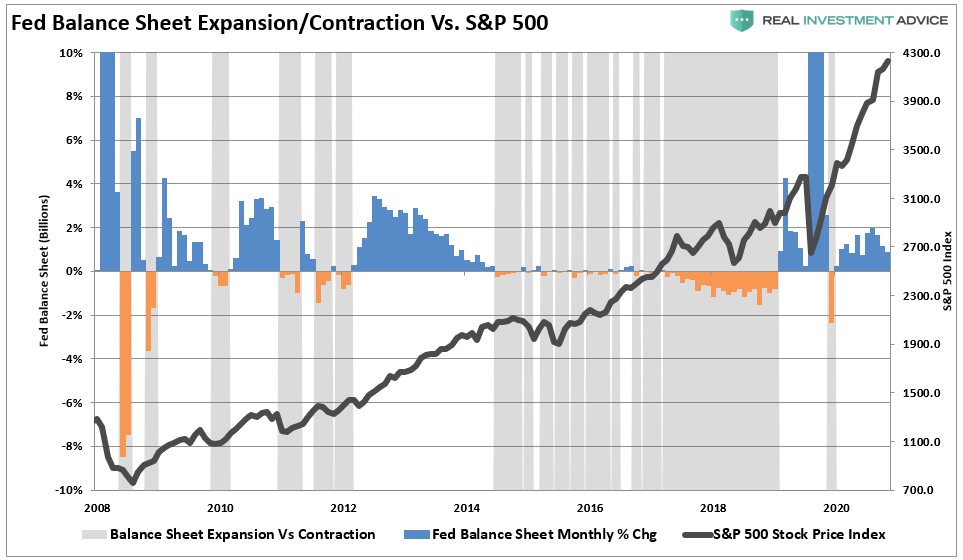
The risk of a market correction rises further when the Fed is both tapering its balance sheet and increasing the overnight lending rate. The negative impact of tighter monetary policy on asset prices is of no surprise.
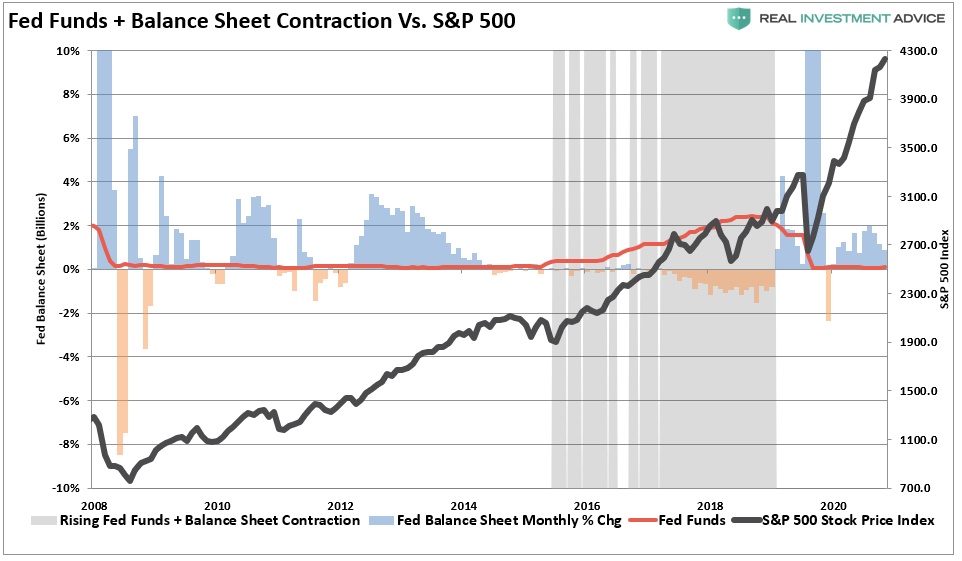
What we now know, after more than a decade of experience, is that when the Fed starts to slow or drain its monetary liquidity, the clock starts ticking to the next corrective cycle.
Inflation Is Surging But Will It Last
With the latest reports on prices, the inflation surge has become overwhelmingly visible. However, as discussed previously, the question we must answer is whether it will last?
This past week, we saw both the CPI and PPI reports come in both now above their long-term trends. However, it is the annual rate of change with which we are most concerned. As shown below, the current spread between PPI and CPI hit another record.
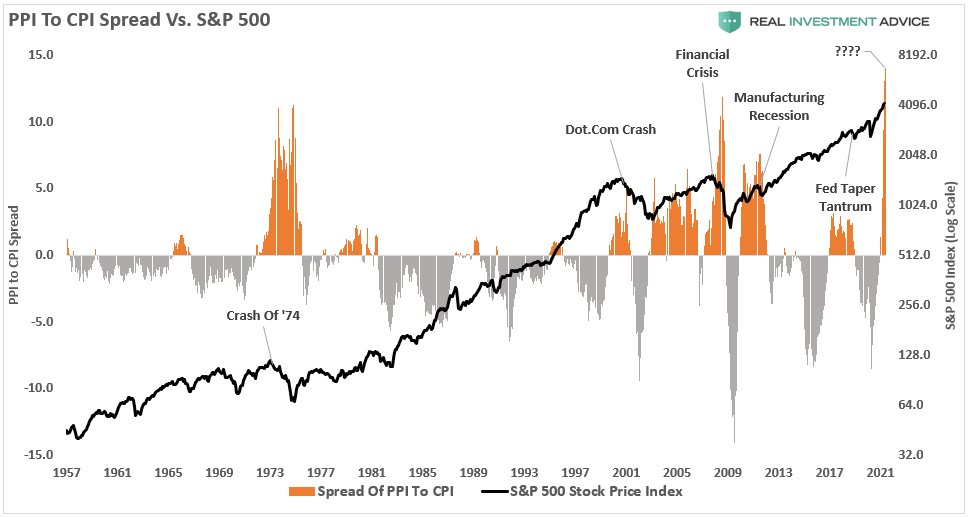
Please pay attention to this spread as it shows producers cannot pass along inflation to their customers. Therefore, the retained inflation, and by this measure, a lot of it, will erode profit margins and earnings in the future.
Import and export prices also show a strong surge relative to GDP growth. While increased export prices are good for exporters (~40% of corporate profits,) increased import costs impede consumption and domestic production. As such, it is not uncommon to see weaker economic growth following such episodes.
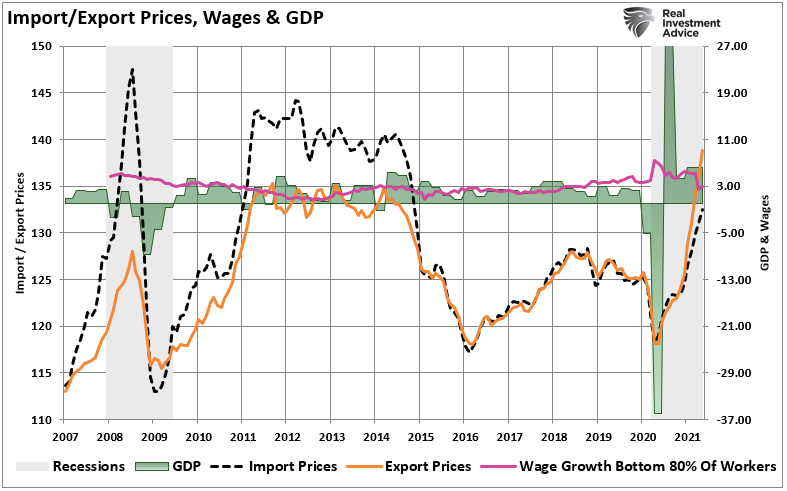
It is also worth noting that “wages” for the bottom 80% of workers continue to weaken despite the “strong” recovery. Such will make it very difficult for consumers to absorb higher costs and continue to consume at current levels.
Read More On This Issue In This Week’s #MacroView

The Coming Dollar Rally
“Inflation is always and everywhere a monetary phenomenon in the sense that it is and can be produced only by a more rapid increase in the quantity of money than in output.” – Milton Friedman
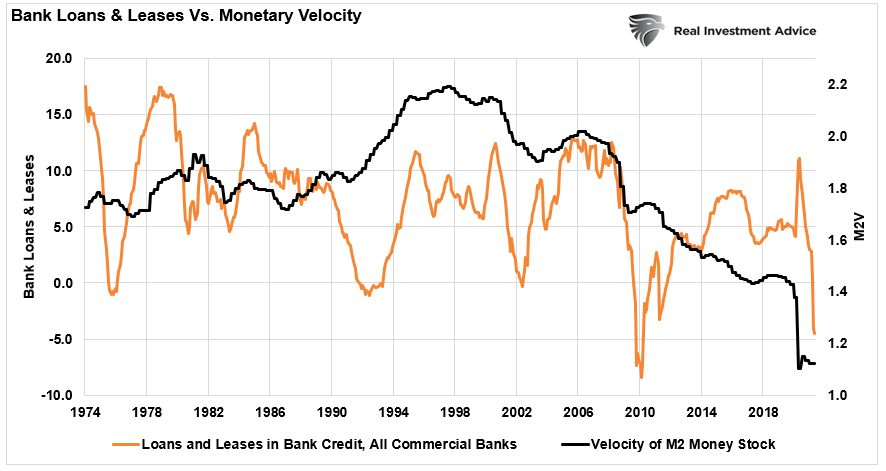
Currently, there is no argument money supply has exploded without a corresponding increase in economic output. If there were, bank loans and monetary velocity would be on the rise. Unfortunately, such isn’t the case currently.
Furthermore, the weakness of the U.S. dollar contributes to the inflationary push in the economy as it increases the costs of imported goods.

However, these forces are why the current “inflationary surge” will become deflationary by the end of the year. Moreover, as noted above, this deflationary surge combined with the “Fed taper” is “dollar positive.”
Currently, wages are lagging higher costs amid a weaker dollar (purchasing power). Furthermore, as the previous stimulus leaves the system, purchasing power will fade. As such occurs, economic growth, import prices, and inflation will decline as the dollar tends to strengthen.
Unfortunately, for the Fed, they are really in a tough spot. As discussed previously, the Fed should be using the $120 billion in monthly QE to start hiking rates to prepare for the next recession slowly. But, instead, they will kick the “policy can” further down the road. The longer they wait, the harder it will be to pull off normalization without risking significant market volatility and reversing the economic recovery.
Of course, history already shows such is what will happen.
There have been ZERO times in history when the Fed started a rate hiking campaign that did not lead to a negative outcome.
We suggest this time won’t be any different.
Portfolio Update
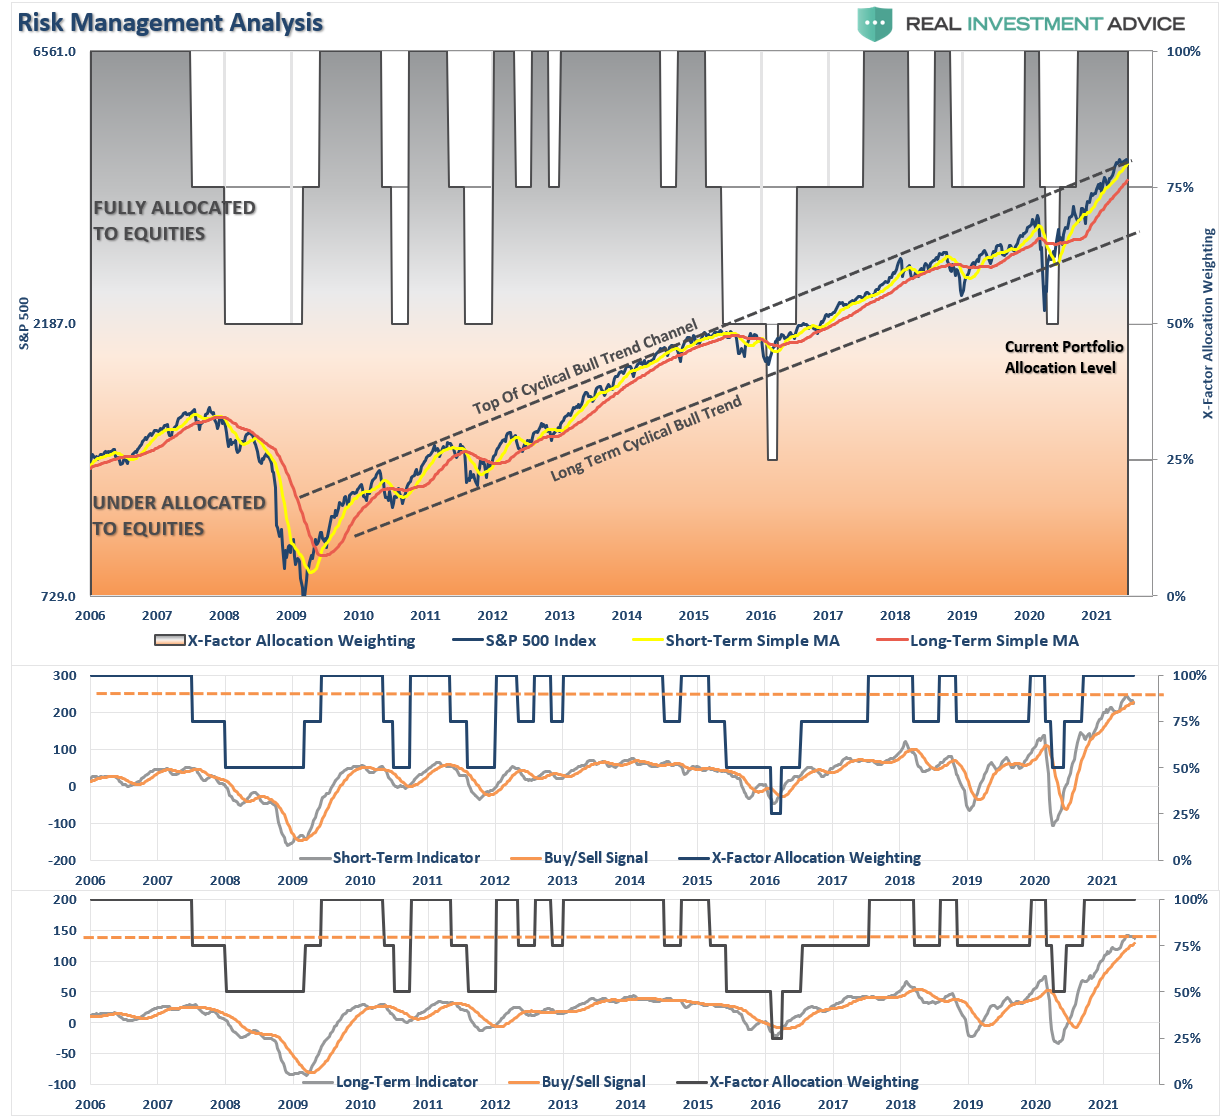
As noted above, with support near current market levels and plenty of liquidity fueling markets, downside risk remains limited.
Such does not mean you should be complacent. However, you should also not be overly defensive at this juncture either.
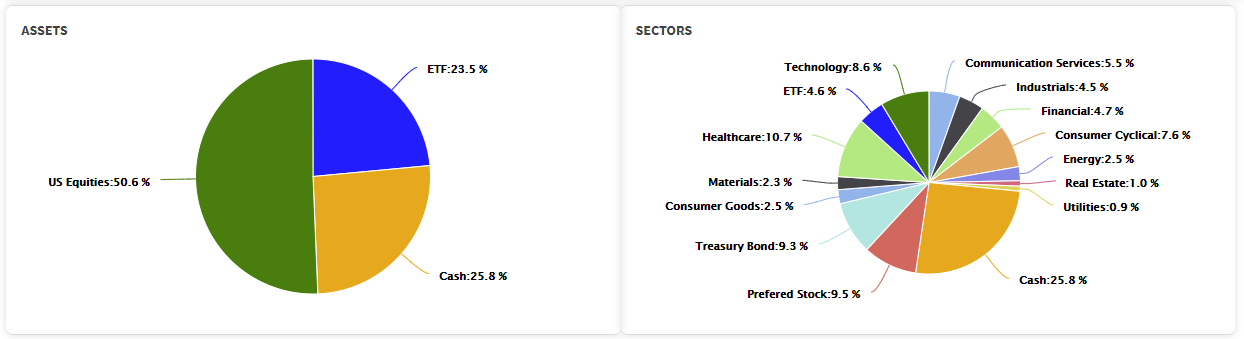
As noted last week, we did raise some cash recently but are still long our primary core positions. The rotation from “value” to “growth” continued this week, suggesting that markets are already sensing a return to a deflationary environment. We currently carry a “barbelled” portfolio holding an inflationary tilt. However, the deflationary holdings continued to hedge our risk last week.
We also had previously increased our bond duration by adding longer-duration treasuries to our portfolios which also gained ground with the Fed’s stance. As a result, we are opportunistically adding to our duration and reducing excess cash holdings.
As noted in Slowly At First:
“Understanding that change is occurring is what is essential. But, unfortunately, the reason investors ‘get trapped’ in bear markets is that when they realize what is happening, it is far too late to do anything about it.
Bull markets are lure investors into believing ‘this time is different.’ When the topping process begins, that slow, arduous affair gets met with continued reasons why the ‘bull market will continue.’ The problem comes when it eventually doesn’t. As noted, ‘bear markets” are swift and brutal attacks on investor capital.'”
Pay attention to the market. The action this year is very reminiscent of previous market topping processes. However, tops are hard to identify during the process as “change happens slowly.”
If you need help or have questions, we are always glad to help. Just email me.
See You Next Week
By Lance Roberts, CIO
Market & Sector Analysis
Analysis & Stock Screens Exclusively For RIAPro Members
Discover All You Are Missing At RIAPRO.NET
Come find out what our RIAPRO.NET subscribers are reading right now! Risk-Free For 30-Day Trial.
- Sector & Market Analysis
- Technical Gauge
- Fear/Greed Positioning Gauge
- Sector Rotation Analysis (Risk/Reward Ranges)
- Stock Screens (Growth, Value, Technical)
- Client Portfolio Updates
- Live 401k Plan Manager

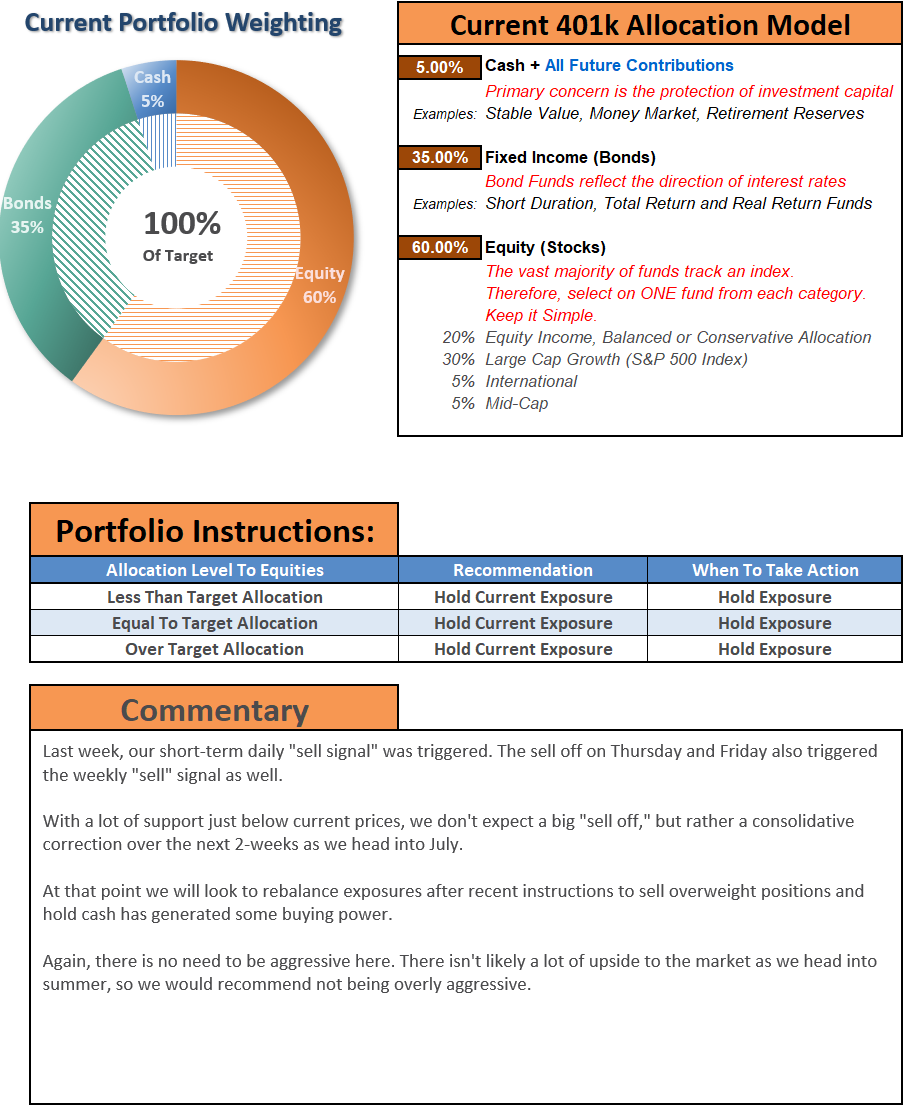
THE REAL 401k PLAN MANAGER
A Conservative Strategy For Long-Term Investors
If you need help after reading the alert, do not hesitate to contact me.

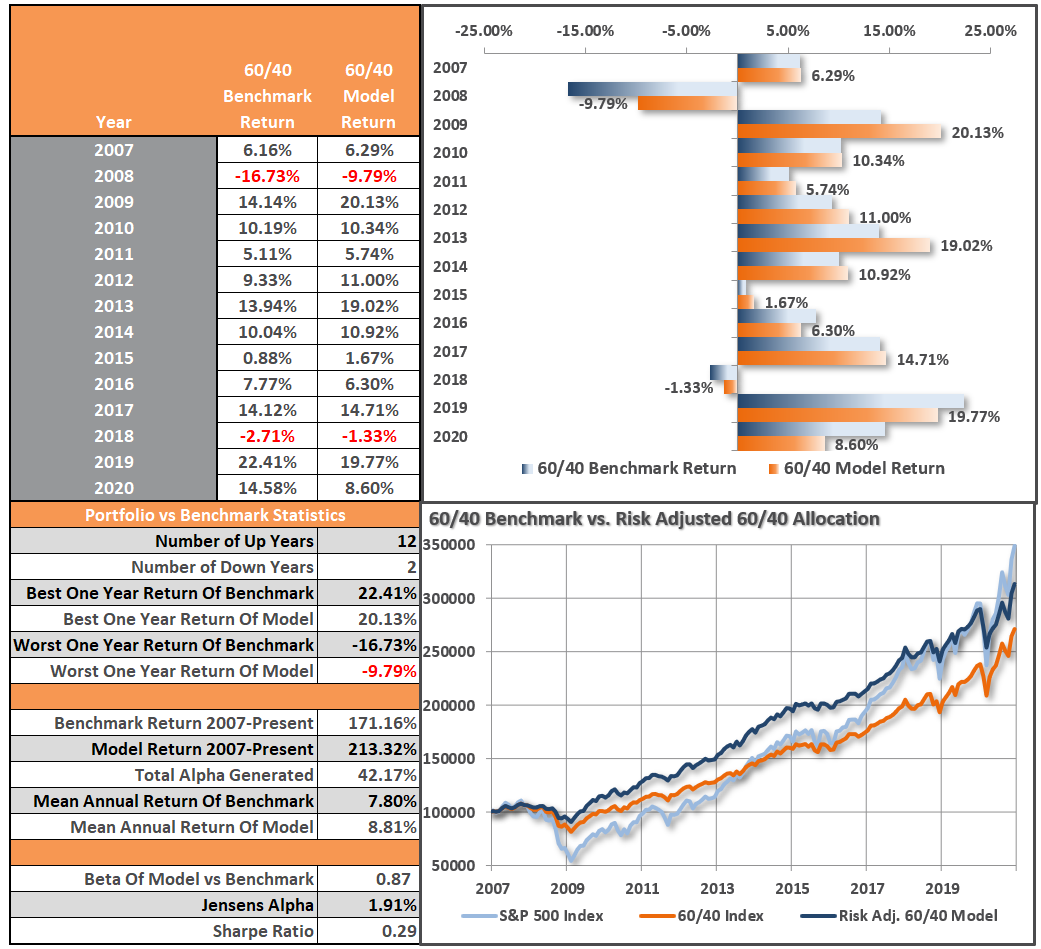
Model performance is a two-asset model of stocks and bonds relative to the weighting changes made each week in the newsletter. Such is strictly for informational and educational purposes only, and one should not rely on it for any reason. Past performance is not a guarantee of future results. Use at your own risk and peril.
Have a great week!


