So Far, The Bulls Are Disappointed In “Santa” (Full Version)


In this issue of “So Far, The Bulls Are Disappointed In Santa.”
- An Administrative Note
- Only Two-Days Left For Santa To Deliver
- Portfolio Positioning Update
- MacroView: Shades Of 1999 As “Market Mania” Returns
- Sector & Market Analysis
- 401k Plan Manager
Follow Us On: Twitter, Facebook, Linked-In, Sound Cloud, Seeking Alpha
RIA Advisors Can Now Manage Your 401k Plan
Too many choices? Unsure of what funds to select? Need a strategy to protect your retirement plan from a market downturn?
RIA Advisors now has the capability to manage your 401k plan for you. It’s quick, simple, and transparent. In just a few minutes we can get you in the “right lane” for retirement.

Catch Up On What You Missed Last Week

Administrative Note
For many of our loyal readers, 2020 was a very tough year. From family tragedy to job loss, business loss, and financial hardships due to the pandemic and economic shutdowns. I know this from the hundreds of emails I have received over the last 9-months.
As we turn the page on the calendar to embark upon a new year, I want to wish you and your families a safer, happier, healthier, and more prosperous year.
I also want to thank you for your continued readership and support in so many ways.
The whole team at RIA Advisors works hard to deliver the information you need to navigate the markets and financial decisions in the years ahead. We value your feedback and are always striving to improve our service to you.
In 2021, we are launching a redesigned website, an automated investment service, online financial planning tools, direct 401k account management, and much more. All to help you be more productive and prosperous in meeting your goals. We are excited about all the changes we are making to serve you better.
Most of all, “thank you” for trusting in us.
Happy New Year.
Only Two-Days Left For Santa To Deliver
Today’s newsletter will be a short update as not much has changed during this holiday-shortened week.
Over the last month, we have discussed why we were positioning portfolios to participate in the traditional year-end “window dressing” rally. Such is also known as the “Santa Claus” rally.
As discussed last week in “All I Want For Christmas Is A Bull Market.”
“Whether optimism over a coming new year, holiday spending, traders on vacation, institutions squaring up their books before the holidays—or the holiday spirit—the bottom line is that bulls tend to believe in Santa Claus.” – Ryan Detrick

While the statistics suggested that the last week of December should have been a bullish one, it didn’t entirely turn out that way. Okay, let’s be honest, it was just a bit disappointing. Lot’s of chopping around all week and a final spurt at the close yesterday. Not exactly confidence-inspiring.
As shown in the chart below, the market closed just 0.87% higher than the previous all-time high set mid-month. However, the good news is the last high did hold as support. Such sets up the possibility for “Santa” to “deliver” on the New Year’s first two days.
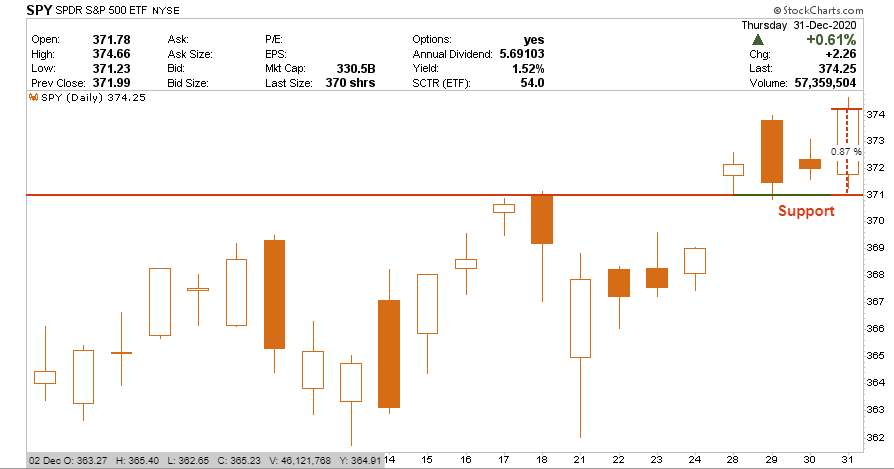
Also, another bullish setup is that the short-term technical money-flow signals have gotten a bit oversold. From these levels, it would not be surprising for the market to stage a short-term rally during the first couple of weeks of January. Such was a point I made earlier this week:
We added to our $SPY longs yesterday for the remainder of the #SantaCalus rally period. With #moneyflows decently oversold, and markets holding their recent breakout highs, we may have some limited upside. #Market remain… https://t.co/VRlpZ7uifl pic.twitter.com/rxllu2aI90
— Lance Roberts (@LanceRoberts) December 30, 2020
It certainly seems as if there is no risk. But maybe that is the risk.

Everyone Is On The Same Side Of The Boat
Currently, every single analyst has the same story going into 2021.
- Prepare for an economic boom.
- Interest rates will rise.
- Inflation is coming back.
- The stock market is going to 4100-4500
- Small-caps are the new “new trade.”
You get the idea. Everyone is incredibly “bullish” about the coming year.
While that “wish list” could undoubtedly turn out to be the case, there is much that could go wrong. More importantly, there is also Bob Farrell’s truism, which is:
“When all experts agree, something else tends to happen.”
The biggest problem, of course, is the debt. If inflation does indeed rise, interest rates will also increase due to the surge in the money supply. Somewhere between 1-2% on the 10-year Treasury, the proverbial “wheels” come off the $86 Trillion debt “cart.”
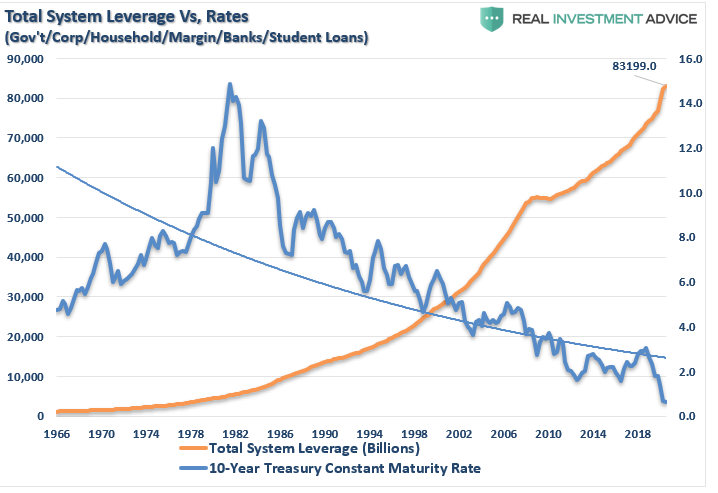
With the gap between economic growth and debt at the highest levels on record, even small increases in debt service costs have an immediate and negative impact on growth.

While analysts may indeed get what they wish for in the first half of 2021, they may well regret it by the second half.
With literally everyone “in the pool” and leveraged, the big surprise in 2021 could very well be the unwinding of over-confidence.

What Happens After A Third 10% Year Of Gains?
While working on this week’s newsletter, I stumbled across this piece of analysis from DataTrek Research:
“Since 1928 (93 years), there have only been 5-times where markets returned 10% gains for 3 or more years in a row.
- World War II (4 years): 1942 (+19%), 1943 (+25%), 1944 (+19%) and 1945 (+36%)
- Korean War (4 years): 1949 (+18%), 1950 (+31%), 1951 (+24%) and 1952 (18%)
- Start of Vietnam War (3 years): 1963 (+23%), 1964 (+16%), and 1965 (+12%)
- Late 1990s Bull Market (5 years): 1995 (37%), 1996 (+23%), 1997 (+33%), 1998 (+28%) and 1999 (+21%)
- Post-Financial/Greek Debt Crisis (3 years): 2012 (+16%), 2013 (+32%) and 2014 (14%)
That’s the whole list, across almost an entire century of US equity returns. The famous bull market of the 1980s did not see 3 consecutive +10 percent years. Nor did the 1970s, when the S&P 500 rose by 78 percent over that inflationary decade. Even the post-1932 snapback from the Great Depression bottom for US stocks failed to string together 3 years in a row of +10 percent returns in the 1930s.”
Could the S&P post another year of 10% gains in 2021? As noted above, this is the “consensus” view currently. Therefore, many things will need to go “right,” considering the extraordinarily high level of valuations already priced into the market.
However, the risk to investors, who are already long and leveraged, is what happens if something goes wrong? What if the vaccine rollout doesn’t happen as fast as many expect? Or, economic growth doesn’t come roaring back? What if corporate earnings don’t rebound as strongly as expected?
There are many “What if’s.”
For investors, in a grossly overbought, leveraged, extended, and bullish market, it only takes one “what if” to turn everything into “W.T.F.”

Portfolio Positioning Update
With the “Santa Claus” rally wrapping up next week, we are maintaining our long bias with reduced hedges at the moment.
We made no changes to our portfolio mix during the past week except for adding a 5% weight of SPY to our current holdings. Once we pass the end of the next week, we will most likely reduce that position and rebalance the rest of our holdings.
With the stimulus bill passed, and checks going out, we won’t be surprised to see a short-term pop in economic activity. However, given the checks are 50% smaller than the first round, along with extended unemployment benefits, the economic bump will be short-lived. The real question going into 2021 is whether President Biden can spend further into debt to do more stimulus. Or, will a shift toward fiscal responsibility begin to take hold? Much will depend on the Senate run-off outcome in Georgia.
Regardless, the evidence is mounting that economic and earnings data will likely disappoint overly optimistic projections currently. Furthermore, investors are way too confident. Historically, such has always turned out to be a poor mix for a continued bull market advance in the short-term.
We will continue to trade accordingly, but the extreme deviations in all markets from long-term fundamentals are unsustainable.
That is a problem the even the Fed can’t fix.
I wish you all a happy and prosperous New Year.

The MacroView
If you need help or have questions, we are always glad to help. Just email me.
See You Next Week
By Lance Roberts, CIO
Market & Sector Analysis
Analysis & Stock Screens Exclusively For RIAPro Members
S&P 500 Tear Sheet
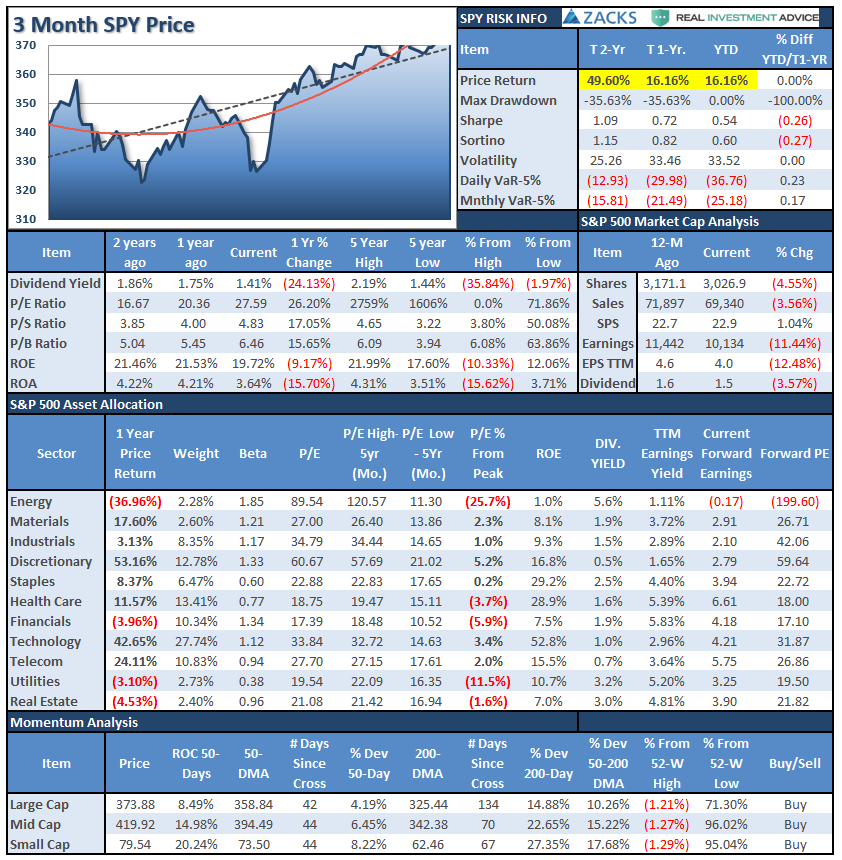
Performance Analysis

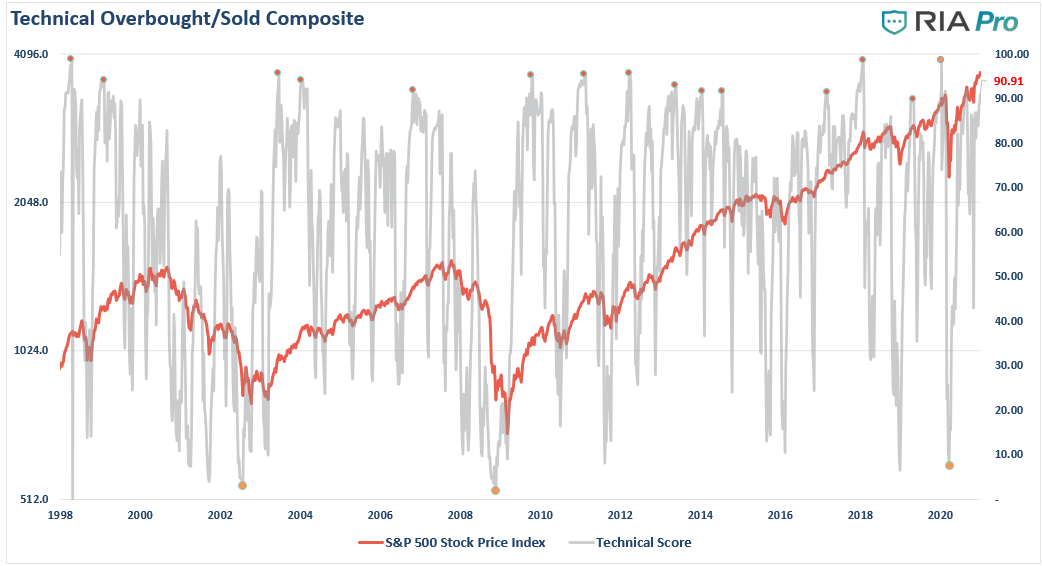
Technical Composite
The technical overbought/sold gauge comprises several price indicators (RSI, Williams %R, etc.), measured using “weekly” closing price data. Readings above “80” are considered overbought, and below “20” is oversold.
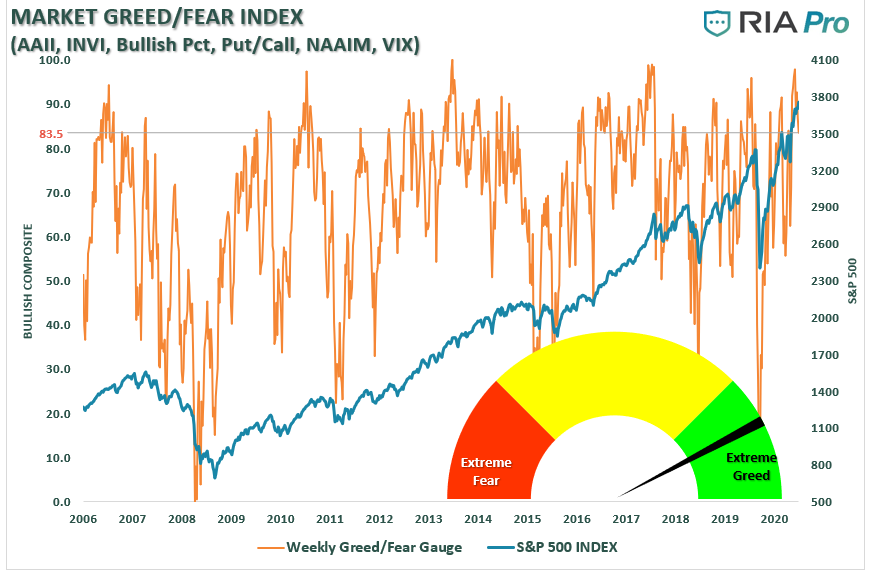
Portfolio Positioning “Fear / Greed” Gauge
The “Fear/Greed” gauge is how individual and professional investors are “positioning” themselves in the market based on their equity exposure. From a contrarian position, the higher the allocation to equities, to more likely the market is closer to a correction than not. The gauge uses weekly closing data.
NOTE: This week, I published the 4-Week Average of the Fear/Greed Index. It is a rarity that it reaches levels above 90. The current reading is 96.07 out of a possible 100.
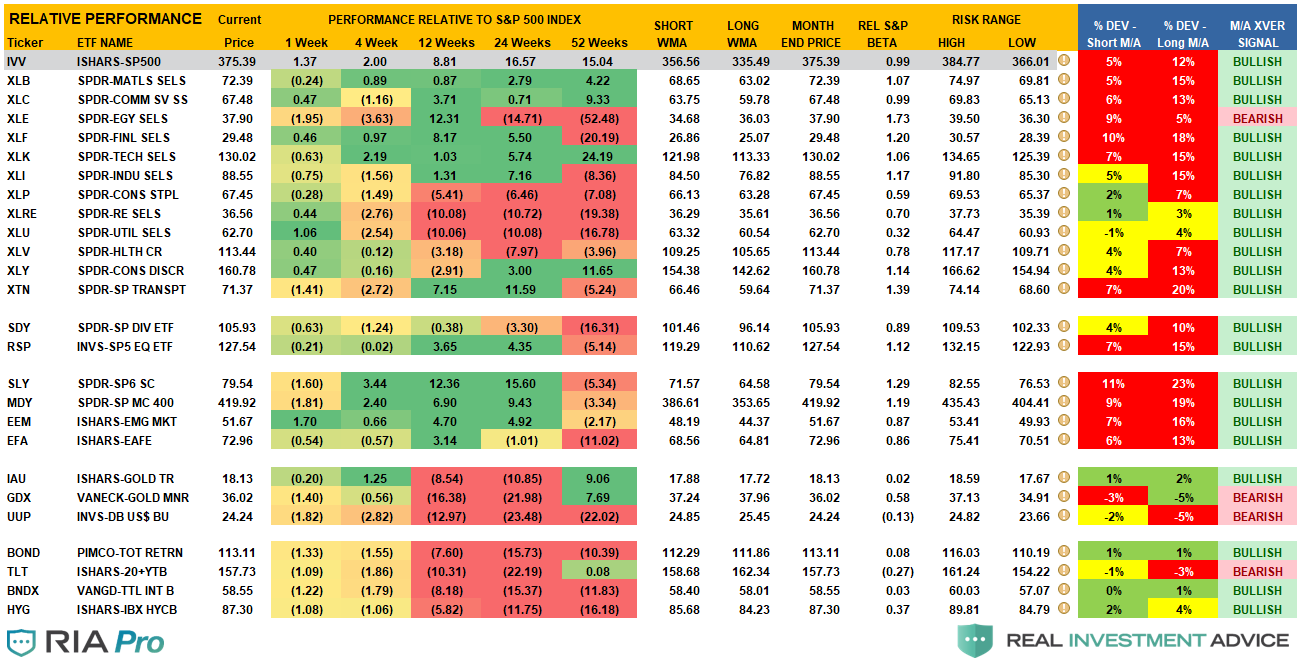
Sector Model Analysis & Risk Ranges
How To Read.
- The table compares each sector and market to the S&P 500 index on relative performance.
- The “MA XVER” is determined by whether the short-term weekly moving average crosses positively or negatively with the long-term weekly moving average.
- The risk range is a function of the month-end closing price and the “beta” of the sector or market.
- The table shows the price deviation above and below the weekly moving averages.
Weekly Stock Screens
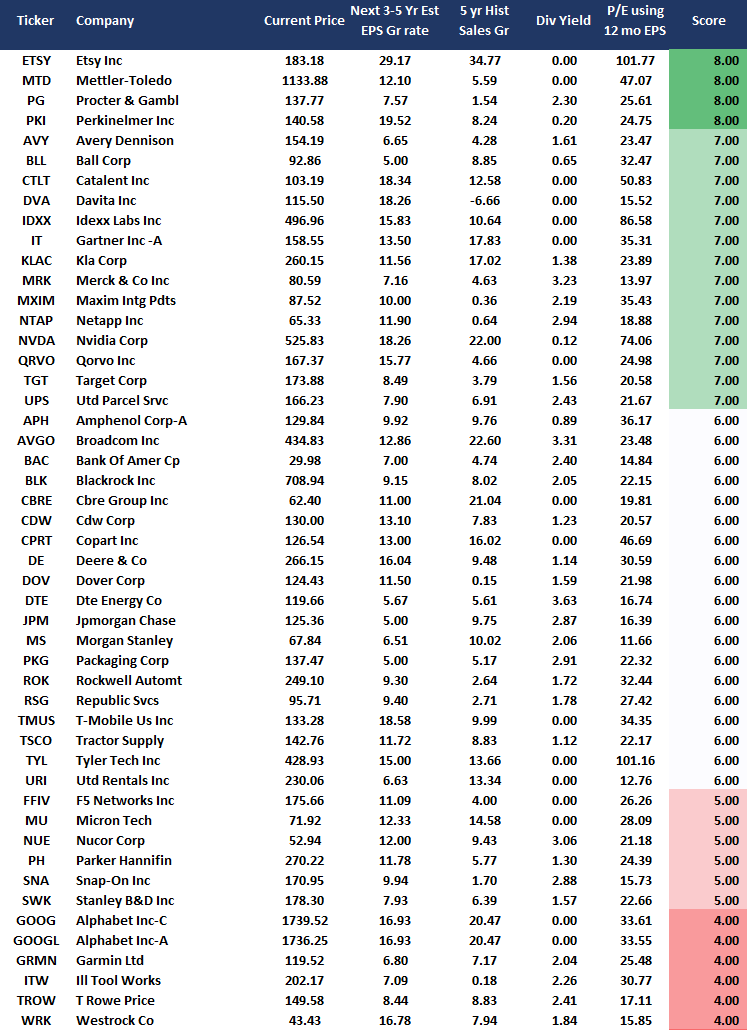
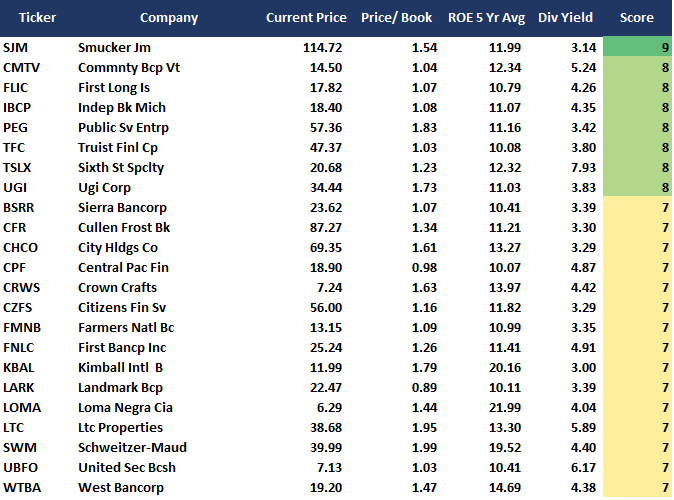
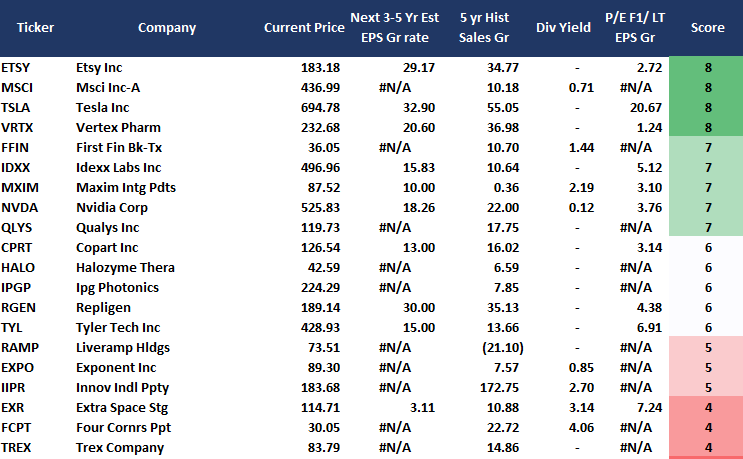
Currently, there are 3-different stock screens for you to review. The first is S&P 500 based companies with a “Growth” focus, the second is a “Value” screen on the entire universe of stocks, and the last are stocks that are “Technically” strong and breaking above their respective 50-dma.
We have provided the yield of each security and a Piotroski Score ranking to help you find fundamentally strong companies on each screen. (For more on the Piotroski Score – read this report.)
S&P 500 Growth Screen
Low P/B, High-Value Score, High Dividend Screen
Aggressive Growth Strategy
Portfolio / Client Update
That’s a wrap. It’s done. Stick a fork in it.
Whatever is your favorite saying, the year 2020 is finally over. The best part about 2020 is it won’t take much for 2021 to be a better year.
As we wrap up the year, we have positioned portfolios to take advantage of any bull market continuation. However, we know the potential risks of excess valuations, speculative risk-taking, and a leveraged market.
Therefore, we expect to continue managing risk in 2021 to maintain portfolio performance while reducing volatility and maintaining capital preservation. We have also done extensive work over the last several months modifying our models to absorb the new dynamic of direct stimulus to households. While such may seem to be beneficial in the short-term, the long-run effect of pulling forward consumption has always been negative.
However, between now and then, we will continue to position portfolios to participate in the market. Our focus remains to create returns consistent with your required “hurdle rate” to meet your long-term financial objectives.
Importantly, we look forward to continuing to serve you in the year ahead. We encourage you to reach out with any questions or concerns you have.
Portfolio Changes
During the past week, we made minor changes to portfolios. We post all trades in real-time at RIAPRO.NET.
In anticipation of the seasonally strong period from Christmas to the first two days of January, we added some additional exposure to portfolios.
Increased our S&P Index trade for the year-end “window dressing” run in both models.
- Add 5% SPY bringing total position to 10%.
As always, we are aware of the risks and are carrying tight stops on this position.
Our short-term concern remains the protection of your portfolio. We have now shifted our focus to 2021 and where markets go in the New Year.
Lance Roberts
CIO
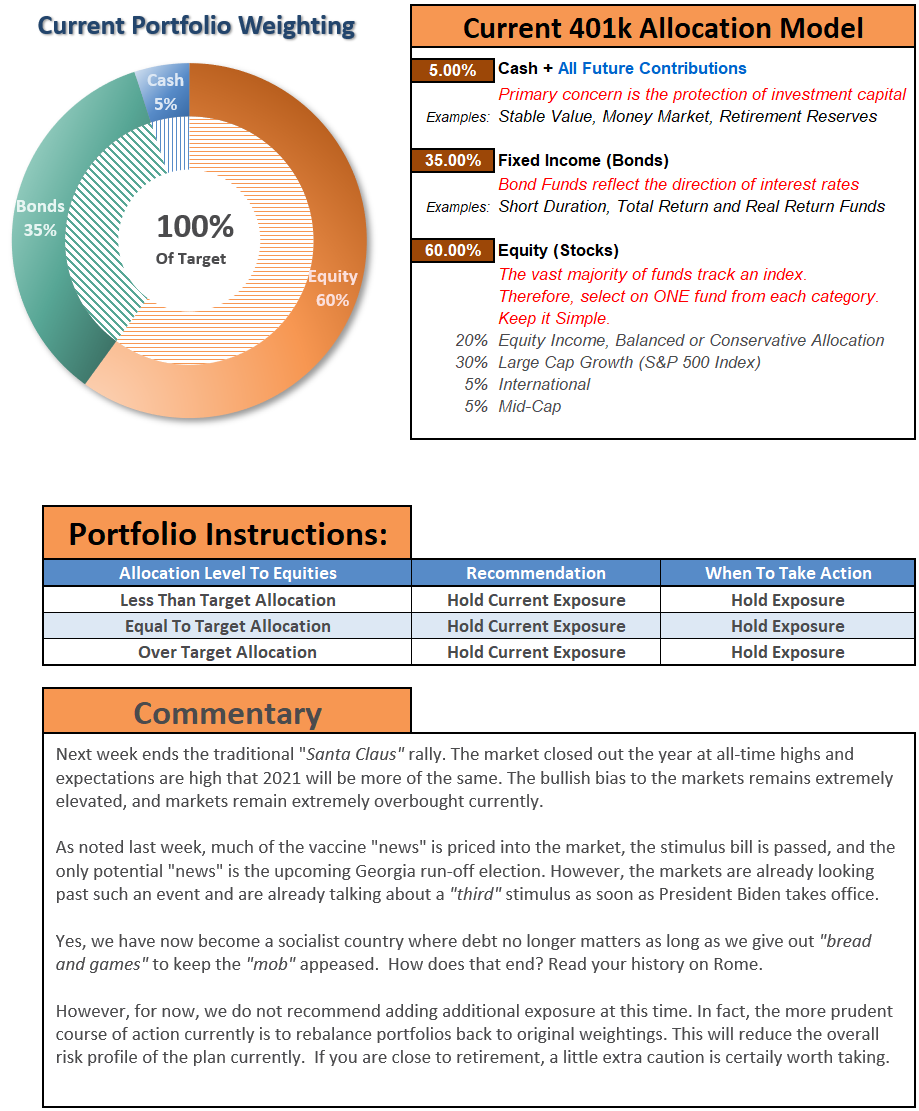
THE REAL 401k PLAN MANAGER
A Conservative Strategy For Long-Term Investors
Model performance is a two-asset model of stocks and bonds relative to the weighting changes made each week in the newsletter. Such is strictly for informational and educational purposes only, and one should not rely on it for any reason. Past performance is not a guarantee of future results. Use at your own risk and peril.

401k Plan Manager Live Model
As anRIA PRO subscriber (You get your first 30-days free), you can access our live 401k plan manager.
Compare your current 401k allocation to our recommendation for your company-specific plan and our 401k model allocation.
You can also track performance, estimate future values based on your savings and expected returns, and dig down into your sector and market allocations.
If you would like to offer our service to your employees at a deeply discounted corporate rate, please contact me.


