
Inside This Week’s Bull Bear Report
- The Correction Continues
- As Rates Rise, Why I Am Buying Bonds
- How We Are Trading It
- Research Report – A Recession Is Coming, Or Is It?
- Youtube – Before The Bell
- Market Statistics
- Stock Screens
- Portfolio Trades This Week
Market Review & Update
This week we will discuss why I doubled my bond position in my personal account. That may seem odd, given that rates have continued to tick up this past week. Much of the recent increase was related to a knee-jerk reaction to the July FOMC minutes, which failed to show signs of an aggressive timeline to cut rates. Notably, the rate uptick only improved the fundamental backdrop of bonds versus stocks.
However, a review of the recent market correction is needed before this week’s main topic.
During July, we repeatedly suggested a correction was needed to work off the short-term overbought condition of the broad market. To wit:
“We must remember that market advances can only go so far before an eventual correction occurs. My best guess is that if the markets are to reach all-time highs this year, we will likely have a correction to reset some of the more extreme overbought conditions, as shown below. Any pullback to the 50-DMA is likely a good entry point to increase exposure on a better risk/reward basis.” – Trading An Unstoppable Bull Market
The correction began the following week. Since then, the market took out initial support at the 50-DMA, our initial target, and is approaching the 100-DMA. In Friday morning’s pre-market commentary, I noted:
“While the market is oversold enough to bounce, the break of the 50-DMA has been decisive enough to suggest that the 100-DMA is the next logical support level. The MACD, as noted previously, is firmly entrenched in its ‘sell signal’ but is reaching levels that normally mark bottoms during bullish corrections. While I would expect a rally as soon as today, that rally will likely remain contained below the 50-DMA for now.“
As shown, while the market did end flat on Friday, it rallied pretty strongly from the opening lows. A further “relief rally” next week will be unsurprising, with the market still very oversold. Any failed test of the 50-DMA will be a reasonable point to reduce equity risk and rebalance portfolio allocations as needed.
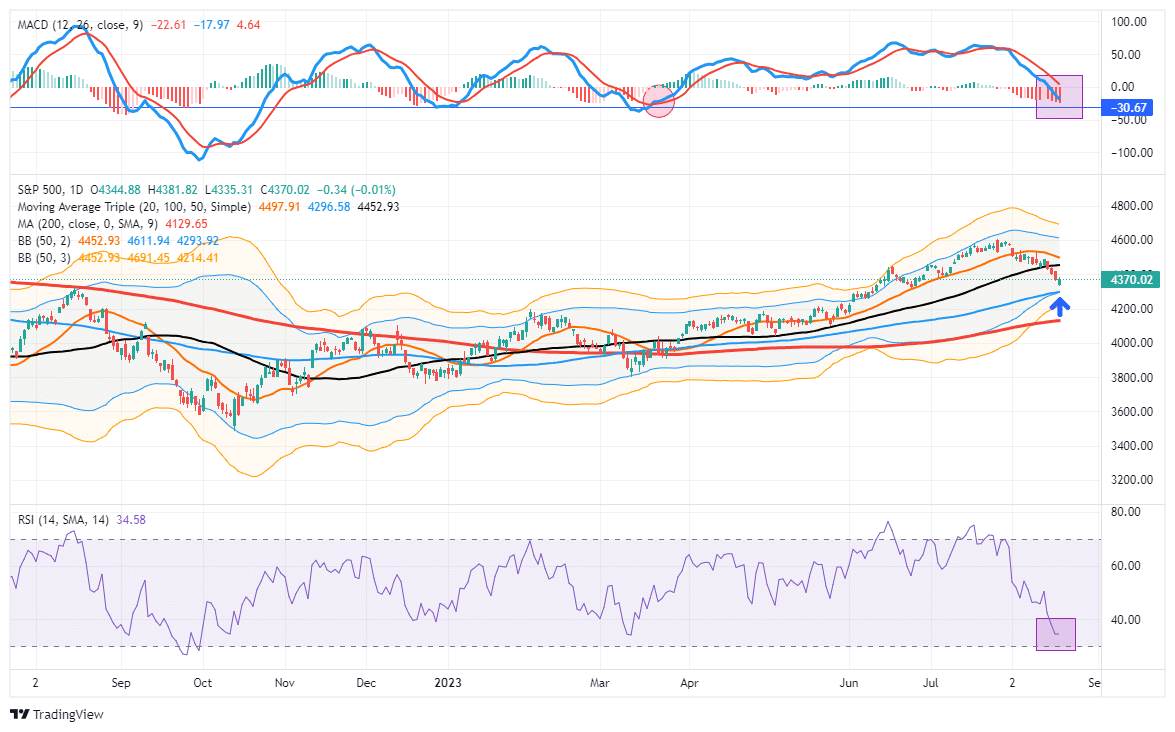
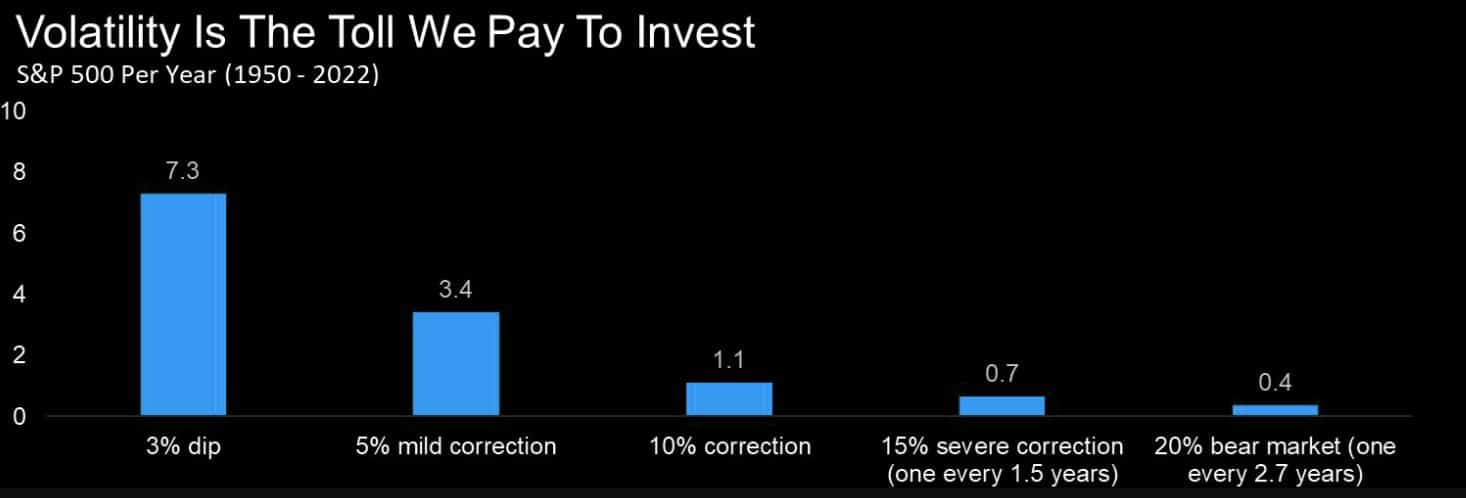
The overall market momentum and sentiment remain bullish, and the correction, so far, remains orderly and normal. As discussed, a 3-10% correction is normal in any given year.
As long as nothing “breaks,” when this corrective cycle completes, we expect a rally into year-end. Such will be a function of performance chasing as portfolio managers play catch up into year-end.
We will continue to monitor things closely, but with stocks sporting high valuations, there are several reasons why I am excited about bonds.
Need Help With Your Investing Strategy?
Are you looking for complete financial, insurance, and estate planning? Need a risk-managed portfolio management strategy to grow and protect your savings? Whatever your needs are, we are here to help.

As Rates Rise, Why I Am Buying Bonds
In last week’s newsletter, I made the following statement.
“As the analysis shows, bonds are currently very undervalued relative to stocks. As such, the performance pickup over the next 18-24 months will likely be rather significant. Such is particularly the case if the U.S. does slip into a recession or even if economic growth slows below 2%. Both outcomes remain likely possibilities, given the deep inversion of yield curves.
This analysis is also why I doubled my Treasury Bond ETF (TLT) position in my personal investment account this past week. Given that global Central Banks, and Government politicians, can not afford high inflation or a defaulting economic cycle, the pressure to suppress rates will continue to increase. The math provides a clear roadmap for the future.”
Unsurprisingly, that comment sparked many emails questioning my position on bonds. After all, my thesis directly contradicts recent statements by Ray Dalio, Bill Ackman, Bill Gross, and others. Therefore, I thought I would use this week’s message to explain further my decision and, most importantly, my timeframe.
However, for this discussion, it is crucially important to understand the mechanics behind bonds.
Unlike stocks, bonds have a finite value. At maturity, the lender receives its principal and final interest payment. Therefore, bond buyers know the price they pay today for the return they will get tomorrow. Unlike an equity buyer taking on “investment risk,” a bond buyer is “loaning” money to another entity for a specific period. Therefore, the “interest rate” takes into account several substantial “risks:”
- Default risk
- Rate risk
- Inflation risk
- Opportunity risk
- Economic growth risk
Since the future return of any bond, on the date of purchase, is calculable to 1/100th of a cent, a bond buyer will not pay a price that yields a negative return in the future. (This assumes a holding period until maturity. One might purchase a negative yield on a trading basis if expectations are benchmark rates will decline further.)
Therefore, since bonds are loans to borrowers, a bond’s interest rate is tied to the prevailing rate environment at the time of issuance. In other words, the interest rate reflects expectations for economic growth and inflation.
It’s The Economy Stupid
Since rates and expectations must adjust for the potential future impact on the current value of invested capital:
- Equity investors expect that as economic growth and inflationary pressures increase, the value of invested capital will increase to compensate for higher costs.
- Bond investors have a fixed rate of return. Therefore, the fixed return rate is tied to forward expectations. Otherwise, capital is damaged due to inflation and lost opportunity costs.
Therefore, the long-term correlation between rates, inflation, and economic growth is unsurprising.
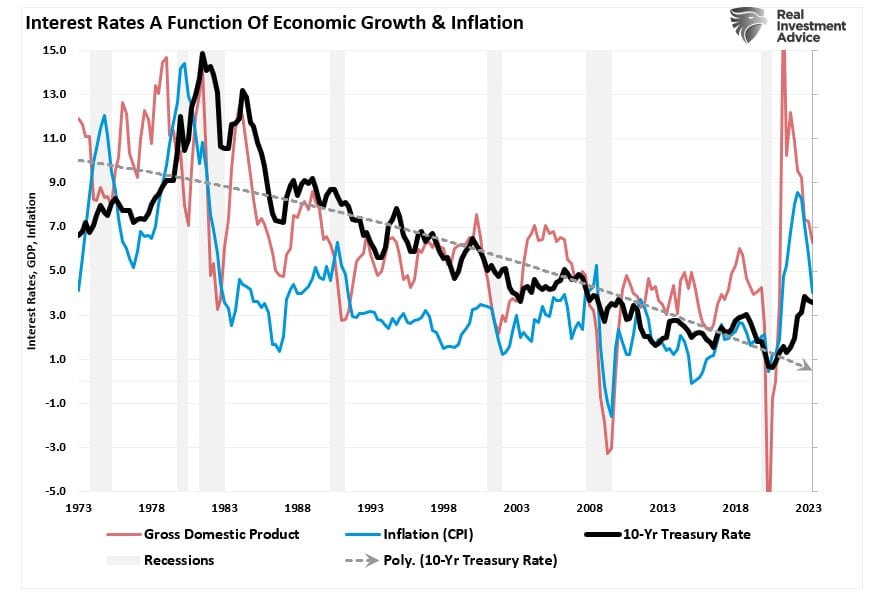
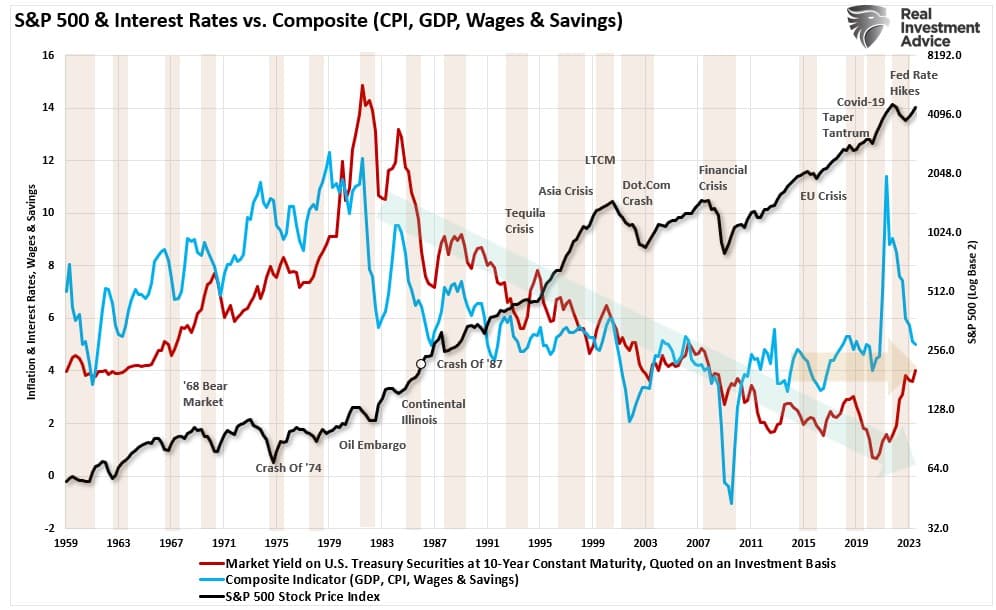
That is pretty cluttered, so the following chart is a composite index of inflation and economic growth compared to the 10-year Treasury yield.
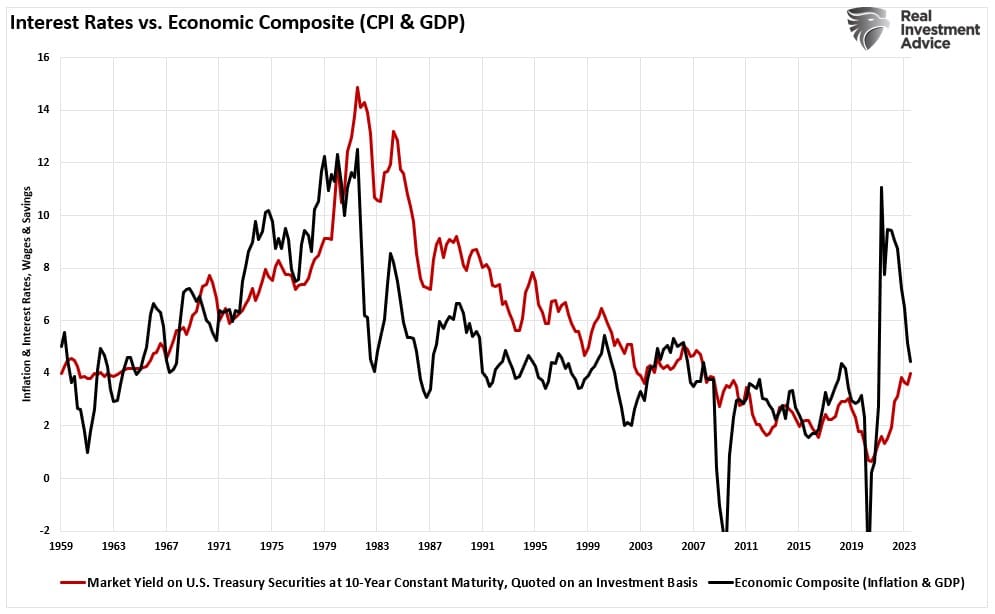
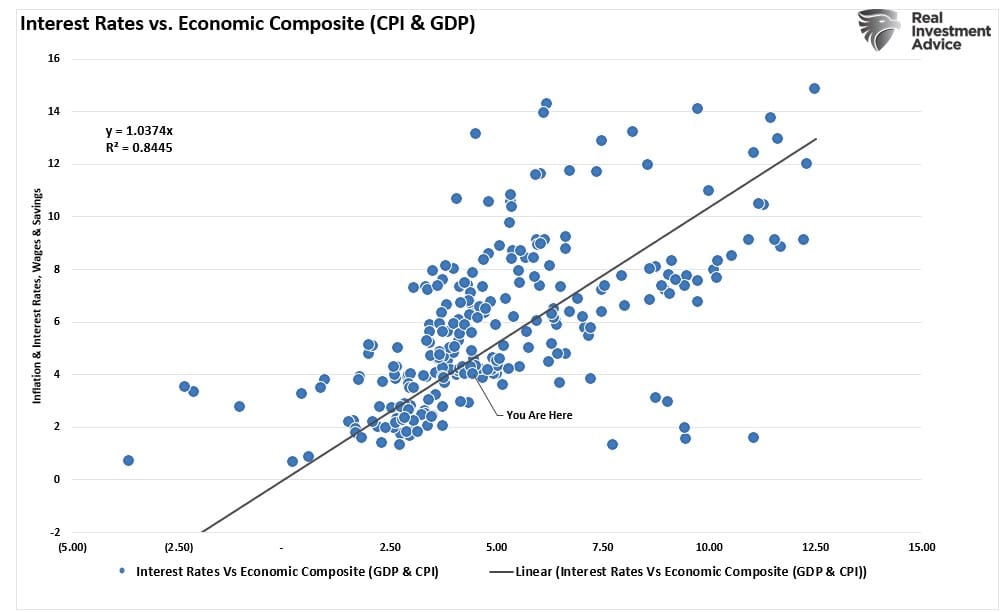
As expected, the surge in economic growth and inflation pulled longer-duration yields higher. With a correlation of nearly 85% between interest rates and a GDP/Inflation composite index, investors should expect rates to fall as economic growth and inflation decline.
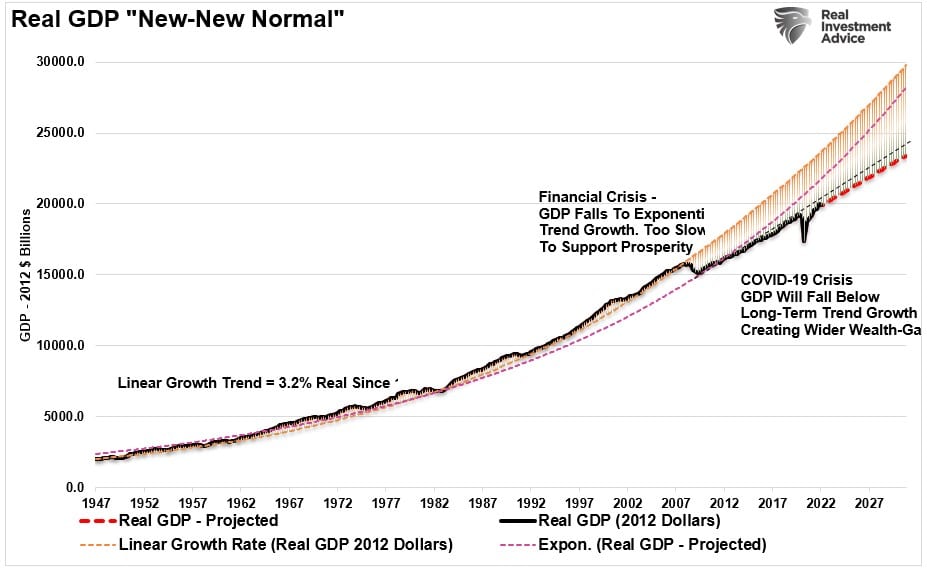
As debt increases and monetary policies divert capital from productive uses, the expected growth trend will return to levels at or below 2% annualized.
Such is particularly the case as Central Banks globally have to monetize Government debt to suppress interest rates from causing a global depression. The Congressional Budget Office recently updated its debt trajectory over the next 30 years. The chart below models that analysis using the growth trend of debt but also factors in the need for the Federal Reserve to monetize nearly 30% of that issuance.
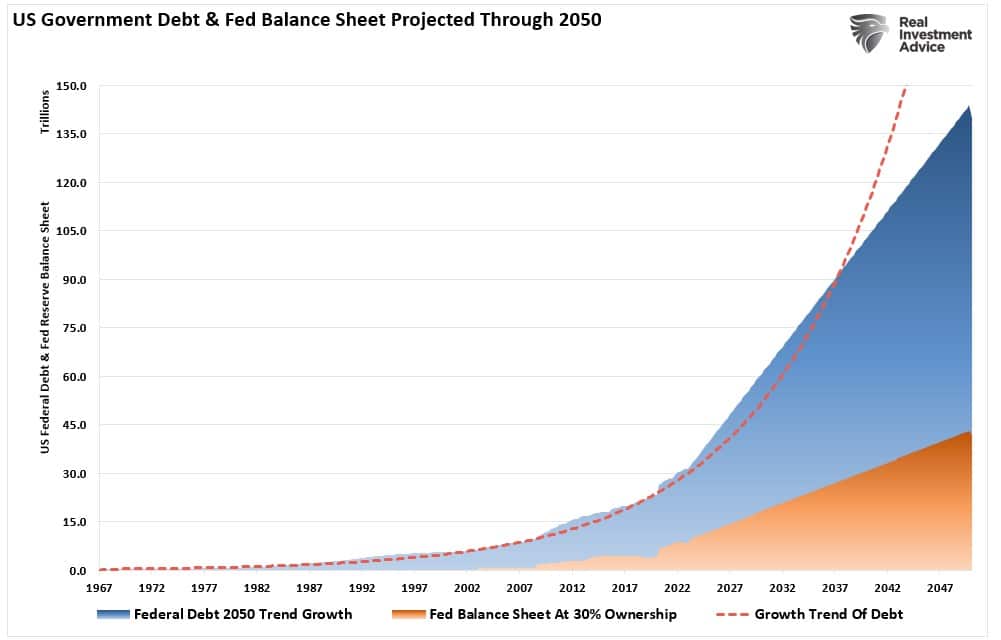
At the current growth rate, the Federal debt load will climb from $32 trillion to roughly $140 trillion by 2050. Concurrently, assuming the Fed continues monetizing 30% of debt issuance, its balance sheet will swell to more than $40 trillion.
The Fed will remain the “buyer of last resort” for bonds.
Why I Can’t Do This For Clients
In “Bonds Versus Stocks,” I noted:
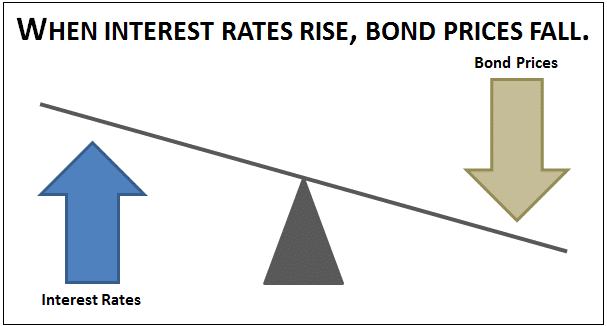
“There is an inverse relationship between bond prices and interest rates. When interest rates are low and rising, bond prices fall. However, when they are high and falling, bond prices rise. In the portfolio management process, there are three reasons to buy bonds:
- Capital appreciation – the same reason we buy equities
- Total return – interest income plus capital appreciation
- Risk reduction – lower volatility assets to offset higher volatility assets (equities.)
If you consider government bonds as an “asset class,” the analysis changes from an income strategy to a capital appreciation opportunity.”
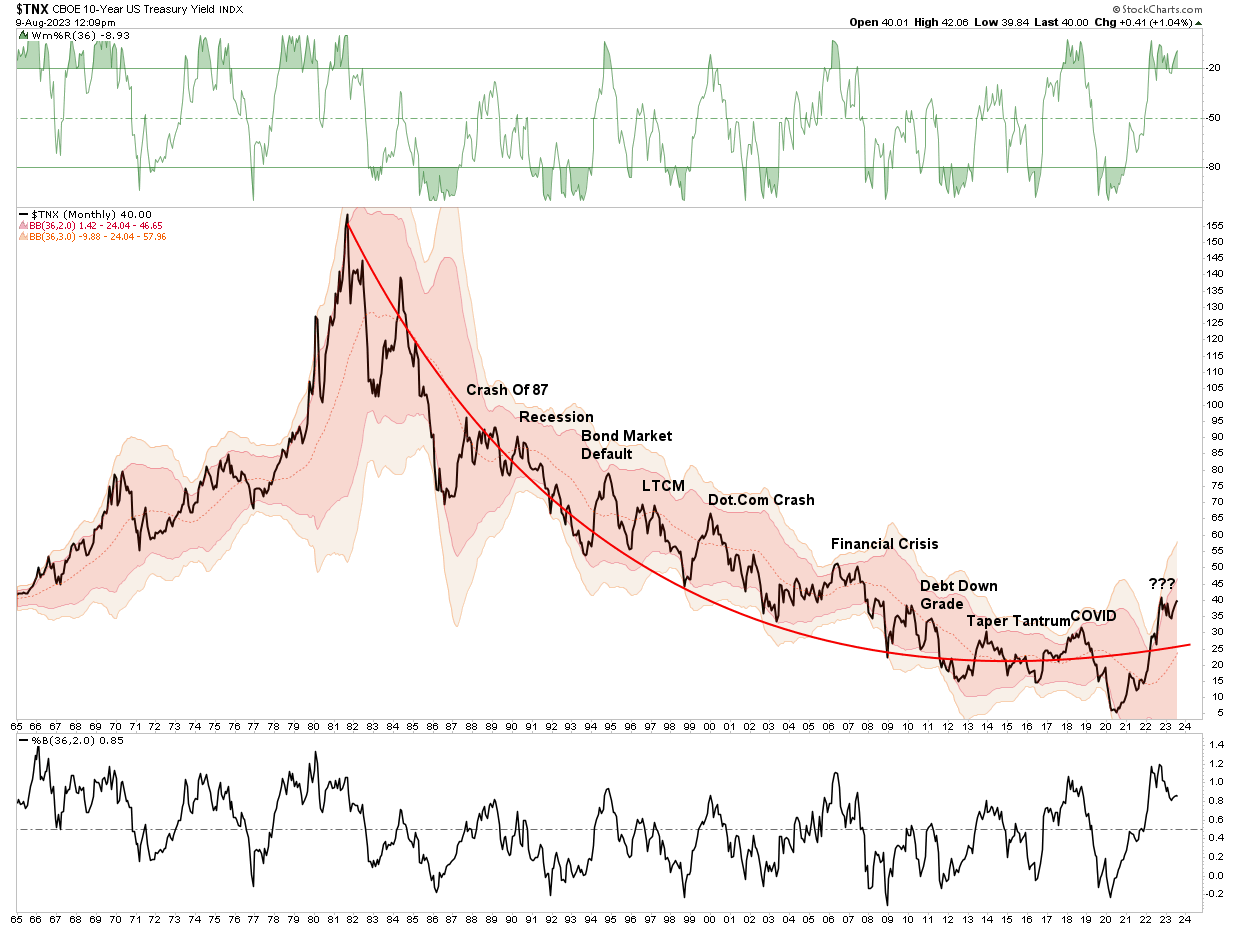
“The hope is that the Fed will again start dropping interest rates. However, as we have noted previously, the only reason for the Fed to cut rates would be to offset the risk of an economic recession or a financially related event. Should such occur, the “risk off” rotation would cause a drop in rates toward the pandemic-era lows. Such a decline would imply an increase in bond prices of approximately 50%.”
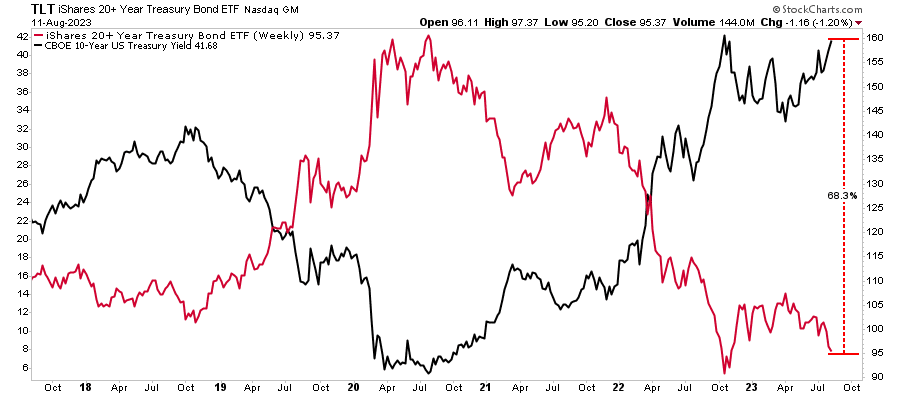
All of this analysis is why I doubled my personal position in the iShares 20-Year Treasury Bond ETF (TLT) recently.
However, that conversation sparked a lot of questions about why, if I have this much conviction in this particular investment, the same positioning was not done in client accounts. There are three primary reasons why such is the case.
- My personal time horizon for this trade is 18-36 months. As such, I am willing to suffer underperformance for quite some time for the expected outcome. Given that most clients measure their performance from January 1st to December 31st, such long-term investment horizons are not feasible.
- Client performance chasing also makes long-term investment themes unusable in client portfolios. For example, In December 2022, clients wanted only short-term bonds. Now they want to sell the bonds to buy stocks. Performance chasing is fine, but such eliminates the possibility of building investment positions with higher returns over time.
- Our fiduciary responsibility also prohibits creating concentrated positions in portfolios due to the potential risk that something could go wrong. Personally, I have an exceedingly high level of confidence in my positioning over the next three years. However, I also understand the risk that something could go wrong. When managing many client portfolios with various risk tolerances and time frames, we must focus on risk management and controls.
Over the last couple of weeks, I have discussed bonds and why the many concerns of higher, sustained interest rates are not likely. I hope this week’s newsletter better clarifies why I am willing to place a longer-term bet on that outcome.
Also, if you didn’t make the connection, a reversion in interest rates is not great for currently overvalued stocks.
How We Are Trading It
The market correction continued this past week. Such was unsurprising given the previous runup into August. Nonetheless, there is still a short-term risk, so we suggest rebalancing portfolios as needed until the next buy signal is registered.
We have been using this correction opportunistically to increase equity exposure overall and rebalance portfolio sectors closer to index weightings. We expect that the bull market will continue into year-end but that the overall advance should broaden out to include more than just a handful of Megacap-Weighted stocks.
If you have been following our portfolio changes (which we list at the bottom of this newsletter each week), you will already know that our allocation is moving more toward our benchmark over the last month. We do have some small and mid-capitalization exposure as well as we do expect to see some more robust economic data near term. However, as we move into 2024, the lag effect of the Fed’s rate hikes will likely impact economic growth, and current liquidity will begin to wane.
We remain highly aware of our risk matrix and continue to monitor performance very closely, making changes as needed. However, the bullish trends remain intact for now, so we act accordingly.
Have a great weekend.
Research Report
Subscribe To “Before The Bell” For Daily Trading Updates
We have set up a separate channel JUST for our short daily market updates. Please subscribe to THIS CHANNEL to receive daily notifications before the market opens.
Click Here And Then Click The SUBSCRIBE Button
Subscribe To Our Youtube Channel To Get Notified Of All Our Videos
Bull Bear Report Market Statistics & Screens

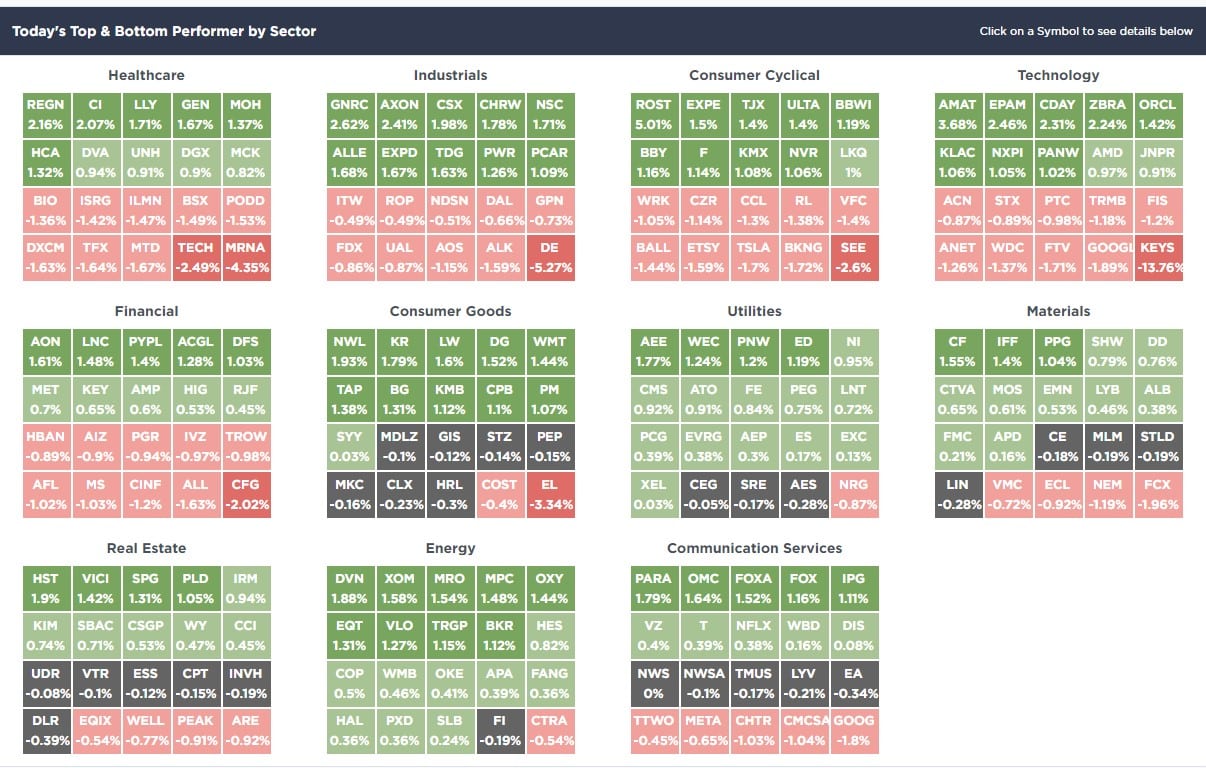
SimpleVisor Top & Bottom Performers By Sector
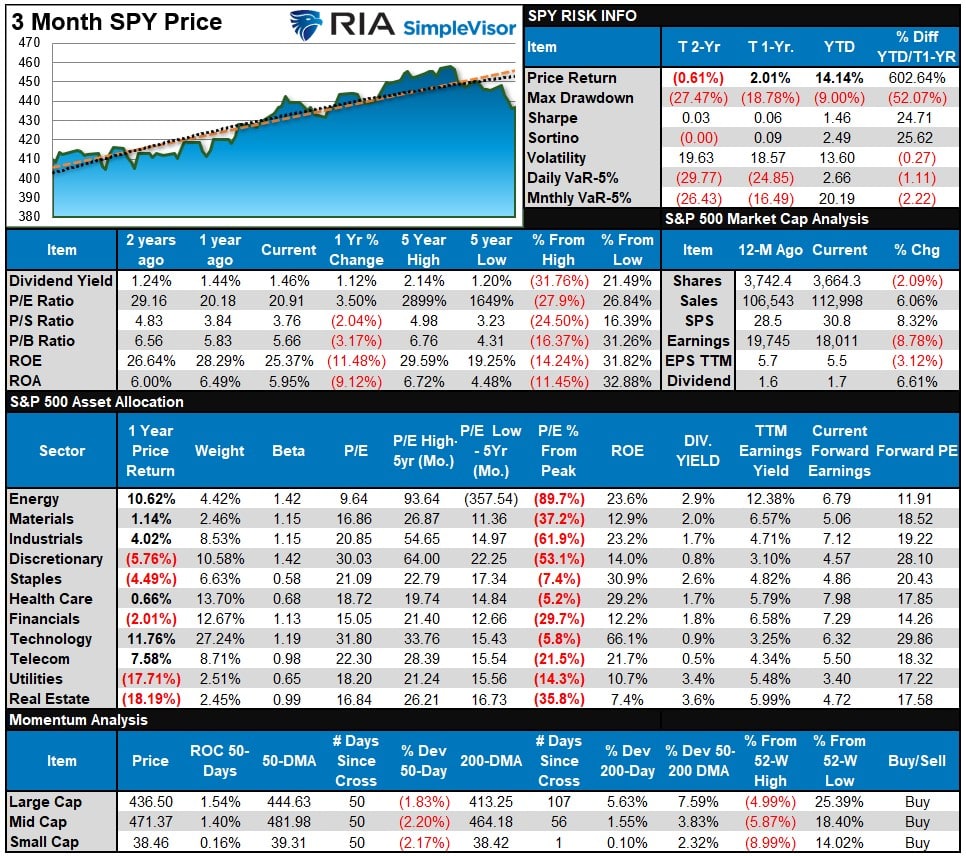
S&P 500 Weekly Tear Sheet
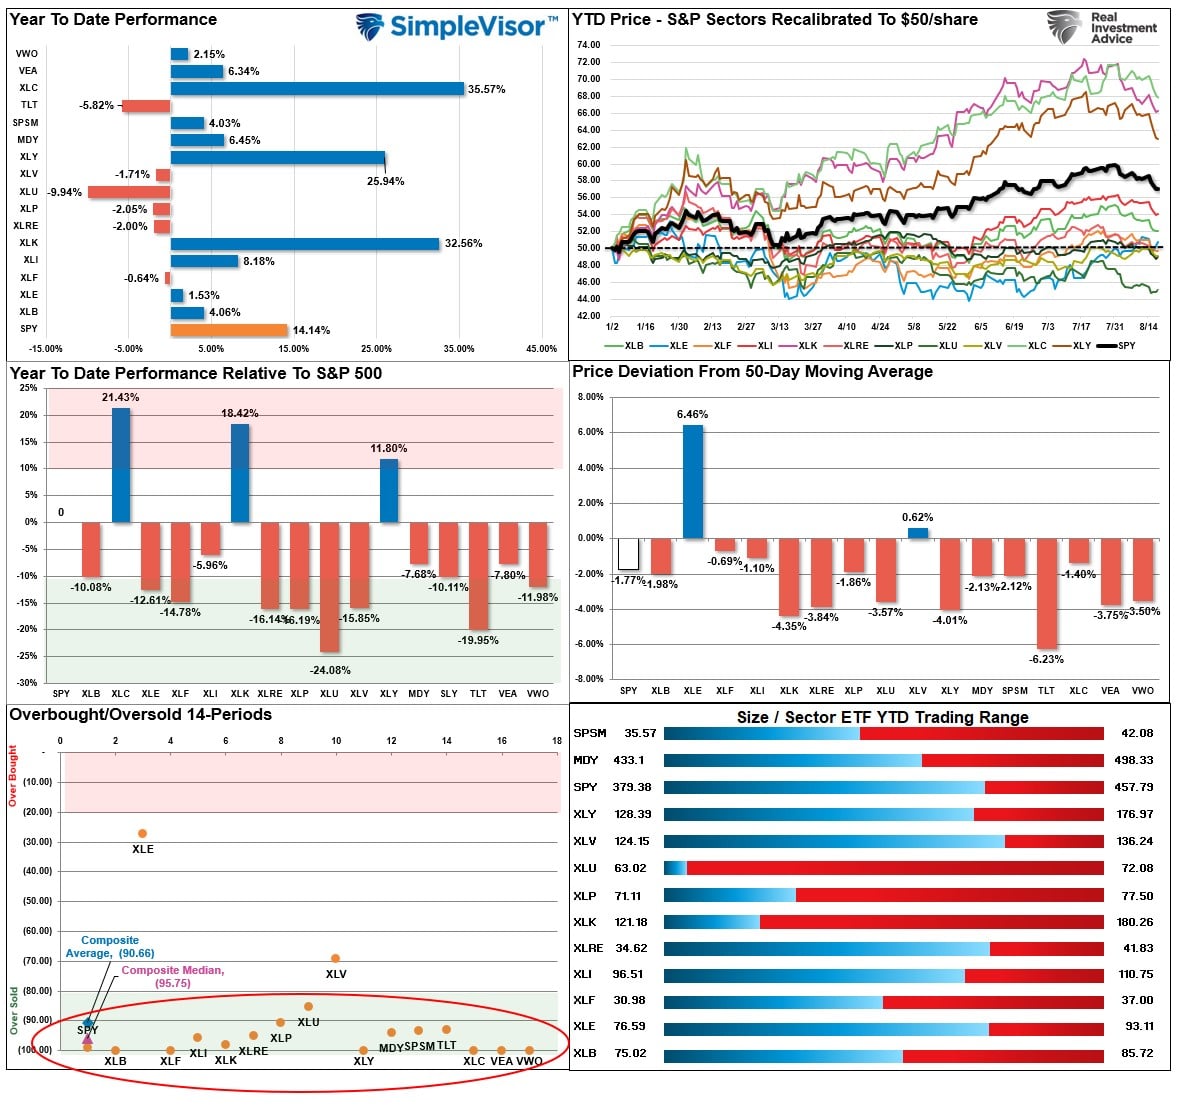
Relative Performance Analysis
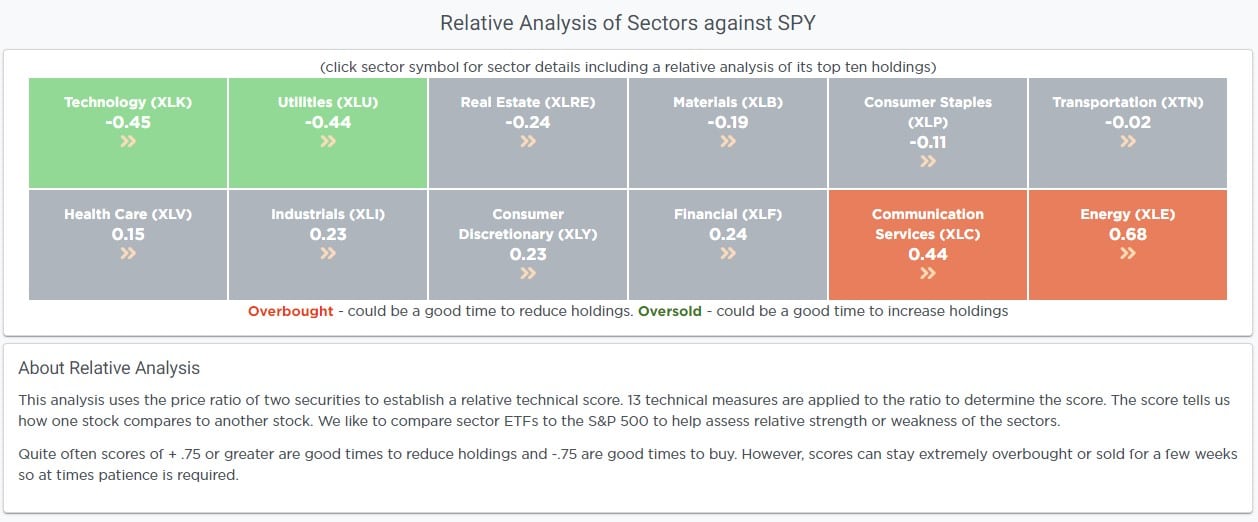
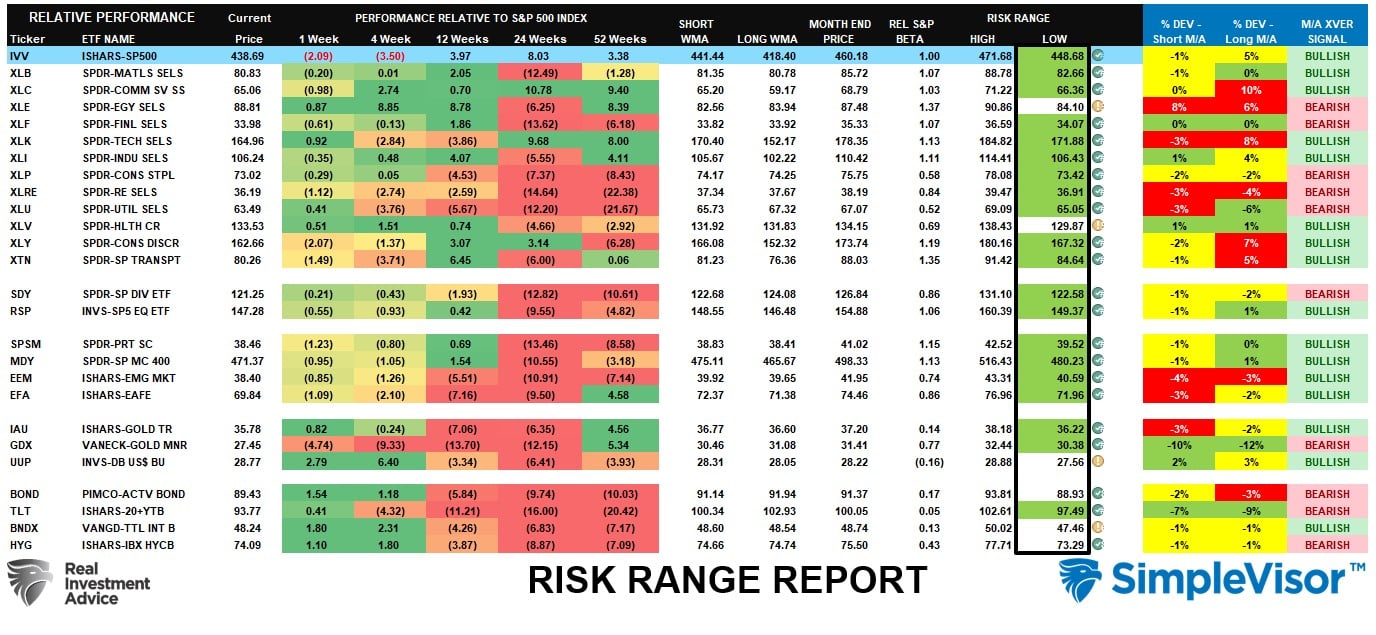
Expect a rally this week, given that most sectors and markets are trading in short-term oversold conditions. As shown in the Risk/Range report below, most sectors and markets have fallen outside of their normal ranges and, combined with short-term oversold conditions. Such will likely contribute to a short-term rally.
While just three sectors drove the majority of the year’s broad market performance, the deep oversold conditions in this year’s most hated sectors are a prime setup for next year’s outperformers. Such was the same as we saw in 2021, when Energy was the most hated. In 2022, it was Technology and Communications. In 2024, it may well pay to be long those sectors most impacted by falling interest rates.
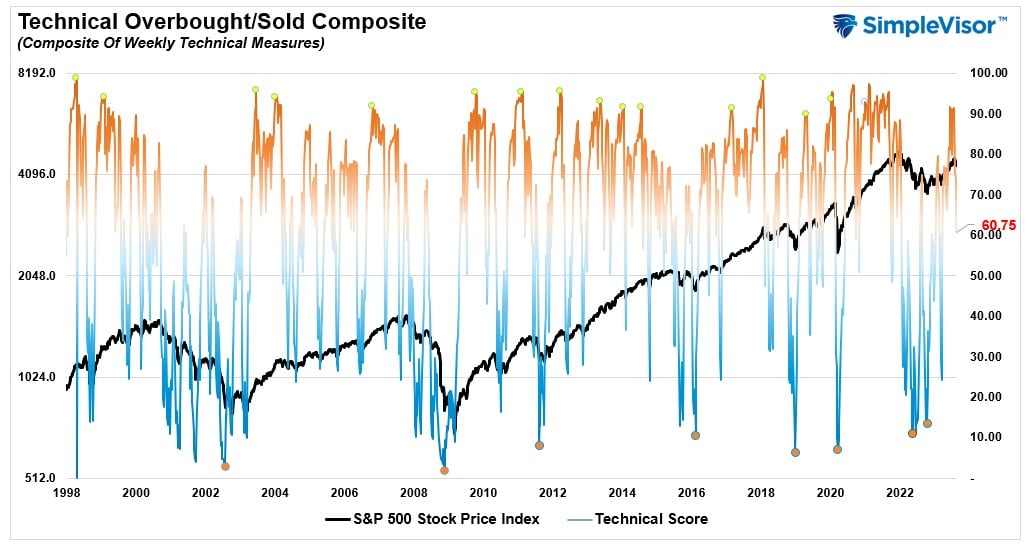
Technical Composite
The technical overbought/sold gauge comprises several price indicators (R.S.I., Williams %R, etc.), measured using “weekly” closing price data. Readings above “80” are considered overbought, and below “20” are oversold. The market peaks when those readings are 80 or above, suggesting prudent profit-taking and risk management. The best buying opportunities exist when those readings are 20 or below.
The current reading is 60.75 out of a possible 100.
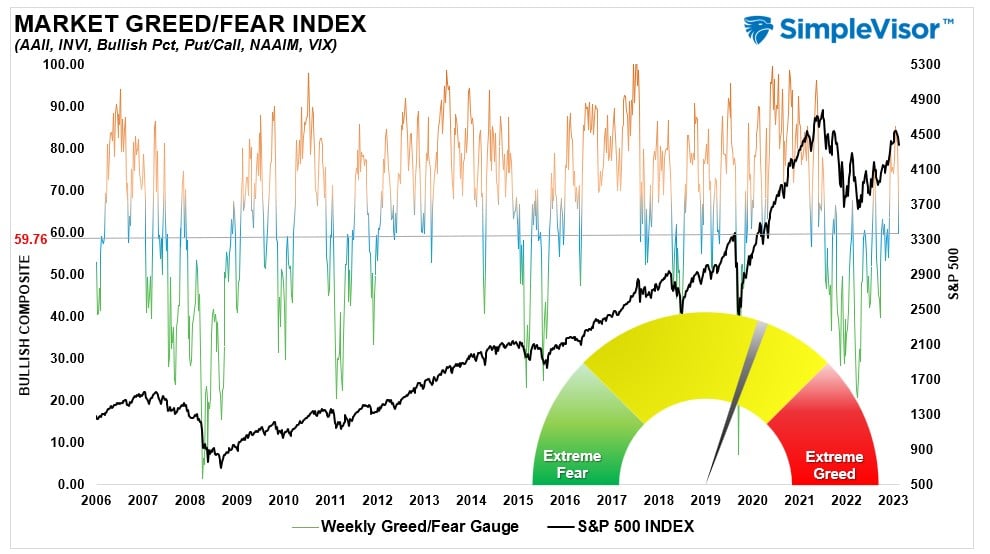
Portfolio Positioning “Fear / Greed” Gauge
The “Fear/Greed” gauge is how individual and professional investors are “positioning” themselves in the market based on their equity exposure. From a contrarian position, the higher the allocation to equities, the more likely the market is closer to a correction than not. The gauge uses weekly closing data.
NOTE: The Fear/Greed Index measures risk from 0 to 100. It is a rarity that it reaches levels above 90. The current reading is 69.71 out of a possible 100.
Relative Sector Analysis
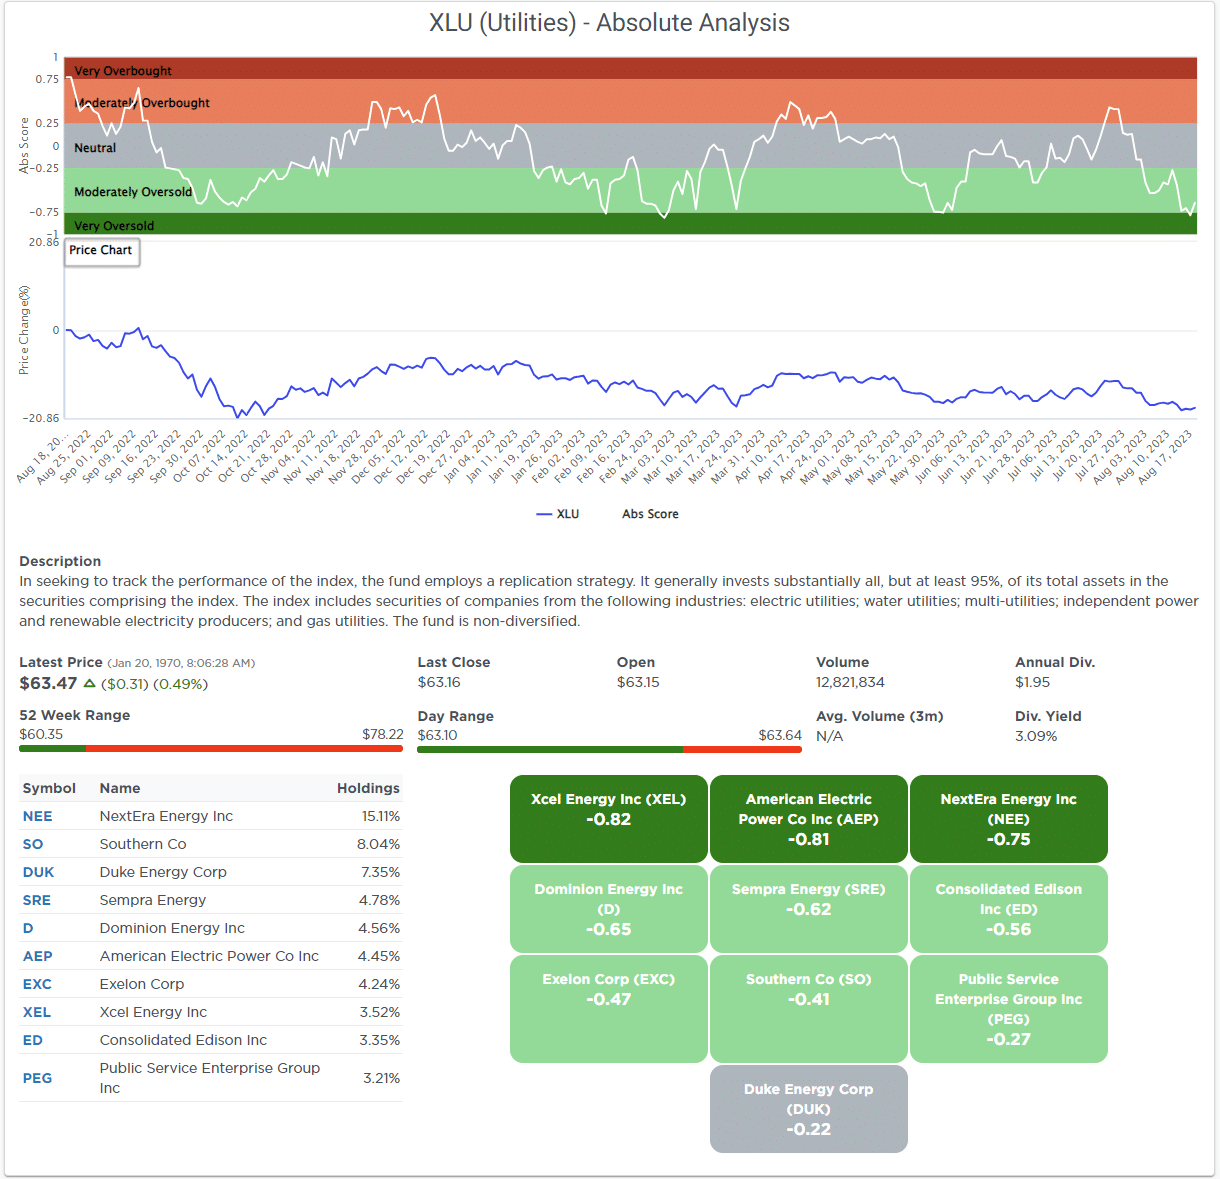
Most Oversold Sector Analysis
Sector Model Analysis & Risk Ranges
How To Read This Table
- The table compares the relative performance of each sector and market to the S&P 500 index.
- “MA XVER” (Moving Average Cross Over) is determined by the short-term weekly moving average crossing positively or negatively with the long-term weekly moving average.
- The risk range is a function of the month-end closing price and the “beta” of the sector or market. (Ranges reset on the 1st of each month)
- The table shows the price deviation above and below the weekly moving averages.
It’s probably time for a short-term rally. Most markets and sectors are now trading well below their normal monthly risk ranges. Combined with the technically oversold condition, as shown by the Relative Performance Analysis above, a short-term rally toward the 50-DMA should be expected. Until the market registers a technical buy signal, short-term rallies should be used to rebalance equity risk accordingly.
Weekly SimpleVisor Stock Screens
We provide three stock screens each week from SimpleVisor.
This week we are searching for the Top 20:
- Relative Strength Stocks
- Momentum Stocks
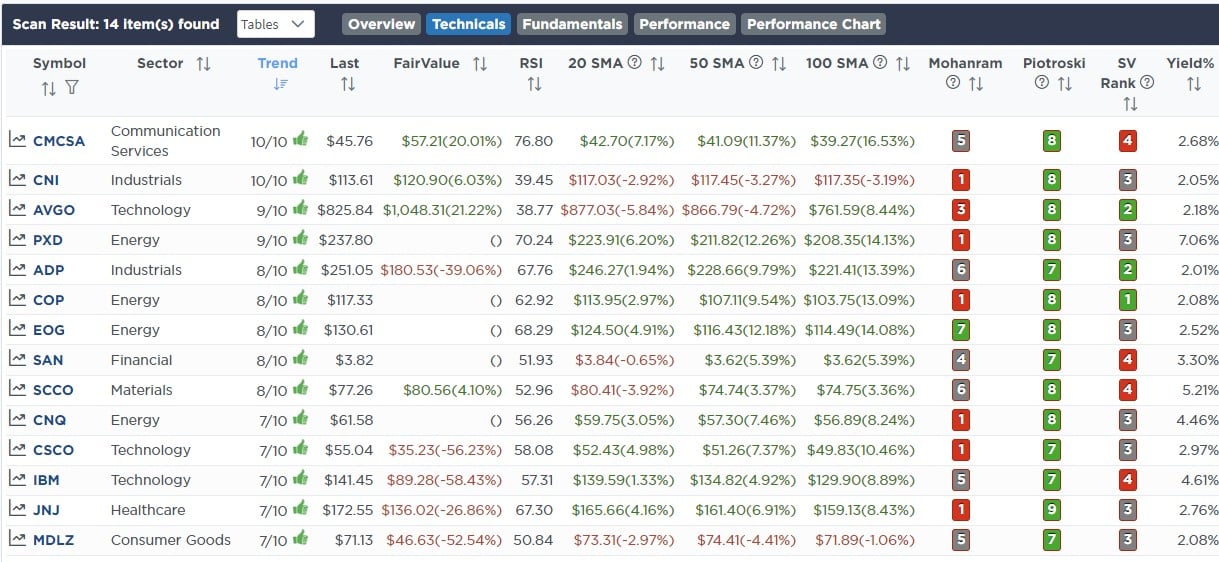
- Fundamental & Technical Strength
(Click Images To Enlarge)
R.S.I. Screen
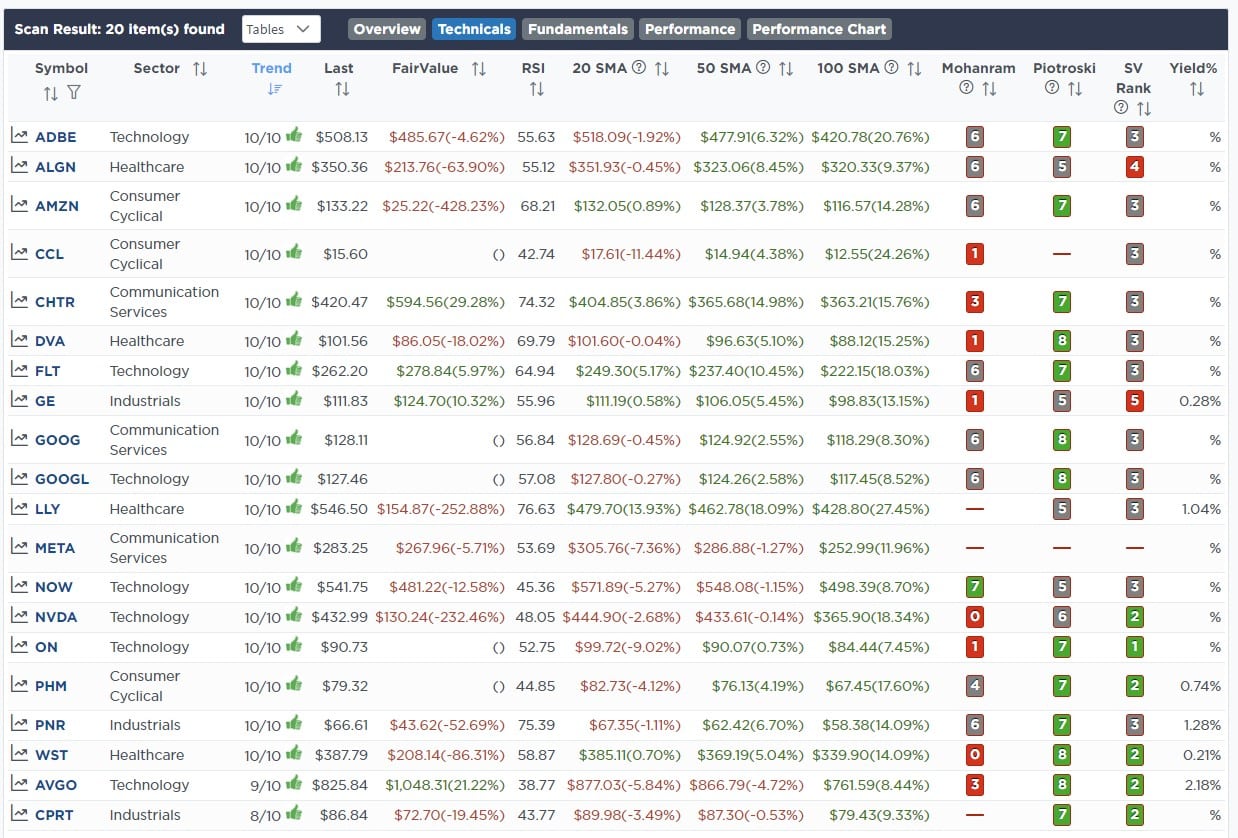
Momentum Screen

Fundamental & Technical Strength
SimpleVisor Portfolio Changes
We post all of our portfolio changes as they occur at SimpleVisor:
August 15th
“As we have repeatedly discussed, we have been waiting for some corrective action to rebalance our equity and ETF models to align them closer to the benchmark indices in terms of weighting. We continue that process today by reducing our overweight Utility exposure and increasing our Discretionary and Financial weightings.
In the Equity Model, we sold Nextera Energy (NEE) and rebalanced Duke Energy (DUK) to sector weight. We are also initiating two new positions in Lennar (LEN) to increase our Discretionary holdings and adding Visa (V) for the financial weightings. In the ETF model, we are swapping iShares Real Estate ETF (XLRE) for the Homebuilders ETF (ITB), reducing the iShares Utilities ETF, and increasing our weighting to the iShares Discretionary ETF (XLY).
We are also using the recent rate uptick to shift our 1-3 Month T-Bill Holdings (BIL) to the 1-3 Year Treasury Bill ETF (SHY).
Equity Model
- Sell 100% of NextEra Energy (NEE)
- Increase Duke Energy to 3% of the portfolio.
- Initiate a new 2% of the portfolio position in Lennar (LEN)
- Buy 2% of the portfolio in Visa (V).
- Swap 100% of the iShares 1-3 Month Treasury Bill ETF (BIL) into the iShares 1-3 Year Treasury Bill ETF (SHY)
ETF Model
- Sell 100% of the iShares Real Estate ETF (XLRE)
- Buy 1.5% of the portfolio in the Homebuilders ETF (ITB)
- Add 2% of the portfolio to the iShares Discretionary ETF (XLY)
- Trim the iShares Utility ETF (XLU) by 0.5% to 4% of the portfolio.
- Swap 100% of the iShares 1-3 Month Treasury Bill ETF (BIL) into the iShares 1-3 Year Treasury Bill ETF (SHY)
August 17th
This morning we swapped our 1.5% in IWM for CSCO in the equity model. In the sector model, we are leaving IWM. This will better align small-cap exposure in both portfolios. CSCO adds to our technology weighting, which we have been trying to increase. It also has somewhat of a value tilt with a P/E<20 and a 2.85% dividend.
- Sell 100% of Russell 2000 Index ETF (IWM)
- Buy 1.5% of the portfolio in Cisco Systems (CSCO)

Lance Roberts, C.I.O.
Have a great week!

