No Pivot On The Horizon As Fed Hikes 75bps


Inside This Week’s Bull Bear Report
- No Pivot On The Horizon
- World’s Worst Economic Forecasters
- How We Are Trading It
- Research Report -Debt & Why The Fed Is Trapped
- Market Review With Adam Taggart
- Stock Of The Week
- Daily Commentary Bits
- Market Statistics
- Stock Screens
- Portfolio Trades This Week
Fed Hikes 75bps, No Pivot & A Hard Landing
It was a tough week for equities as the Fed hiked 75bps and signaled that “no pivot” in policy is coming. Such disappointed the markets in desperate need of some “encouraging news,” but none was to be had. Furthermore, the Fed slashed economic growth drastically, upped their unemployment projections, and kept inflation expectations elevated through 2023.
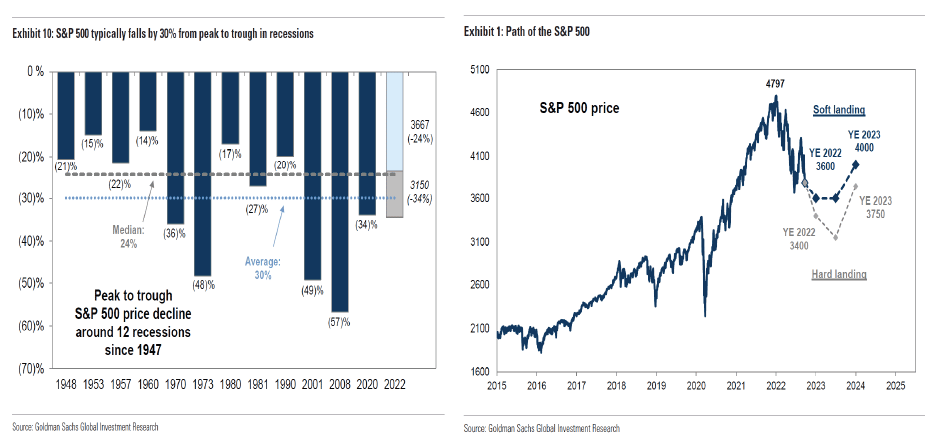
Markets broke through support and tested this year’s lows on Friday as selling was broad-based. As we will discuss momentarily, the market is now figuring out the rising risk of a policy mistake. On Friday, Goldman Sachs slashed their year-end price targets for the S&P 500 index. The “hard landing” scenario was most important.
In a recession, we forecast earnings will fall and the yield gap will widen, pushing the index to a trough of 3150. Our economists assign a 35% probability of recession in the next 12 months and note that any recession would likely be mild given the lack of major financial imbalances in the economy. As we previously outlined, in the event of a moderate recession, our top-down model indicates EPS would fall by 11% to $200.
For context, a 34% peak-to-trough decline in the S&P 500 index during a recession would only be slightly worse than the historical average of 30%. We see two risks that would create a more dramatic sell-off in equities during a recession. First, if inflation concerns were to limit the degree of monetary or fiscal policy support and interest rates did not fall, it could lead to even lower valuations or even larger economic and earnings growth declines than we model. Second, concentrated sector weakness, such as Information Technology in 2001 and Financials in 2008, could lead to an even sharper earnings and price decline.
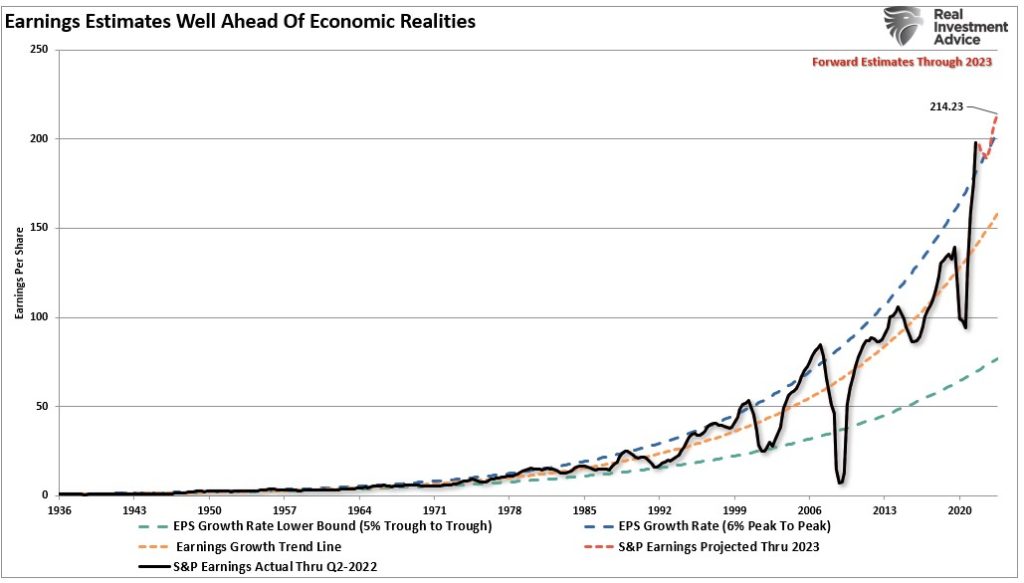
While Goldman is finally coming to grips with economic and fundamental realities, its expectations for only modest earnings and margin decline are still optimistic. As we discussed recently, earnings will likely revert to below $200/share just to reach the median long-term growth trend.
“More importantly, despite the recent downward revisions, the current estimates still exceed the historical 6% exponential growth trend, which contained earnings growth since 1950, by one of the most significant deviations ever.“
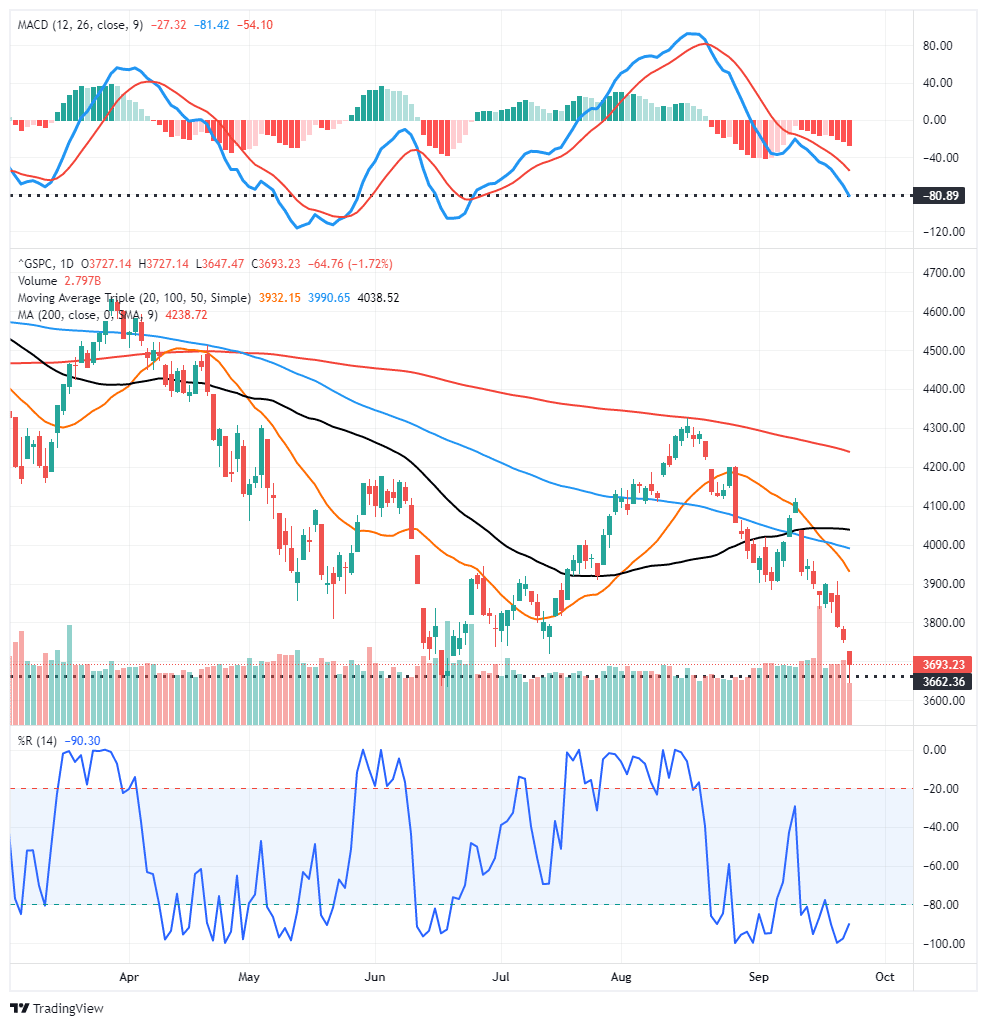
Such leaves the markets in a very tenuous position. However, in the short-term, markets are testing this year’s lows and are sufficiently oversold to provide a relief rally. However, there is little to get excited about until the Fed stops hiking rates aggressively and reducing its balance sheet. We will cut equity exposure levels on the next rally and raise cash levels further. Keep a watch on the MACD signal (top of the chart), as it will provide the best guidance for a sellable rally near term. There is a lot of congestion at the 3900-4000 level, which will provide sufficient resistance to cap a reflexive rally. Those levels provide a reasonable “sell” target for now.
Need Help With Your Investing Strategy?
Are you looking for complete financial, insurance, and estate planning? Need a risk-managed portfolio management strategy to grow and protect your savings? Whatever your needs are, we are here to help.

World’s Worst Economic Forecasters
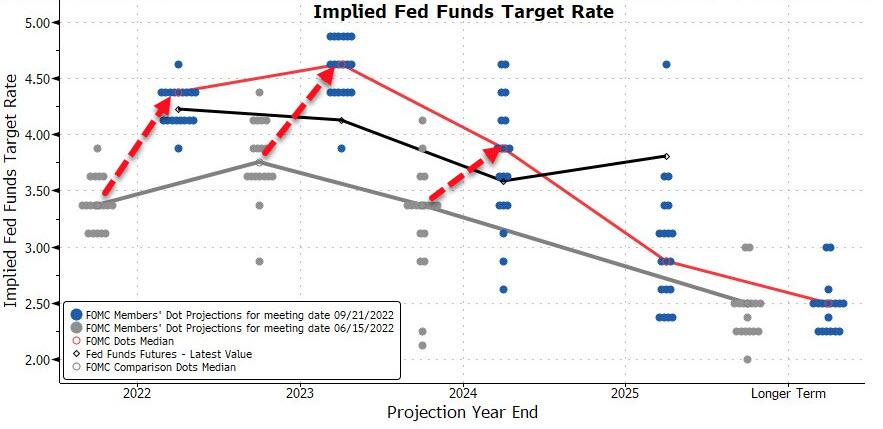
The 75bps hike on Wednesday was priced into the market. However, the Fed’s “Dot Plot,” showing no “pivot” in policy anytime soon, sent markets lower. There was a 10-9 majority in favor of hiking above 4.25% this year, suggesting a fourth 75 basis-point increase in November is possible. (Chart courtesy of Zerohege)
As noted by Zerohedge:
“Remember, until Powell’s Jackson Hole speech, the Fed discussed a soft landing scenario with the economic projections at the June meeting reflecting that thinking.”
Furthermore, the market was also pricing a “pivot” in monetary policy by May of 2023. The problem is that the Fed’s new economic projections dashed those hopes, with growth estimates slashed and inflation elevated.
- The Fed substantially revised GDP forecasts lower, with the median estimate for growth this year at just 0.2%.
- Unemployment rate forecasts are up, with the median now at 4.4% for both 2023 and 2024.
- The Fed doesn’t see inflation returning to its 2% target until 2025.
The problem is that while these statements clearly show that “no pivot” in policy is coming, they are also likely very wrong.
As we have discussed, the Federal Reserve is the worst economic forecaster ever. We have been tracking the median point of their projections since 2007, and they have yet to be accurate. The table and chart show the Fed is always inherently overly optimistic in its forecasts.
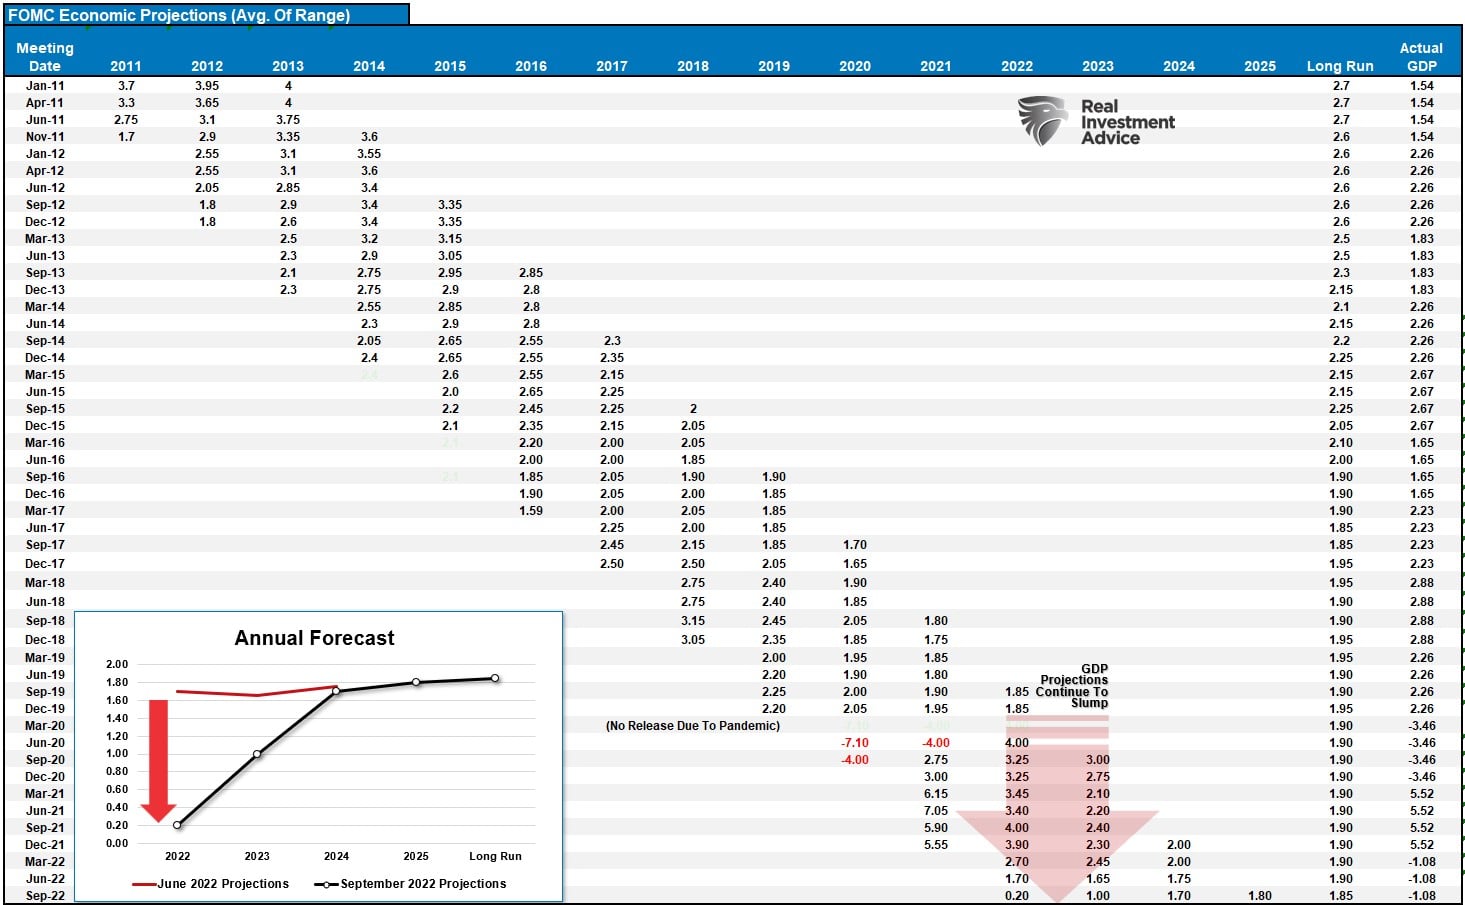
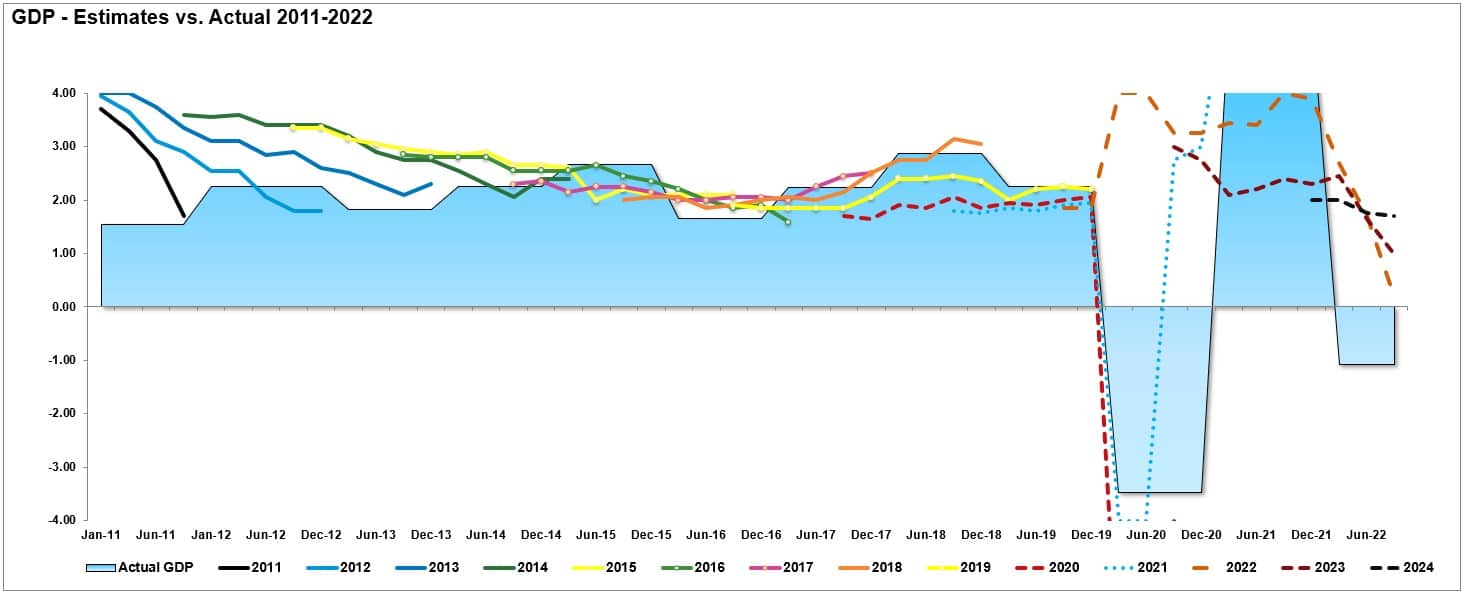
The corner graph shows the sharp drop in economic growth expectations since the July meeting. If they were this wrong just a few months ago, how wrong will they be in 2023?
While the Fed is currently pushing a “no pivot” stance, there is good reason to expect a pivot in 2023.
A 2008 Redux?
The September rate hike pushed the Fed funds rate to the highest since January 2008.
If you don’t remember what happened then, let me remind you.
In January 2008, the Fed was aggressively hiking interest rates amid a massive real estate bubble under the Chairmanship of Ben Bernanke. At that time, there was “no recession” in sight, “subprime mortgages were contained,” and it was a “Goldilocks economy.”
Eight months later, the market fell sharply, banks were on the brink of bankruptcy, and the economy was entrenched in a massive recession as Lehman Brothers filed for bankruptcy.
The Federal Reserve never predicted a recession and believed it could navigate a soft landing in the economy. They were wrong on multiple counts. As we showed previously, there are ZERO times in history when the Fed was hiking rates that outcomes were not bad to awful. After rates peaked and yield curves UN-inverted, recessions, bear markets, and crisis events occurred.
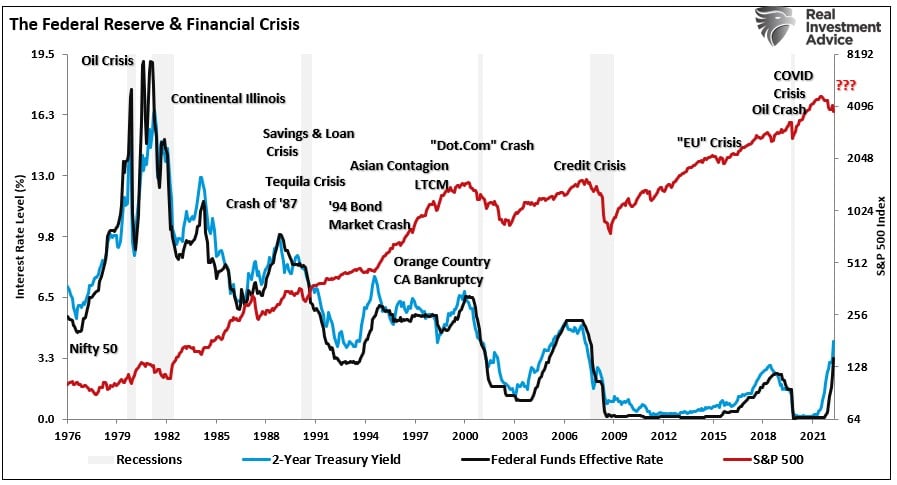
I don’t like market analogs. However, the current Fed policy of hiking rates and reducing their balance sheet is the most aggressive policy shift since that period. Every market environment is different, but the similarity of market action this year is interesting.
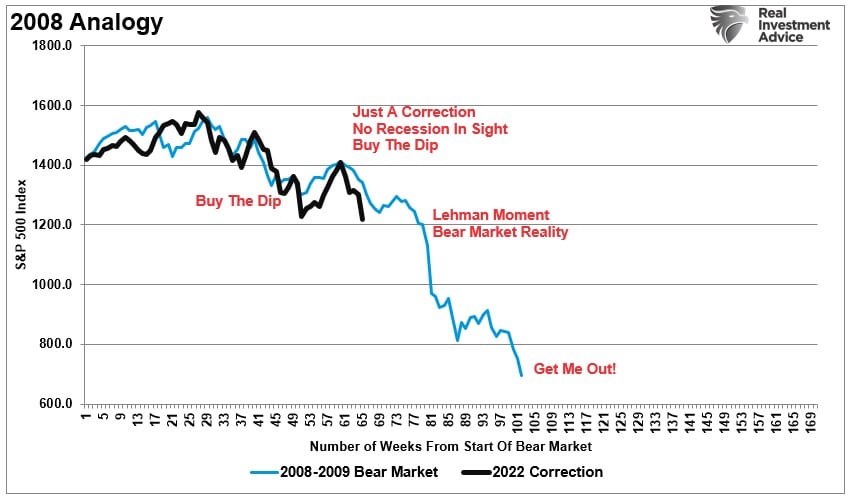
We are NOT suggesting another “Lehman Moment” is imminent. However, as noted above, a weaker economic environment, namely a recession, impacts asset prices as earnings and profit margins deteriorate.
Valuations are still not cheap, by any measure.
The Most Hated Asset
We discussed last week why “bonds” are likely to be the next “buy” of the decade. Interestingly enough, with bonds in the most significant bear market on record, no one wants to buy them. Such is the case historically, as investor psychology always contradicts investing realities.
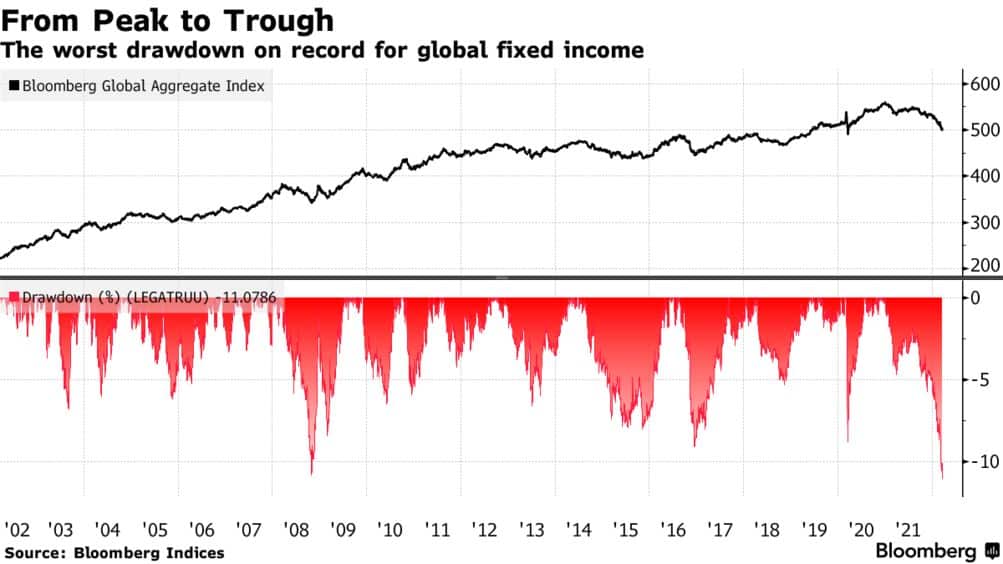
As I quoted then:
“The action of the credit market is consistent with economic weakness and stock market trouble. I think you have to start becoming more bearish on stocks. Buy long-term Treasuries. Although the narrative today is exactly the opposite, the deflation risk is much higher today than it’s been for the past two years. I’m not talking about next month. I’m talking about sometime later next year, certainly in 2023.” – Jeff Gundlach, DoubleLine
I am reiterating this commentary because the recent actions by the Fed almost guarantee a recession, economic event, or worse. In such an event, the demand for “safety” will become a primary market consideration.
Such is because money flows from risk assets into Treasury bonds for safety when a recession occurs. We see this clearly in the chart below of corporate bond and Treasuries yields. While it hasn’t happened yet, corporate yields rise during a bear market or economic event as money rotates into Treasuries’ safety, causing long-dated yields to fall.
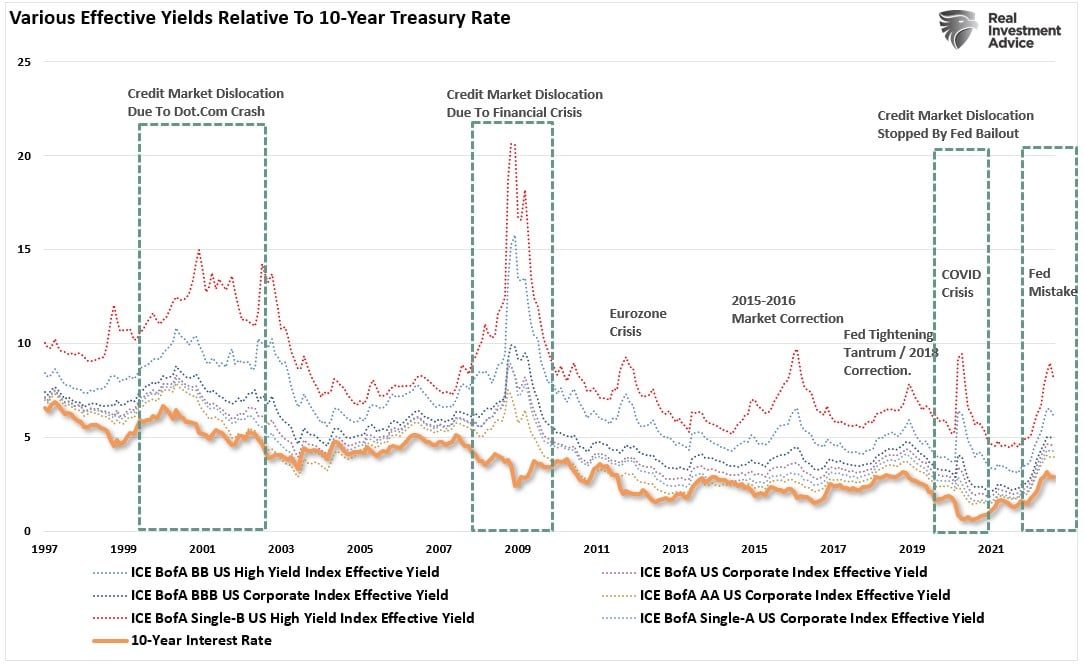
While the Fed’s “no pivot” policy stance is driving up Treasury yields short-term, the reality is that each increase puts the Fed one step closer to a policy mistake. It is quite likely the Fed has already tightened more than the economy can withstand. However, given the lag time of policy changes to show up in the data, we won’t know for certain for several more months.
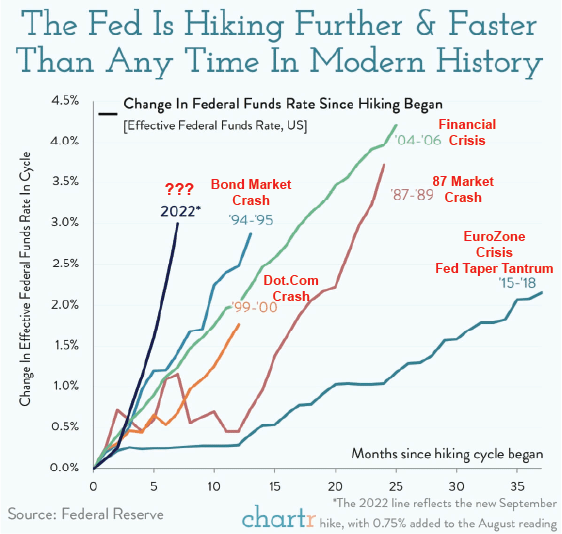
With the Fed removing liquidity from the markets at the most aggressive pace ever, the risk of a policy mistake is higher than most appreciate. Such is shown in the annotated chart from Chartr below.
While buying bonds today may still have some “pain” in them, we are likely closer to a significant buying opportunity than not.
More importantly, if we are correct, the coming bull market in bonds will likely outperform stocks and inflation-related trades over the next 12 to 24 months.
Such an outcome would not be the first time that happened.
Of course, buying bonds when no one else wants them is a tough thing to do.
Not Getting The Bull Bear Report Each Week In Your Mailbox? Subscribe Here For Free.
How We Are Trading It
The Fed’s “no pivot” policy stance continues to drive the markets short-term. Investors remain at the mercy of volatile markets with little direction on where capital can find safety. Gold has not hedged inflation. Bonds have not hedged risk, and equities remain under continuous pressure.
The setup remains increasingly more bearish than bullish, so we maintain our risk-averse positioning. With higher levels of cash, underweight equity, and bonds, we continue to err towards caution for now. As noted, there is a developing opportunity to own long-dated Treasury bonds, but you will need to give that thesis time to play out into 2023.
The Fed funds futures market has now priced in the Fed’s likely “terminal rate” on monetary policy going into 2023. This week, we moved our cash holdings into short-term treasuries as we see no near-term catalysts to deploy that cash into equities. We will likely use the next oversold rally in the market to raise cash, further reduce risk, and rebalance portfolios accordingly.

A rally next week won’t be surprising with the markets back to more oversold levels.
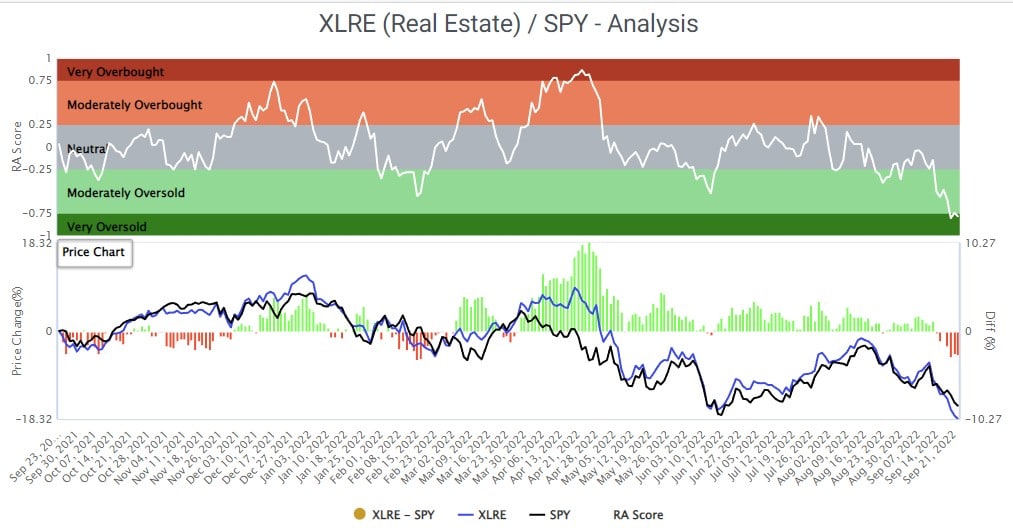
Short-Term Traders can add to beaten-down equities and look for sector rotations opportunistically. Our SimpleVisor.com “Relative Analysis” page can help you find oversold sectors and equities and provide tradeable opportunities.
Long-Term Investors stay the course for now. As noted in the opening commentary, markets are oversold enough for a tradeable rally back to the 50-dma. Investors should use such a rally to rebalance portfolio risk to levels you are comfortable maintaining. We suspect we will see lower lows before the final market bottom, which will coincide with the Fed putting an end to its “no pivot” stance.
Oh…and don’t forget about bonds.
See you next week.
Research Report

Market Week In Review With Adam Taggart
Subscribe To Our Youtube Channel To Get Notified Of All Our Videos
Stock Of The Week In Review
Factors For Success – Buying TAAMG Stocks
On August 25, 2022, we published Five for Friday: Factors for Success. The screen used our internal factor analysis tool to see which stock factors are most likely to hold up best in a market decline. As we wrote in the article:
“Where should I put my money if we get another leg down in the market?”
From August 25th through September 16th, the S&P 500 fell over 8%. The high dividend yield factor was the third best relative performer factor, beating the S&P 500 by 2.48%. The screen was simple and selected the ETF’s five largest holdings. The five stocks fell 2.5% on average, handily outperforming the S&P 500.
This week we take the opposite approach. With the market trading lower over the past month and many technical indicators pointing to oversold conditions, we select the top five holdings from the factor that has been the poorest relative performer year to date.
We chose the top five holdings from our proxy ETF, MGK, as our five stocks this week. As the top holdings in the factor ETF, they should benefit from passive-investing inflows into the ETF. All five are well-known large-cap stocks and comprise four-fifths of the infamous FAANG acronym.
Apple (AAPL)
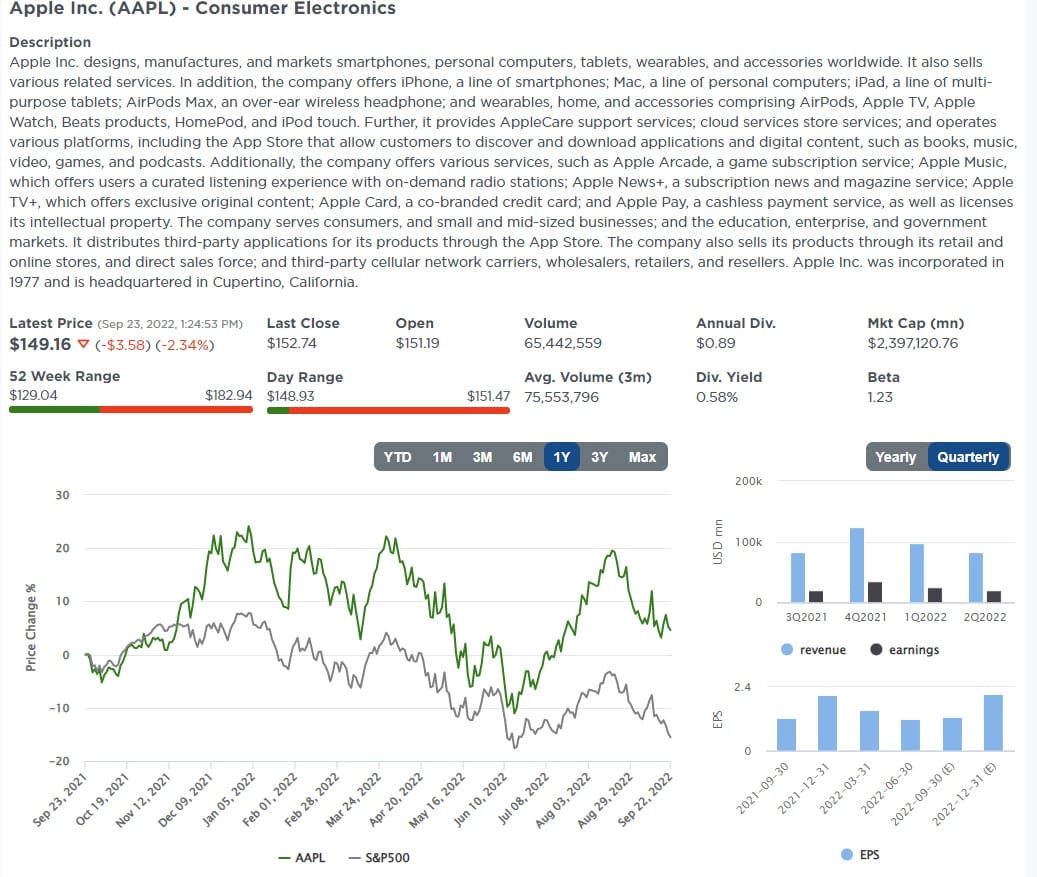
Login to Simplevisor.com to read the full 5-For-Friday report.
Daily Commentary Bits
Are 4% One-Year T-Bills A Good Investment?
The graph below shows the long-term history of one-year T-bill yields and compares the recent surge in yields versus prior periods. While many investors focus on the 4% yield and the fact that it is now at its highest point in almost 15 years, the bigger story is the recent surge in yields. In just one year, the one-year yield has risen 4%. The last time yields rose that much in one year was about 40 years ago.

Click Here To Read The Latest Daily Market Commentary (Subscribe For Pre-Market Email)
Bull Bear Report Market Statistics & Screens

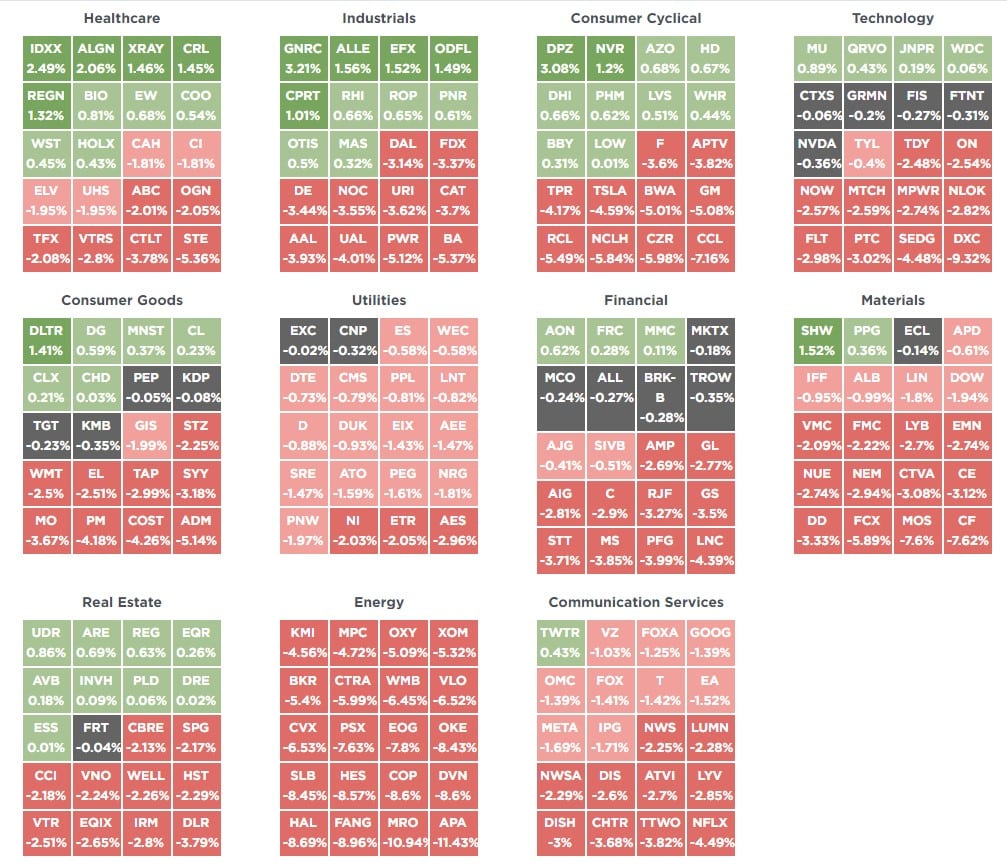
SimpleVisor Top & Bottom Performers By Sector
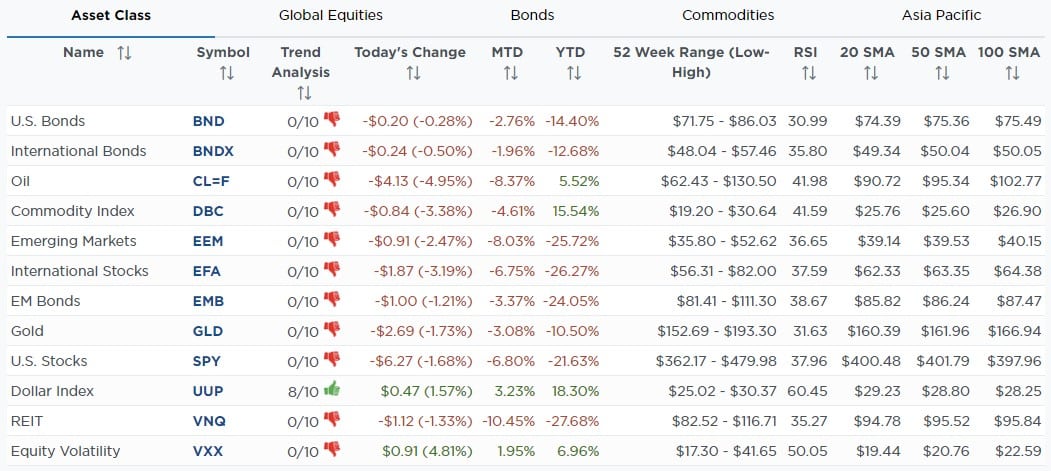
SimpleVisor Asset Class Trend Analysis
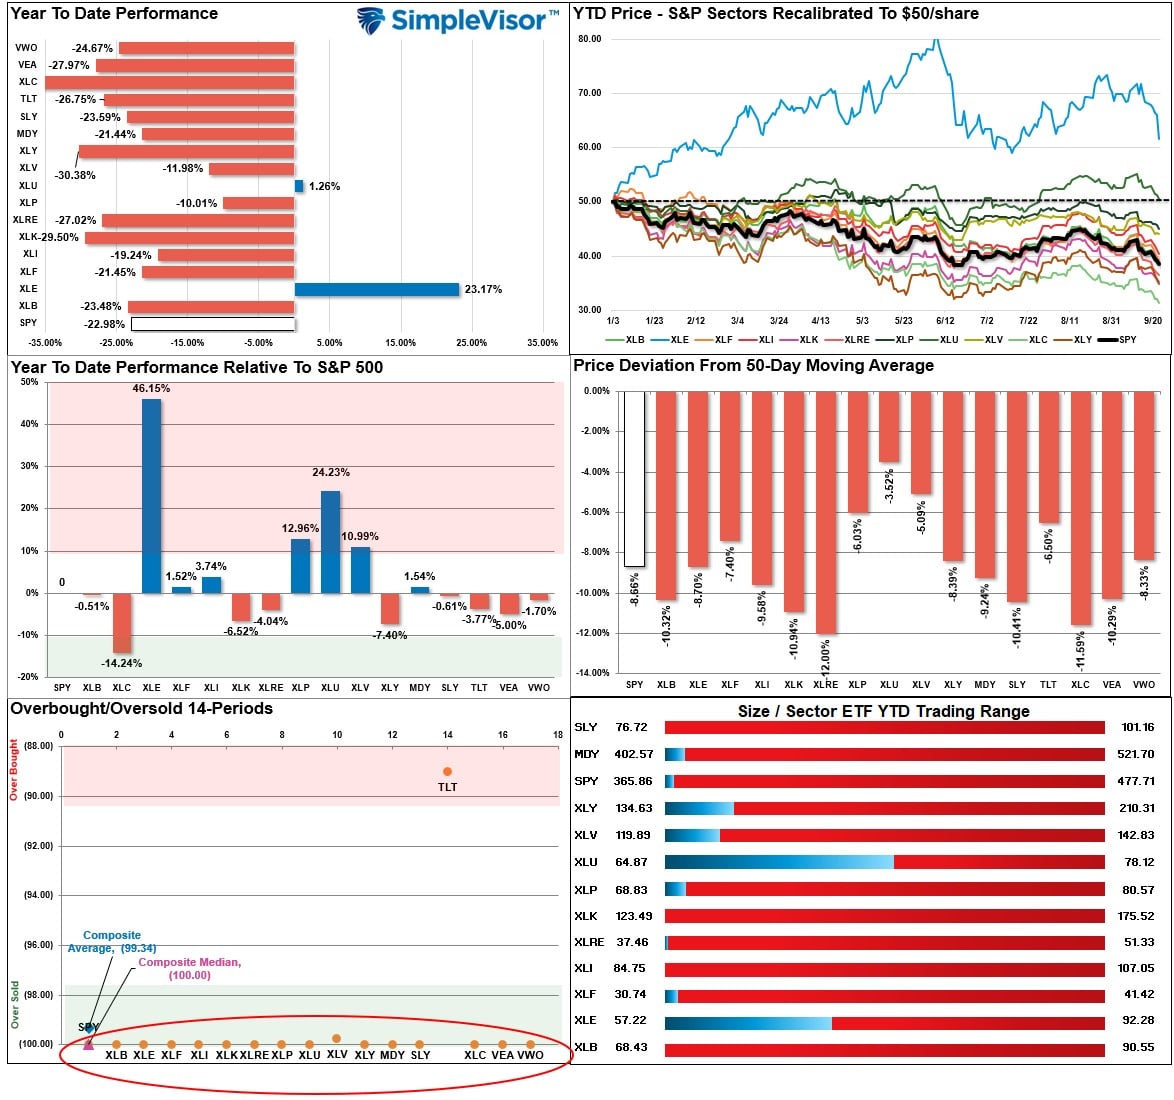
Relative Performance Analysis
Last week, we stated:
The CPI report led to a sharp market plunge this week. That decline took the vast majority of sectors back to more extreme oversold levels, likely supporting a reflexive rally next week. We are back into “selling rallies and reducing risk” mode until the technical backdrop improves.
The Fed’s “no pivot” policy pushed assets further into oversold conditions. Historically, when every sector and market is oversold, counter-trend rallies are highly probable. Use that rally to sell into.
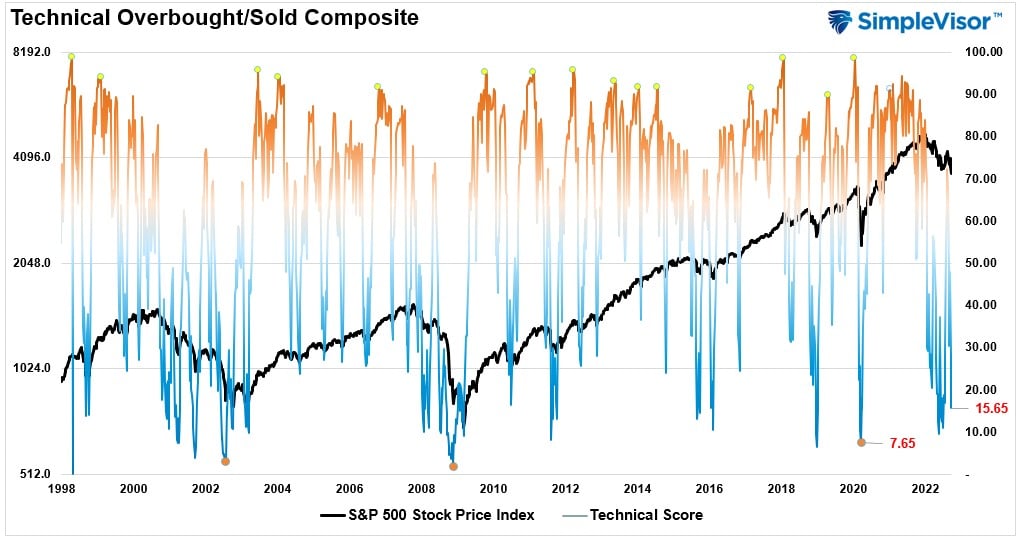
Technical Composite
The technical overbought/sold gauge comprises several price indicators (RSI, Williams %R, etc.), measured using “weekly” closing price data. Readings above “80” are considered overbought, and below “20” are oversold. Markets tend to peak when readings are at 80 or above, which suggests profit taking and risk management are prudent. The best buying opportunities exist when readings are 20 or below.
The current reading is 15.65 out of a possible 100 and rising. Remain long equities for now.
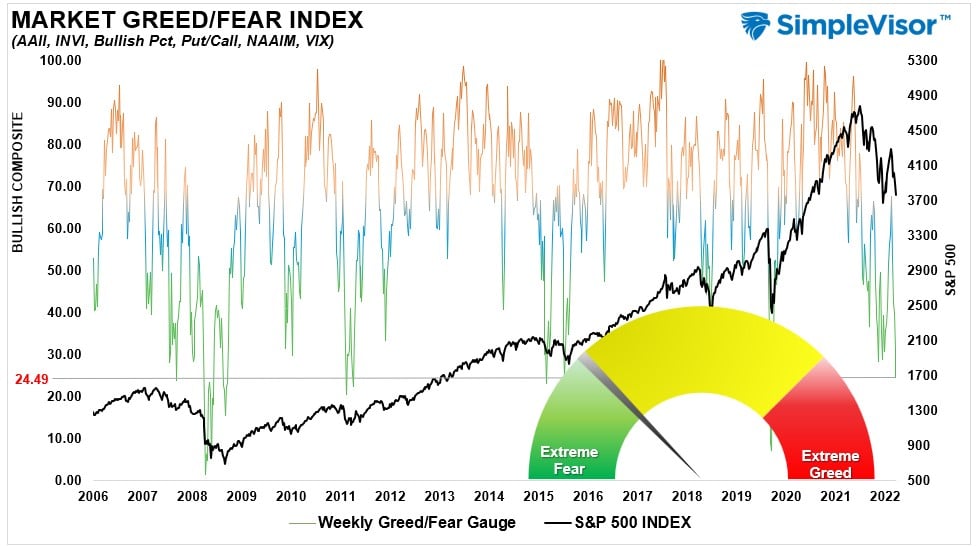
Portfolio Positioning “Fear / Greed” Gauge
The “Fear/Greed” gauge is how individual and professional investors are “positioning” themselves in the market based on their equity exposure. From a contrarian position, the higher the allocation to equities, to more likely the market is closer to a correction than not. The gauge uses weekly closing data.
NOTE: The Fear/Greed Index measures risk from 0 to 100. It is a rarity that it reaches levels above 90. The current reading is 24.49 out of a possible 100.
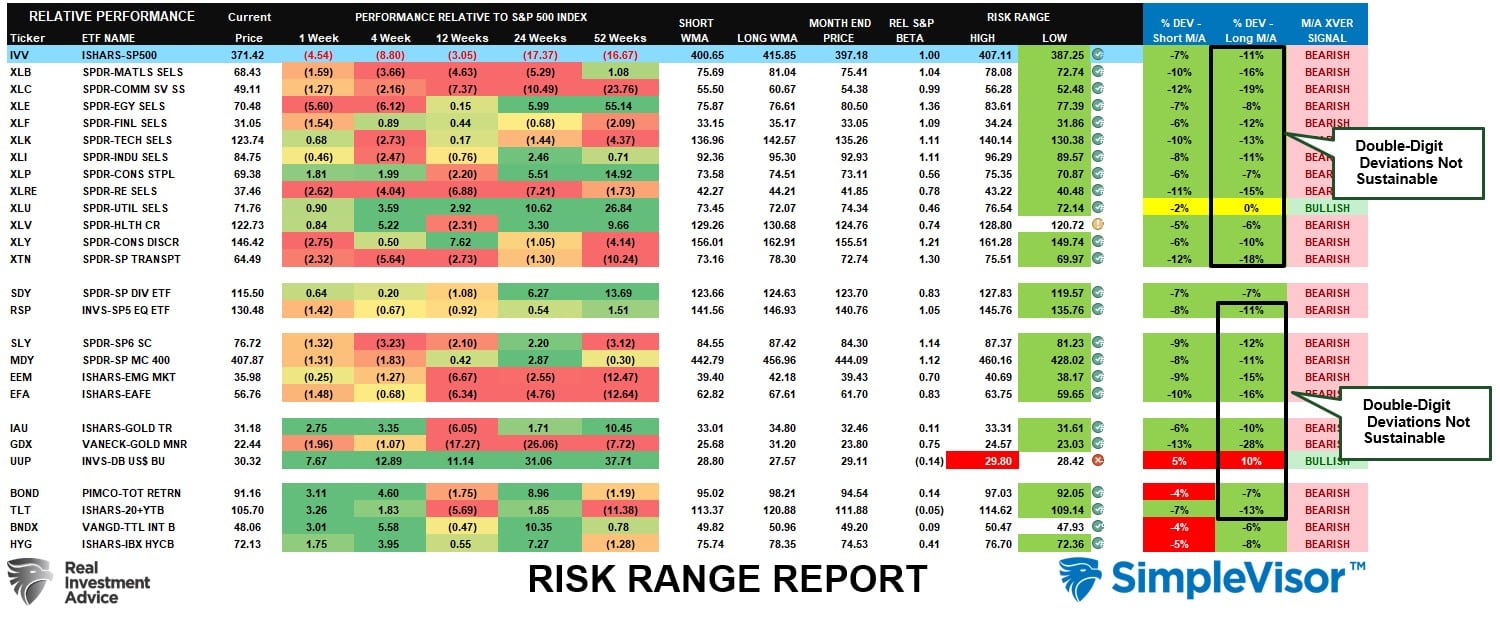
Sector Model Analysis & Risk Ranges
How To Read This Table
- The table compares the relative performance of each sector and market to the S&P 500 index.
- “M/A XVER” is determined by whether the short-term weekly moving average crosses positively or negatively with the long-term weekly moving average.
- The risk range is a function of the month-end closing price and the “beta” of the sector or market. (Ranges reset on the 1st of each month)
- The table shows the price deviation above and below the weekly moving averages.
This week, the market plunge took most sectors and markets into double-digit deviations below long-term weekly moving averages. Such extremes are not sustainable, and when all markets and sectors are this oversold, a reflexive rally becomes highly probable. Every sector, except Healthcare, are below monthly ranges. The Dollar, on the contrary, is extremely overbought. Selling the Dollar to buy Bonds is likely a good hedge trade.
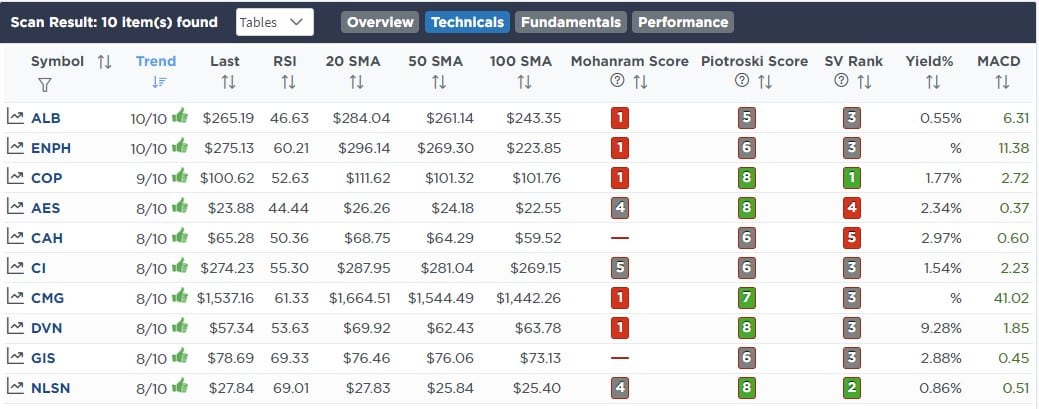
Weekly SimpleVisor Stock Screens
Each week we will provide three different stock screens generated from SimpleVisor: (RIAPro.net subscribers use your current credentials to log in.)
This week we are scanning for the Top 20:
- Relative Strength Stocks
- Momentum Stocks
- Highest Rated Stocks
These screens generate portfolio ideas and serve as the starting point for further research.
(Click Images To Enlarge)
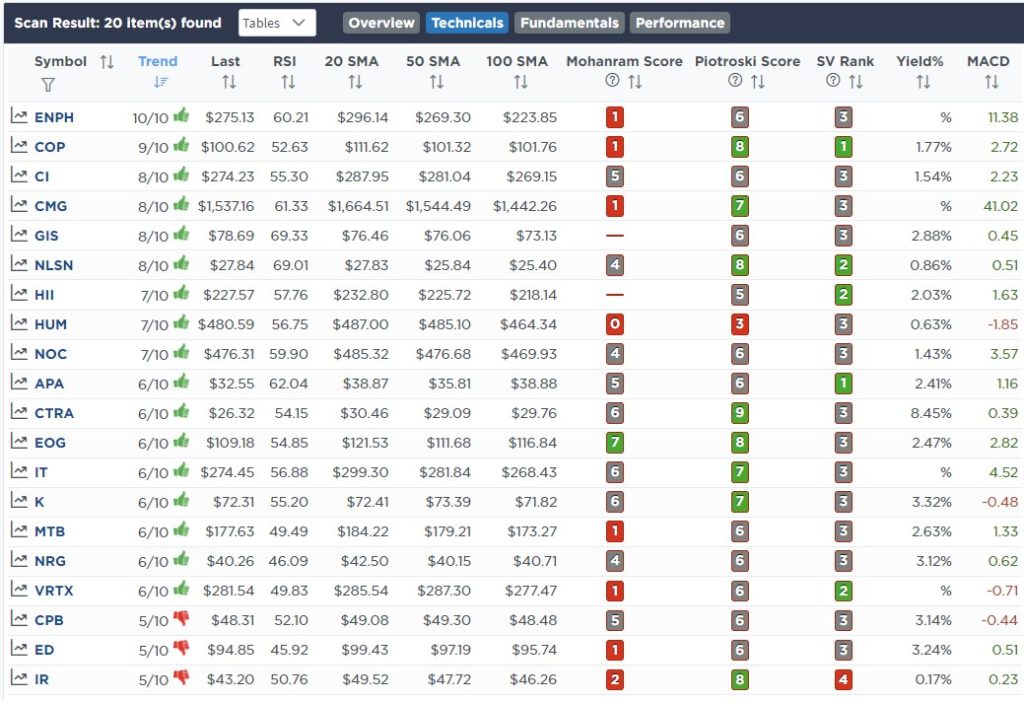
RSI Screen
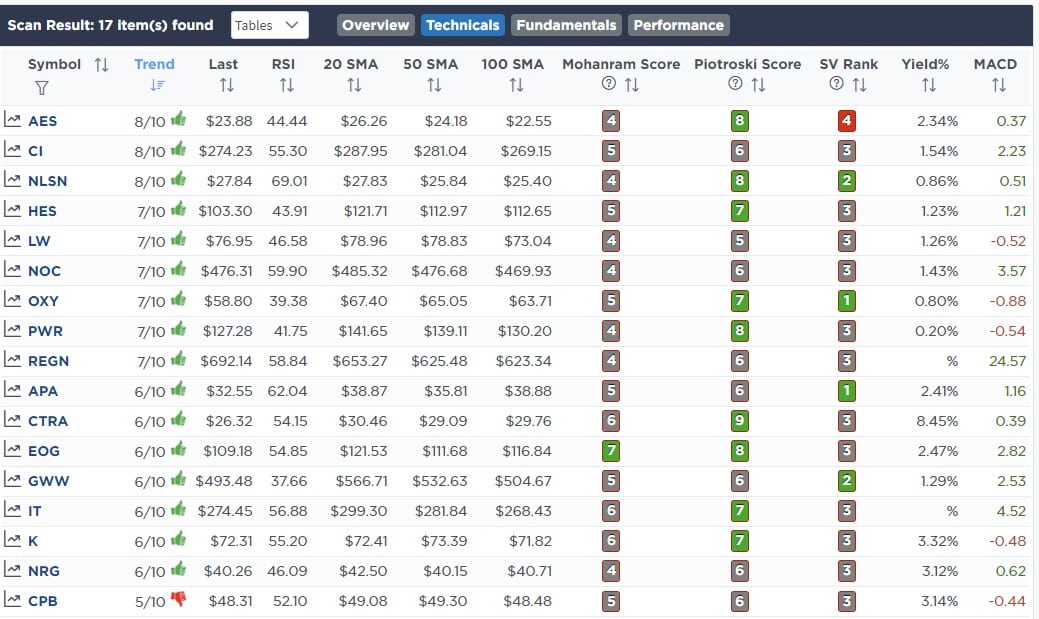
Momentum Screen
Highest Rated Screen
SimpleVisor Portfolio Changes
We post all of our portfolio changes as they occur at SimpleVisor:
Sep 22nd
All Models
With short-term Treasury bills now reflecting the Fed Fund Futures terminal rate, we are taking advantage of the spread over money market accounts by moving cash into the SPDR 1-3 Month Treasury Bill ETF (BIL) for now. As we get to the point of wanting to deploy cash back into equities we will start selling down BIL to buy other positions.
- Buy 15% Of The Portfolio Into BIL

Lance Roberts, CIO
Have a great week!


