
Inside This Week’s Bull Bear Report
- Market Review & Update
- Debt Downgrade As Fitch Drops Rating
- How We Are Trading It
- Research Report – Debts, Deficits & Why $32 Trillion Matters
- Youtube – Before The Bell
- Market Statistics
- Stock Screens
- Portfolio Trades This Week
Market Review & Update
This week’s debt downgrade by Fitch sent the media into a tizzy. However, it was just the catalyst needed to start the correction we have discussed over the last few weeks. As noted two weeks ago:
“We must remember that market advances can only go so far before an eventual correction occurs. My best guess is that if the markets are to reach all-time highs this year, we will likely have a correction to reset some of the more extreme overbought conditions, as shown below. Any pullback to the 50-DMA is likely a good entry point to increase exposure on a better risk/reward basis.”
As noted, that correction started this past week. There are several vital points in the chart below.
- The negative divergence of the MACD and RSI was a warning sign of an impending correction. All that was needed was a catalyst to spook buyers: the debt downgrade.
- There was a significant uptick in the volatility index for the first time since May. (As discussed in “Complacency”)
- Moving average support levels are important indicators of the potential depth of the correction.
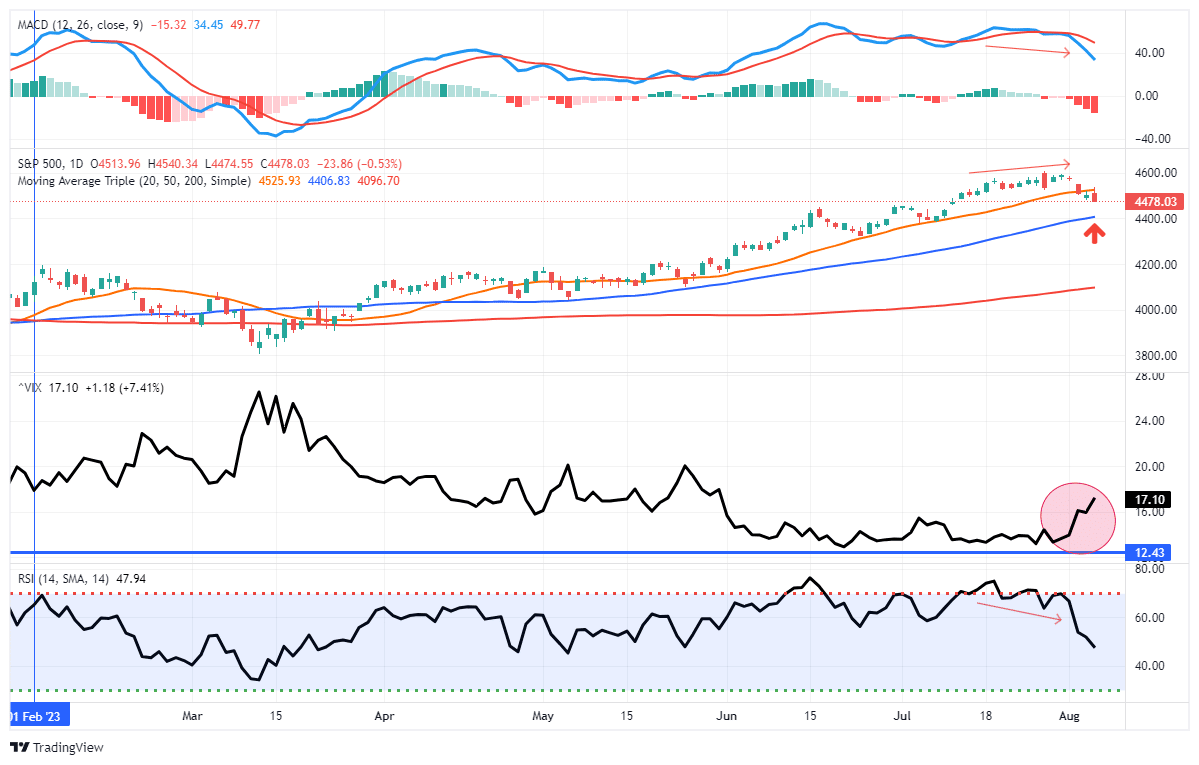
On Friday, the market rallied to and failed at the 20-DMA. That technical failure of resistance potentially puts the 50-DMA as the next target of the correction. With the Relative Strength Index (RSI) not oversold and the MACD indicator on a “sell signal,” continuing the correction next week would be unsurprising.
As we discussed over the last few weeks, a 3-5% correction should be expected and is normal within any market year. However, a 10% correction to the 200-DMA is also not out of the question and is entirely normal. With bullish price momentum and elevated investor sentiment, this correction process remains a buying opportunity for higher asset prices into year-end.
While there are undoubtedly many economic and fundamental issues, many of those issues won’t likely manifest themselves until next year. However, most importantly, while the media was “shocked” at the debt downgrade by Fitch this past week, a history review reminds us that this is likely not the event that ends the bull market.
Need Help With Your Investing Strategy?
Are you looking for complete financial, insurance, and estate planning? Need a risk-managed portfolio management strategy to grow and protect your savings? Whatever your needs are, we are here to help.

Debt Downgrade
On Tuesday, one of the three largest debt rating agencies, Fitch, downgraded the U.S. credit rating.
“Fitch Ratings has downgraded the United States of America’s Long-Term Foreign-Currency Issuer Default Rating (IDR) to ‘AA+’ from ‘AAA’. The Rating Watch Negative was removed and a Stable Outlook assigned. The Country Ceiling has been affirmed at ‘AAA’.
What is the reasoning given by Fitch for the downgrade?
“The rating downgrade of the United States reflects the expected fiscal deterioration over the next three years, a high and growing general government debt burden, and the erosion of governance relative to ‘AA’ and ‘AAA’ rated peers over the last two decades that has manifested in repeated debt limit standoffs and last-minute resolutions.”
It is that last sentence that is the most important. Since 2008, the U.S. has not passed a single budget. Instead, Congress has repeatedly opted for short-term funding bills, known as Continuing Resolutions, which raised the debt ceiling, and increases spending by 8% annually. Such is why the national debt, specifically the deficit, has continued to grow unabated. Such was a point we discussed in why $32 Trillion matters.
“While Washington continues a seemingly unbridled spending spree under the assumption “more spending” is better, debts and deficits matter. To better understand the impact of debt and deficits on economic growth, we must know where we came from. The chart shows the 10-year annualized growth rate of the economy over time.“
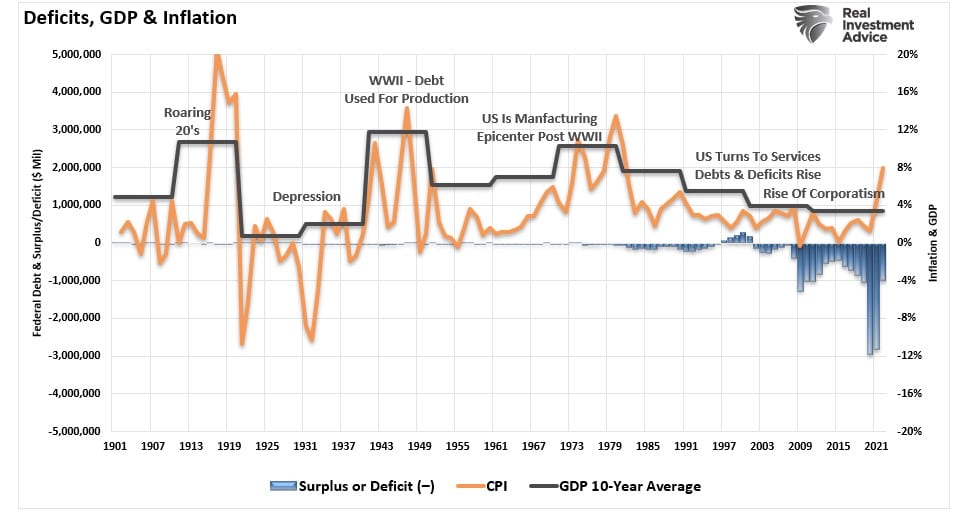
What should immediately jump out at you is that the 10-year average economic growth rate was around 8%, except for the Great Depression era, from 1900 through 1990. However, there has been a marked decline in economic growth since then. Unsurprisingly, as debts and deficits grow, the diversion of capital from productive activities to debt service erodes economic growth.
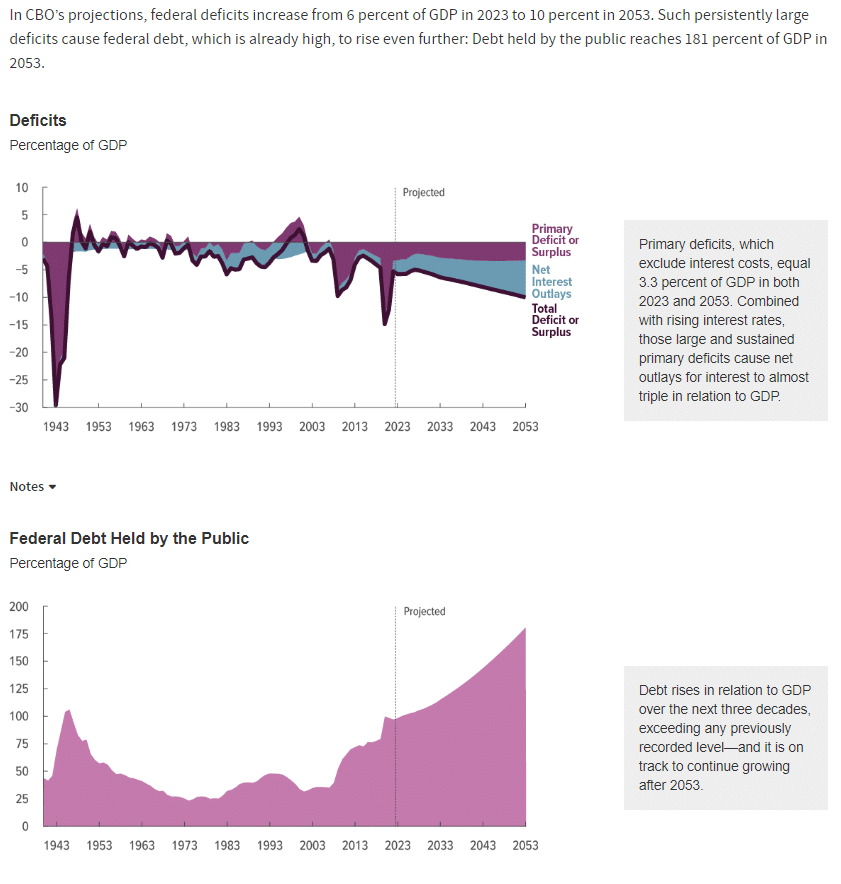
That growth in debt is on a non-stop train to “Japanification,” where debt continues to rise, and economic growth is anemic. The Congressional Budget Office recently released its trajectory for U.S. debt levels through 2053, showing the same.
Such was also a point by Fitch concerning the rating downgrade.
“The General Government debt-to-GDP ratio is projected to rise over the forecast period, reaching 118.4% by 2025. The debt ratio is over two-and-a-half times higher than the ‘AAA’ median of 39.3% of GDP and ‘AA’ median of 44.7% of GDP. Fitch’s longer-term projections forecast additional debt/GDP rises, increasing the vulnerability of the U.S. fiscal position to future economic shocks.“
While Fitch is correct in its debt downgrade of the United States, this isn’t the first time. (The debt is also why interest rates can not rise to higher levels, a topic of an upcoming article on why we continue to buy Treasury bonds.)
A Trip Back In Time
“Credit rating agency Standard & Poor’s on Friday downgraded the United States’ credit rating, stripping the world’s largest economy of its prized AAA status.
In July, S&P placed the United States’ rating on “CreditWatch with negative implications” as the debt ceiling debate devolved into partisan bickering. To avoid a downgrade, S&P said the United States needed to raise the debt ceiling and develop a “credible” plan to tackle the nation’s long-term debt.
In its report Friday, S&P ruled that the U.S. fell short: “The downgrade reflects our opinion that the … plan that Congress and the Administration recently agreed to falls short of what, in our view, would be necessary to stabilize the government’s medium-term debt dynamics.”
S&P also cited dysfunctional policymaking in Washington as a factor in the downgrade. “The political brinksmanship of recent months highlights what we see as America’s governance and policymaking becoming less stable, less effective, and less predictable than what we previously believed.” – CNN.Com
That action occurred on August 5th, 2011, and the Obama Administration faced off with Congress over the debt ceiling debate. Interestingly, that was almost 12 years ago to the day, with the Treasury Department pushing back, saying the “analysis was flawed” in both cases.
“Janet Yellen, the US treasury secretary, said she disagreed with Fitch’s downgrade, in a statement that called it “arbitrary and based on outdated data.” – The Guardian
As with Fitch’s debt downgrade, the reasons behind S&P’s action were almost identical, focusing on the Government’s inability to deal with long-term debt issues.
Michael Lebowitz made an interesting comment on Thursday, noting:
“The U.S. credit rating is not worthy of the AAA rating. If the U.S. were a corporation, Fitch and S&P would likely rate its debt as junk!”
Jamie Dimon, CEO of J.P. Morgan, also echoed Michael’s words:
“It doesn’t really matter that much” because it’s the market, not rating agencies, that determines borrowing costs. Still, it’s ridiculous that other countries have higher credit ratings than the U.S. when they depend on the stability created by the U.S. and its military. To have them be triple-A and not America is kind of ridiculous. It’s still the most prosperous nation on the planet, it’s the most secure nation on the planet.”
So the question facing investors is, do we care?
What Happened The Last Time U.S. Debt Was Downgraded
Just as in 2011, headlines are rampant with fearmongers ramping up the rhetoric about a dollar collapse, the economy’s demise, and the stock market’s collapse. While I am certainly not dismissing the issues with the debt buildup long-term, as noted in the linked article above, in the short term, history suggests there is much less to worry about.
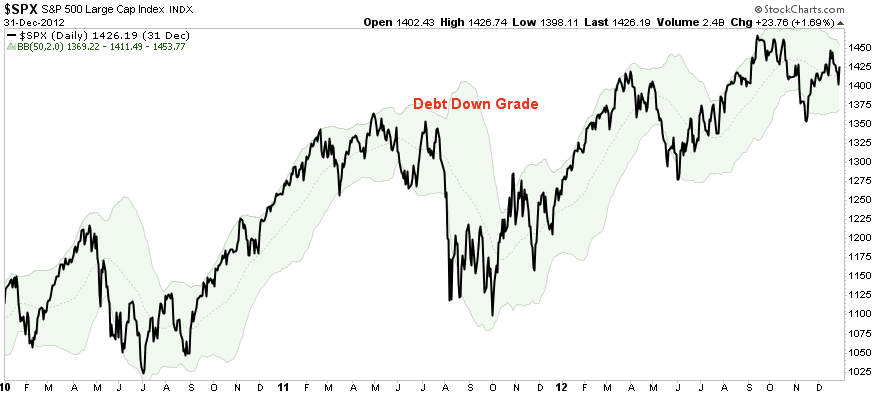
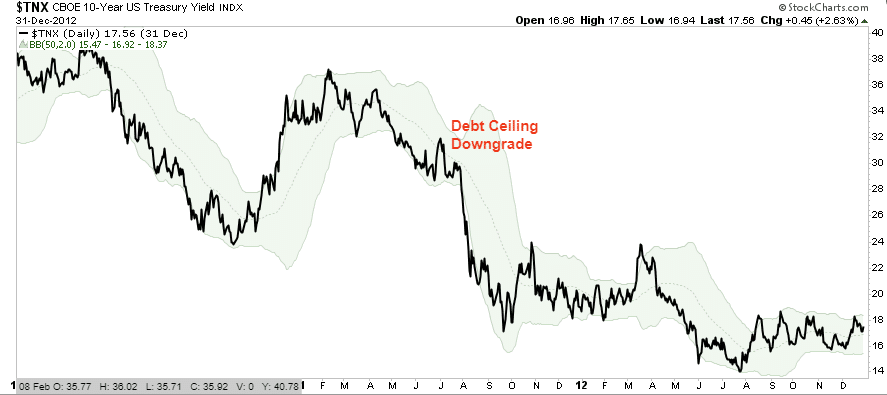
Let’s take a look at 2011 for a moment in charts. The first chart below is the stock market. As you will note, much like the advance we witnessed over the last few months, the market had rallied sharply from the lows in 2010 and was pretty overbought at the time of the debt downgrade. While prices did correct due to a combination of the manufacturing shutdown in Japan, a slowing U.S. economy, and the debt downgrade, that decline was a buying opportunity as the bullish trend continued into 2012.
Likewise, in 2011, the yields on treasury debt also spiked higher temporarily as the debt downgrade shook investors. However, given that the U.S. treasury bond market remains the world’s preferred “safe haven,” yields declined into 2012. As is always the case, long-duration yields are a function of inflation and economic growth. The more debt issued, the slower the economic growth rate over time. Many “bond gurus” expect yields to spike sharply due to needed debt issuance. However, the reality is that economy can’t sustain higher rates because of the debt. What happened in 2011 will most likely repeat itself in the months and quarters ahead as economic growth slows.
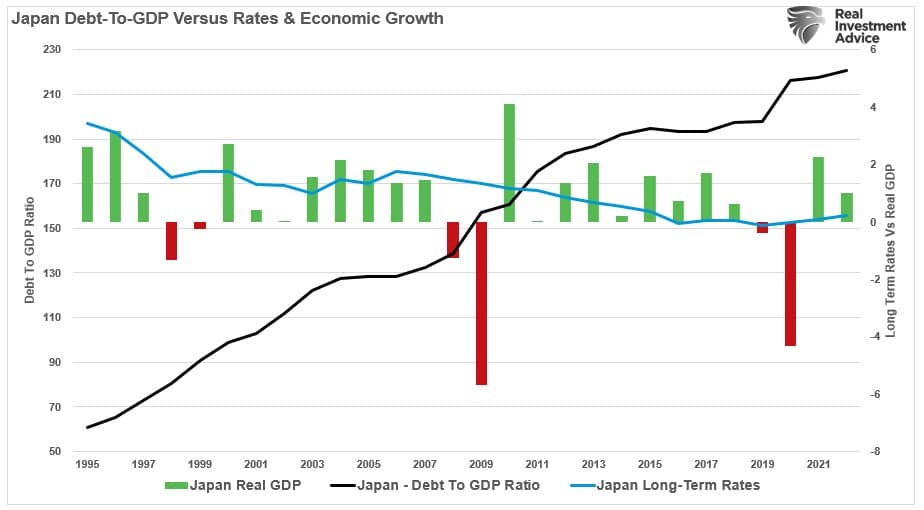
For evidence of such an outcome, we only have to look at Japan to understand the consequences of debt when it exceeds 100% of GDP. Since the 80s, Japan’s economic trajectory has remained lower. Despite massive Government and Central Bank interventions, interest rates remain stuck near zero percent as the economy experiences rolling recessions plaguing overall prosperity.
While the long-term implications are dire, the near impact on various assets is much less concerning.
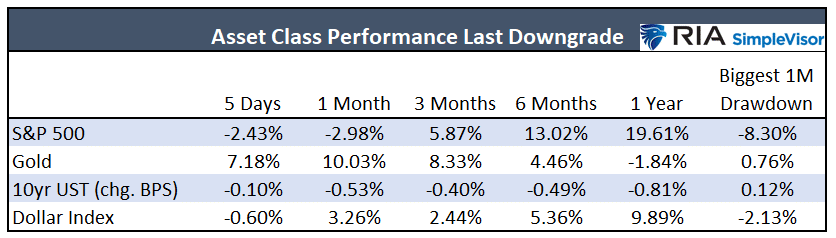
“The U.S. can print money and avoid default no matter how bad its fiscal position is. Accordingly, U.S. Treasury debt will still be considered the world’s only risk-free asset regardless of its ratings. The table below shows the market reactions to the S&P downgrade in 2011. Unexpectedly, bond yields fell appreciably, and the dollar rose, despite the downgrade. One would have thought gold would be a beneficiary. It was initially, but its price was slightly lower a year later. Stocks troughed 8% lower within the first week of the downgrade but were on solid footing afterward. Like twelve years ago, the downgrade may provide opportunities contrary to what many expect.“ – Lebowitz
Watch the following video for a deeper discussion on why the Fitch downgrade isn’t a market event most expect.
How We Are Trading It
From a portfolio management perspective, the debt downgrade does nothing to change our outlook for the rest of this year. The momentum of the market, combined with the need for professional managers to chase performance, will likely keep the market in a bullish trend for now. As noted, the media quickly blamed the debt downgrade while the market finally started a short-term correction. The downgrade was just the needed catalyst.
Are we concerned about the potential for a recession or some financial event? Of course. Given the aggressiveness of the Fed rate hikes and tightening of lending standards, the possibility of such an event has risen. However, the market will provide advance notice if we continue to pay attention to our technical indicators. When those indicators warn of increasing risks, such will be the time to reduce equity exposure as needed more aggressively.
However, the bullish trend continues for now. A correction that holds support and works off some of the overbought conditions will be a healthy outcome. Such will provide better risk/reward opportunities to increase equity exposures accordingly.
With both technical and sentiment readings suggesting this correction may have further to go, it is likely wise that investors rebalance portfolio risk accordingly.
- Tighten up stop-loss levels to current support levels for each position.
- Hedge portfolios against more significant market declines.
- Take profits in positions that have been big winners.
- Sell laggards and losers.
- Raise cash and rebalance portfolios to target weightings.
Have a great weekend.
Research Report
Subscribe To “Before The Bell” For Daily Trading Updates (Formerly 3-Minutes)
We have set up a separate channel JUST for our short daily market updates. Please subscribe to THIS CHANNEL to receive daily notifications before the market opens.
Click Here And Then Click The SUBSCRIBE Button
Subscribe To Our Youtube Channel To Get Notified Of All Our Videos
Bull Bear Report Market Statistics & Screens

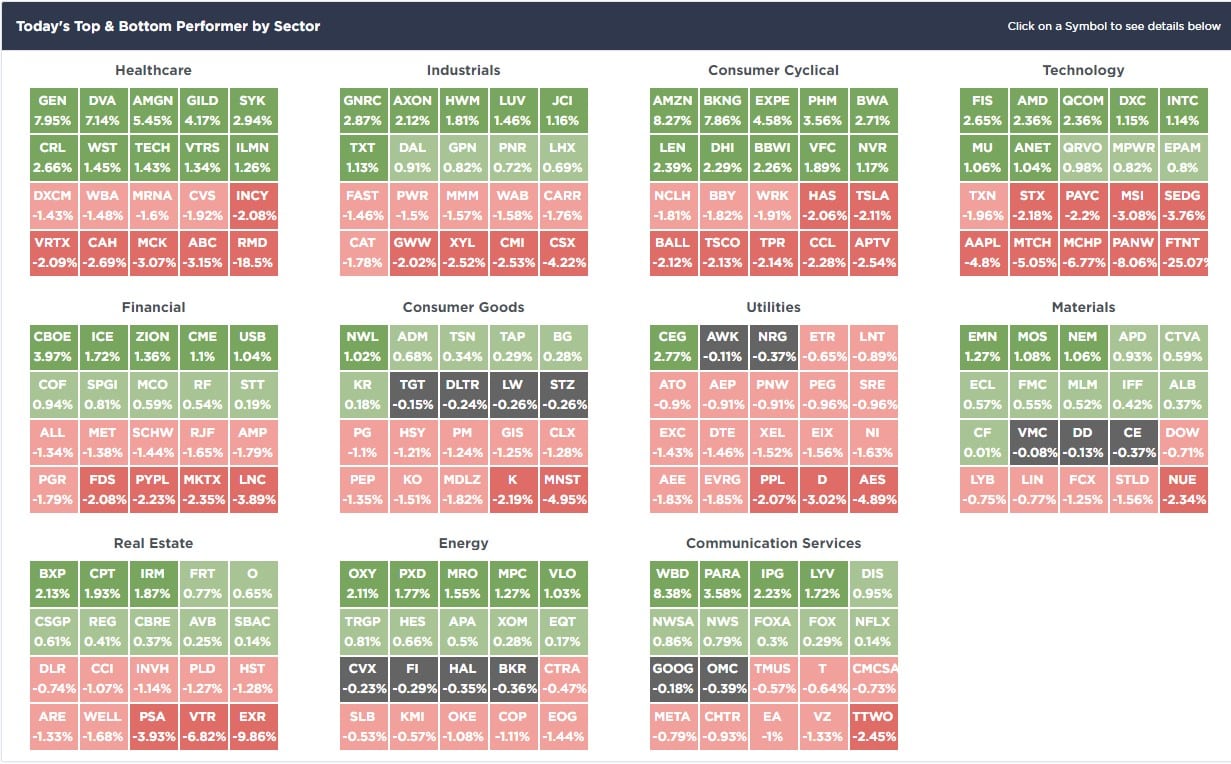
SimpleVisor Top & Bottom Performers By Sector
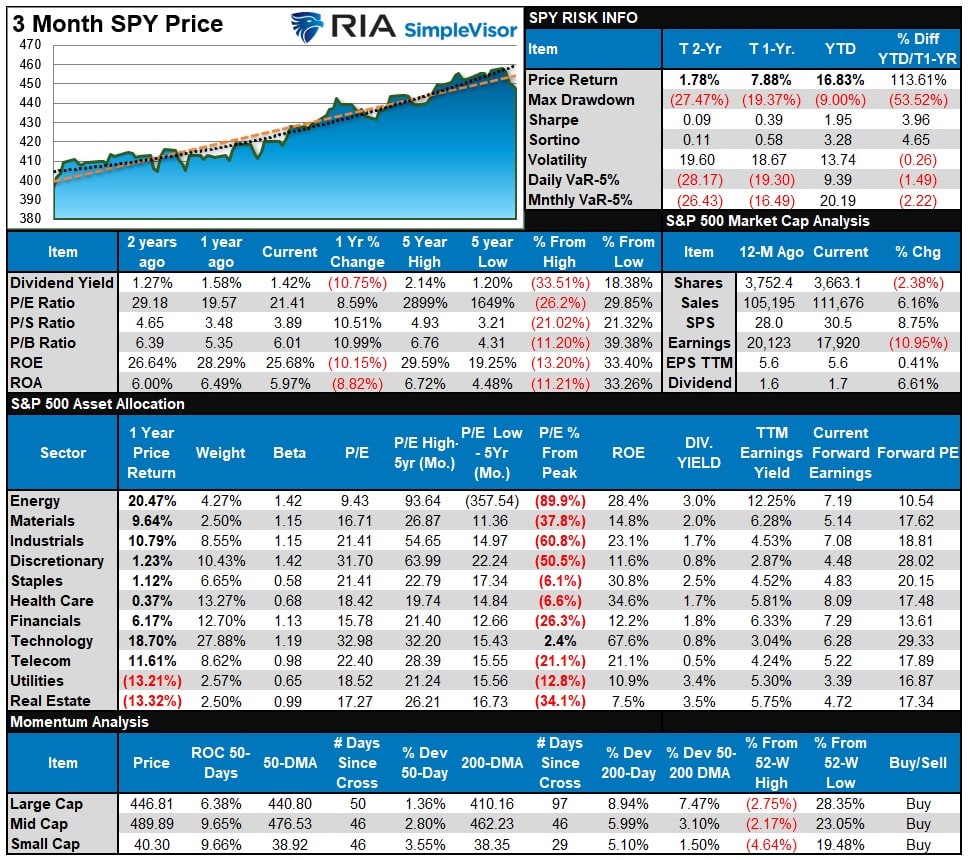
S&P 500 Weekly Tear Sheet
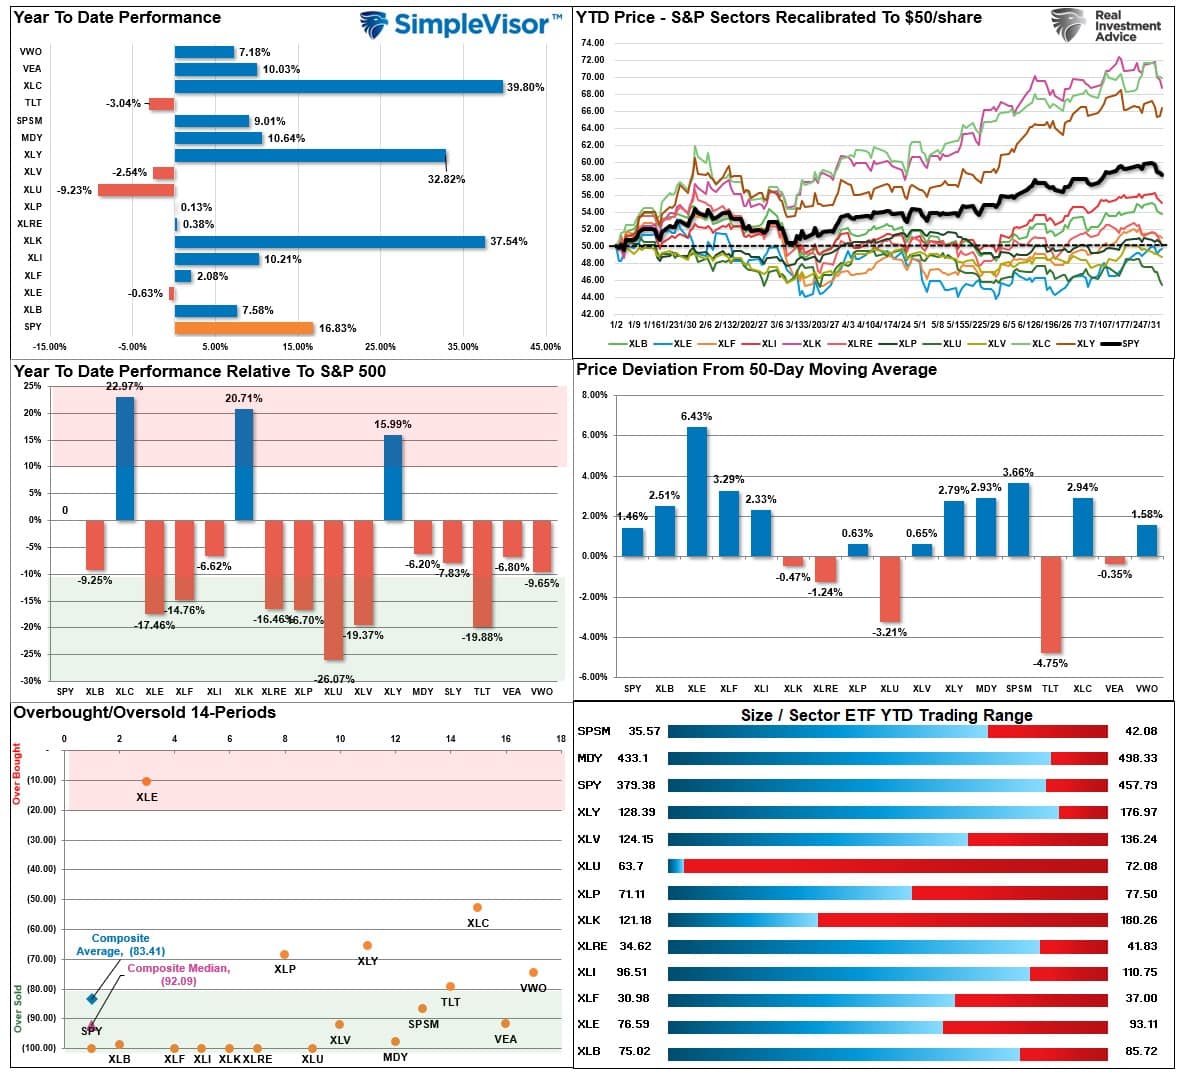
Relative Performance Analysis
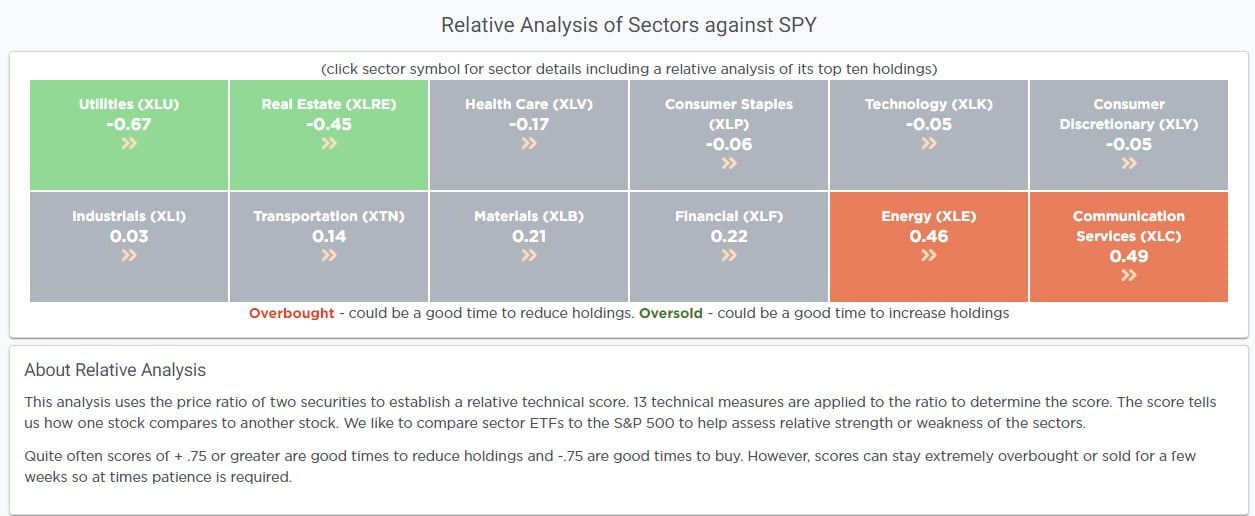
As noted last week:
“The market is due for a correction, but downside risk will be limited near term. Use pullbacks to support opportunistically to increase equity exposures.”
That correction started this past week and is not complete yet. However, many of the previous leading sectors are short-term oversold, and a bounce to challenge short-term resistance should not be surprising. Use bounces to rebalance exposures as needed and look for a correction to the 50-DMA as the most likely support.
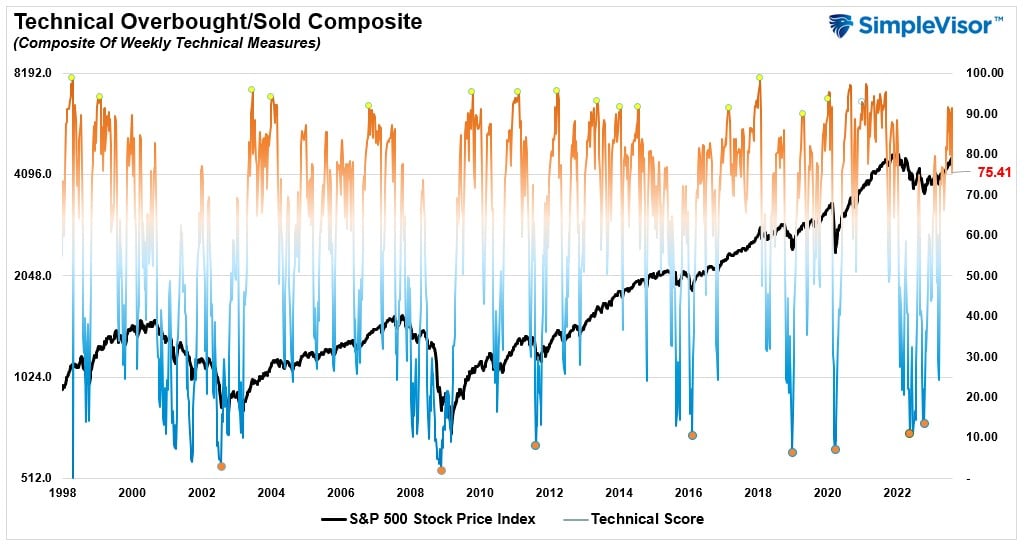
Technical Composite
The technical overbought/sold gauge comprises several price indicators (R.S.I., Williams %R, etc.), measured using “weekly” closing price data. Readings above “80” are considered overbought, and below “20” are oversold. The market peaks when those readings are 80 or above, suggesting prudent profit-taking and risk management. The best buying opportunities exist when those readings are 20 or below.
The current reading is 75.41 out of a possible 100.
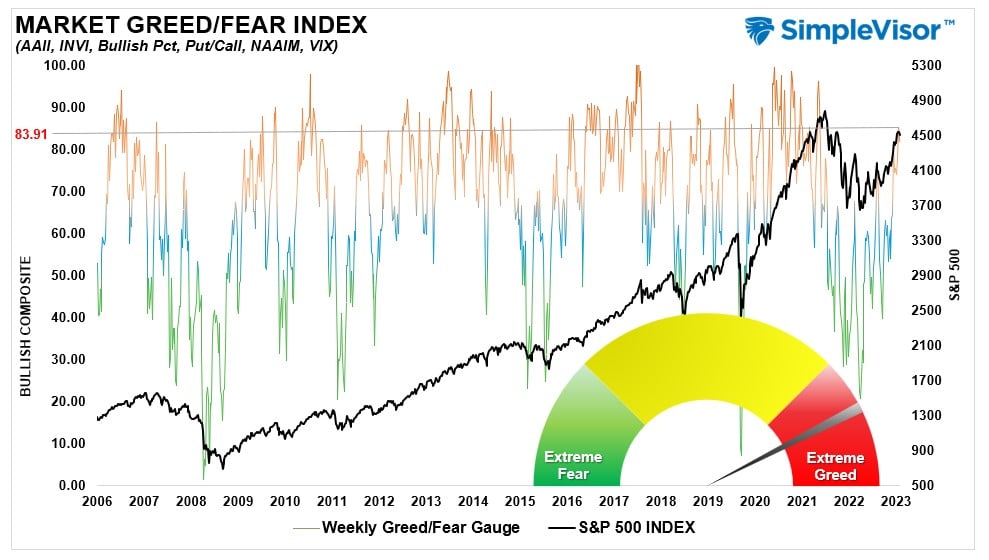
Portfolio Positioning “Fear / Greed” Gauge
The “Fear/Greed” gauge is how individual and professional investors are “positioning” themselves in the market based on their equity exposure. From a contrarian position, the higher the allocation to equities, the more likely the market is closer to a correction than not. The gauge uses weekly closing data.
NOTE: The Fear/Greed Index measures risk from 0 to 100. It is a rarity that it reaches levels above 90. The current reading is 83.91 out of a possible 100.
Relative Sector Analysis
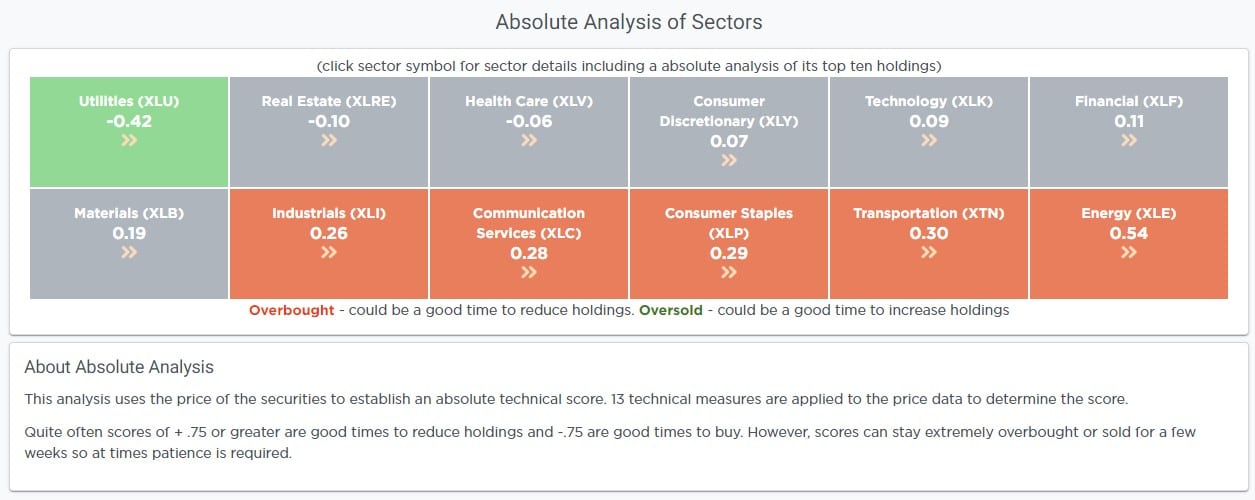
Absolute Sector Analysis
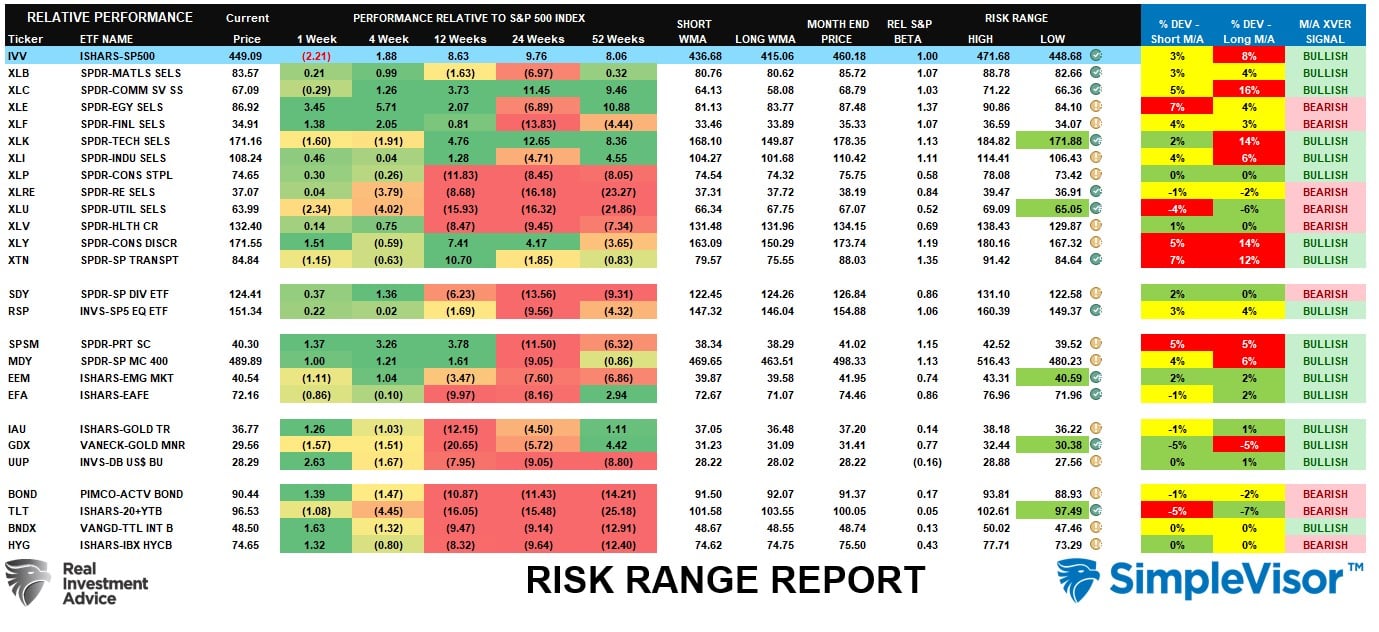
Sector Model Analysis & Risk Ranges
How To Read This Table
- The table compares the relative performance of each sector and market to the S&P 500 index.
- “MA XVER” (Moving Average Cross Over) is determined by the short-term weekly moving average crossing positively or negatively with the long-term weekly moving average.
- The risk range is a function of the month-end closing price and the “beta” of the sector or market. (Ranges reset on the 1st of each month)
- The table shows the price deviation above and below the weekly moving averages.
As noted last week,
“The market rallied nicely for July, pushing both the overall market and several sectors well outside of normal risk ranges. The increasing number of sectors deviating well above their respective short- and long-term moving averages increases the likelihood of correction to reverse some of those conditions in the next month or so.”
With bonds very oversold due to the knee-jerk reaction to the debt downgrade, the bond market is set for a nice reversal which may have started with Friday’s strong rally. We could get a little equity rally early next week, which should likely be used to rebalance equity exposures before a further correction to the 50-DMA.
Weekly SimpleVisor Stock Screens
We provide three stock screens each week from SimpleVisor.
This week we are searching for the Top 20:
- Relative Strength Stocks
- Momentum Stocks
- Fundamental & Technical Strength
(Click Images To Enlarge)
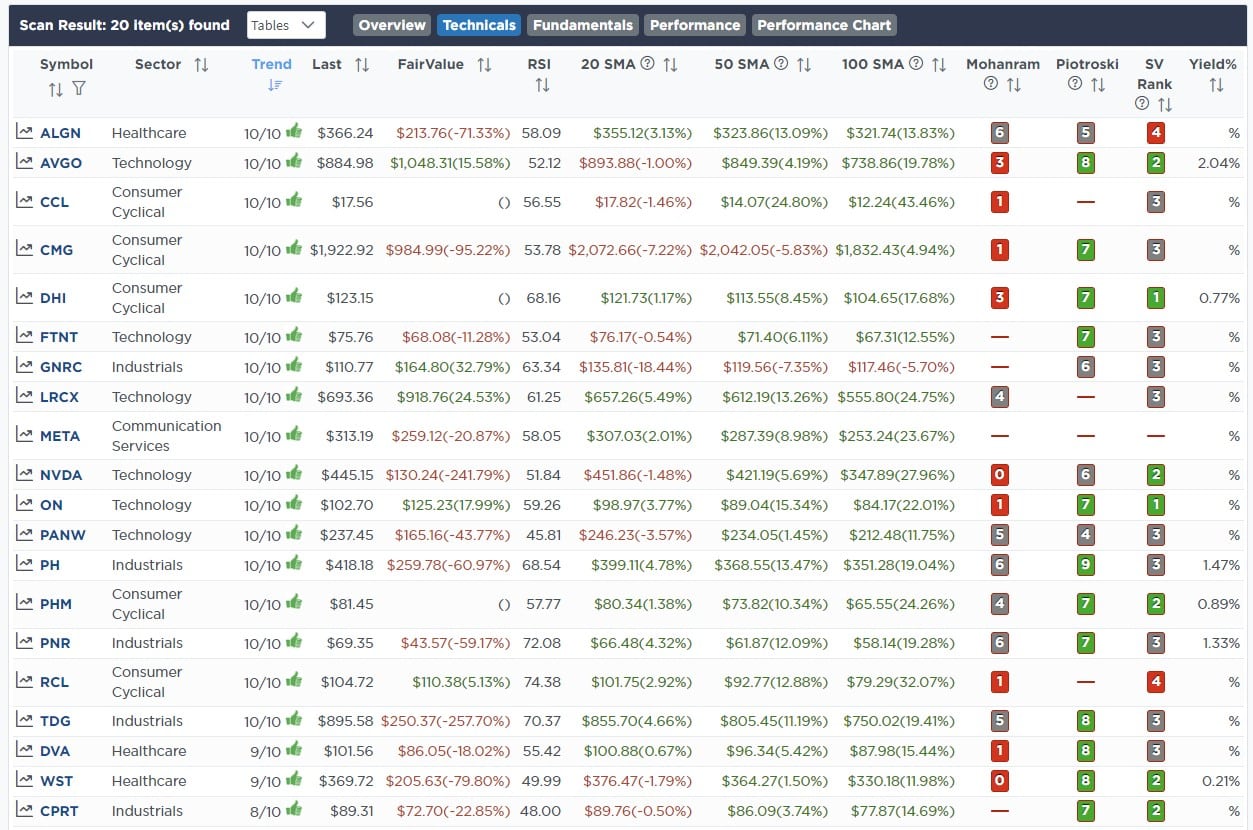
R.S.I. Screen
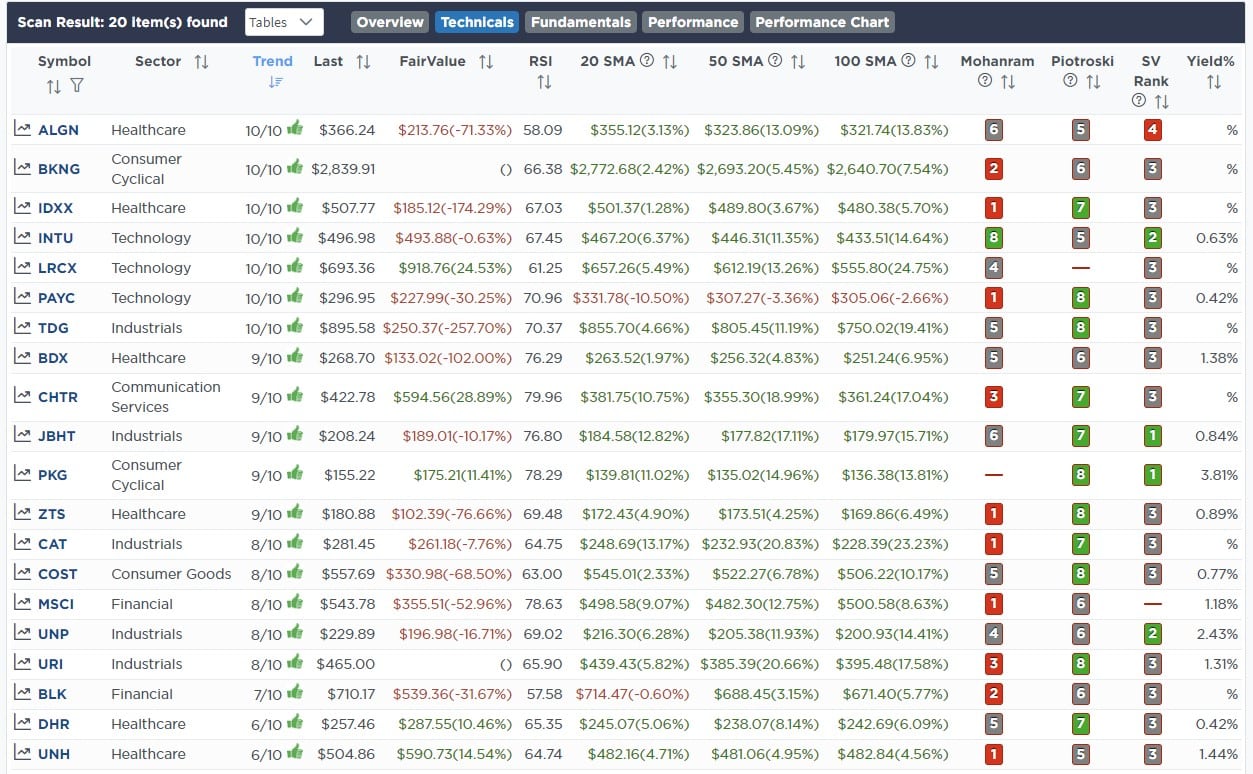
Momentum Screen
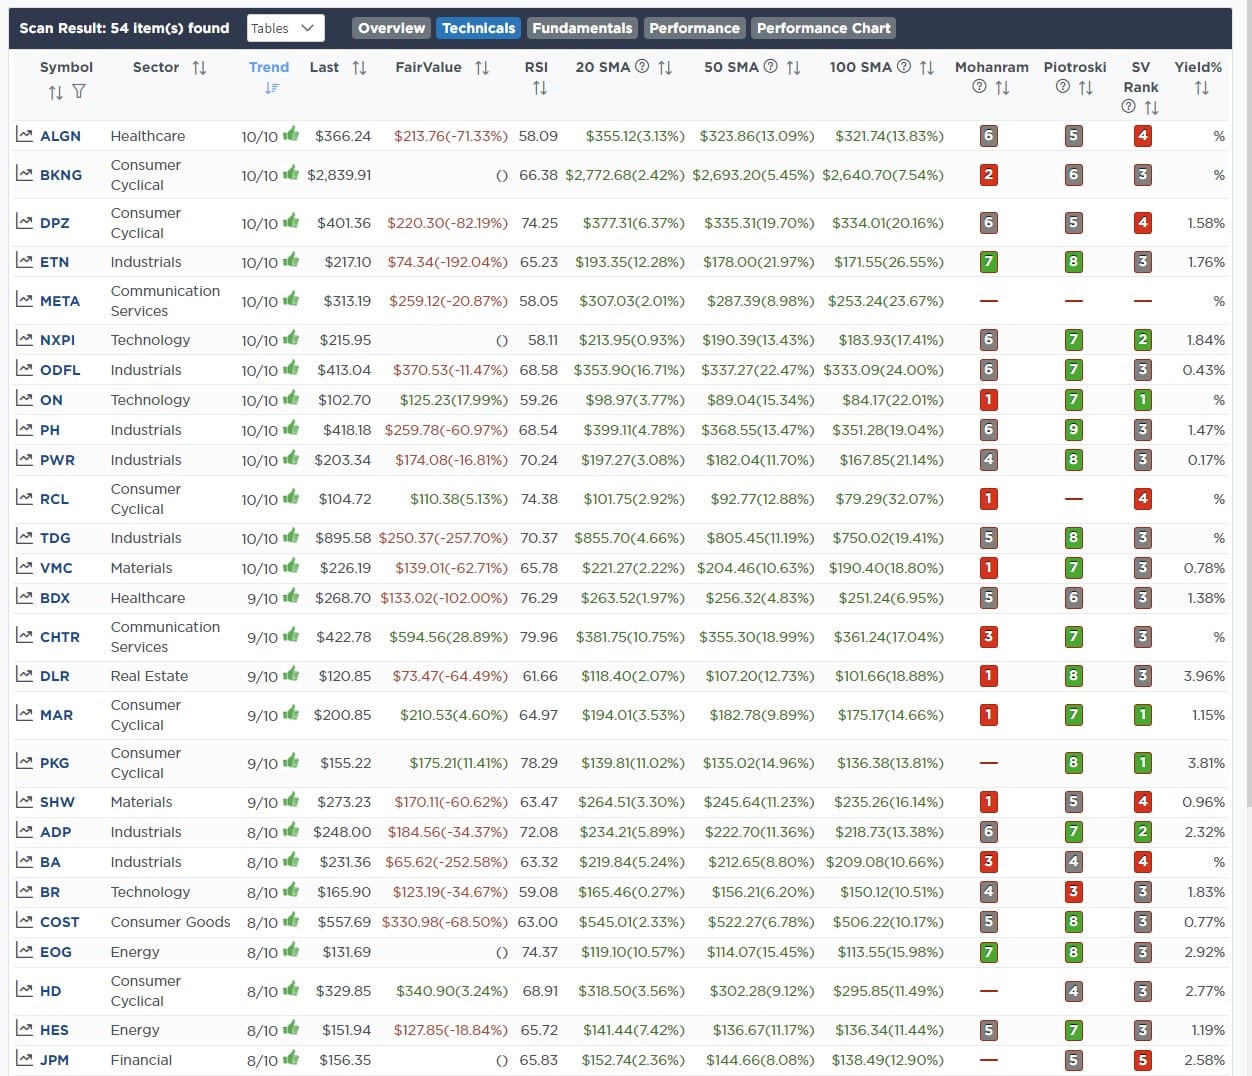
Fundamental & Technical Strength
SimpleVisor Portfolio Changes
We post all of our portfolio changes as they occur at SimpleVisor:
No Trades This Week

Lance Roberts, C.I.O.
Have a great week!

