
Inside This Week’s Bull Bear Report
- The Financial Conditions Are Tighter Than You Think
- How We Are Trading It
- Research Report – A Recession Is Coming, Or Is It?
- Youtube – Before The Bell
- Market Statistics
- Stock Screens
- Portfolio Trades This Week
Market Update & Review
While financial conditions remain tight, economic data supports the bullish narrative of “hope.” That narrative is “hope” the Fed will cease hiking rates. “Hope” that the economy will avoid a recession, and “hope” that earnings growth will accelerate into 2024.
On Friday, the much-anticipated employment report printed a 187,000 job increase, but notably, the unemployment rate rose to 3.8%. The increase in the unemployment rate encouraged the bulls as the goal of the Federal Reserve tightening the financial conditions in the economy was to slow employment and reduce economic demand. Notably, previous months showed fairly significant downward revisions.
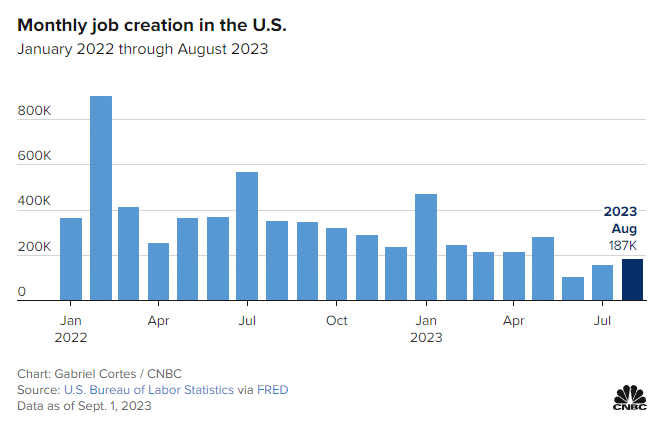
From a market perspective, that “weaker-than-expected” economic data adds to the “hope” that the Fed has tightened financial conditions enough. As we noted last week.
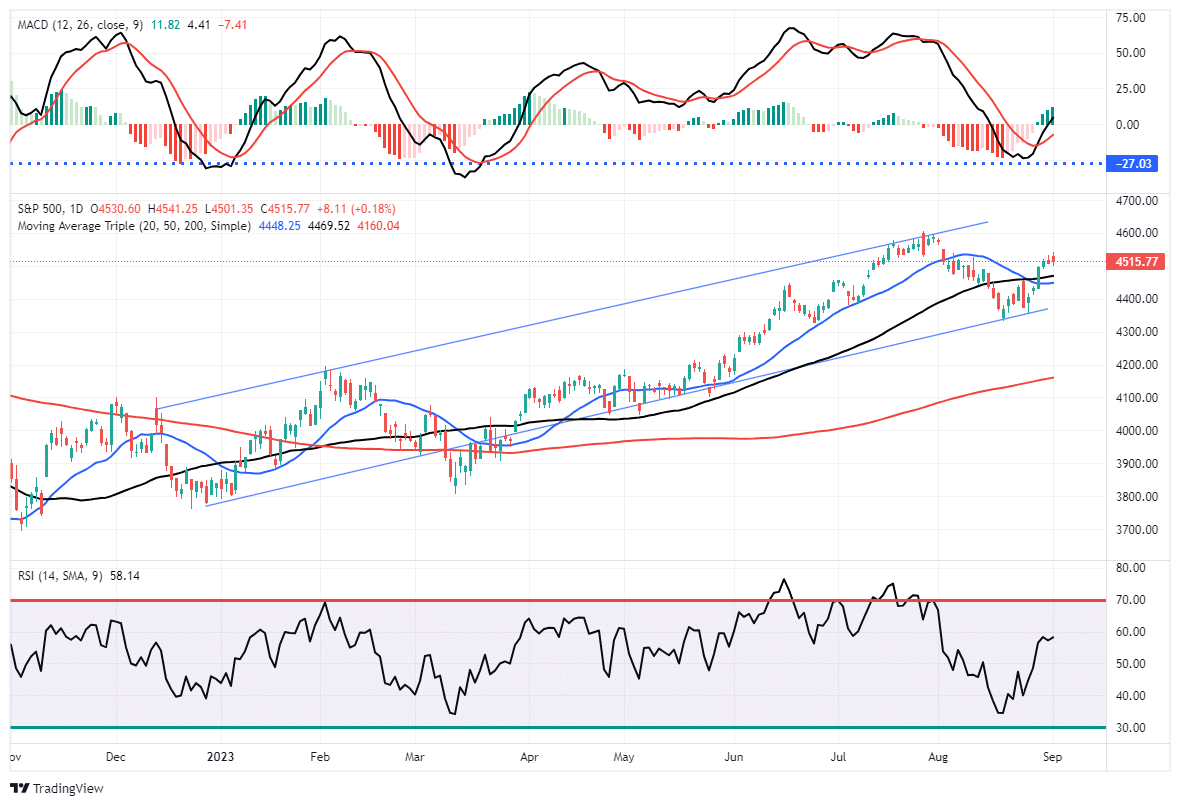
“A correction was needed, given the market was up more than 15% in the year’s first half. Nonetheless, the market continues to trade within its bullish trend and tested and rallied off that level on Friday for a second time. It also remains above critical support levels for now. With the MACD “sell signal” beginning to turn and the RSI index improving, we could see a further rally next week.“
This past week, the market did rally fairly strongly, taking out resistance levels at the downtrend from the July peak and the 50-DMA. The market is now in a technical position to retest the July peak and potentially set new highs for the year. Unsurprisingly, the advance is still dominated by “Mega-7” capitalization stocks.
This all aligns with our analysis over the last couple of weeks wherein:
“As long as nothing ‘breaks,’ when this corrective cycle completes, we expect a rally into year-end. Such will be a function of performance chasing as portfolio managers play catch up into year-end.”
That scenario is still playing out for now. While we could certainly see a pickup in volatility during September, pullbacks to support should still be used to add to equity exposure as needed. Use the current rally to rebalance portfolios, take profits, and neutralize risks accordingly.
With that said, there are certainly risks to remain mindful of. The risk of a recession from tighter financial conditions is one of them.
Need Help With Your Investing Strategy?
Are you looking for complete financial, insurance, and estate planning? Need a risk-managed portfolio management strategy to grow and protect your savings? Whatever your needs are, we are here to help.

Bad News Is Good News Again
A sharp drop in Job Openings, Consumer Confidence, and the Shiller Home Price Index on Tuesday sparked a strong rally in the market and a plunge in interest rates. Why was such bad news seen as good news for stocks? As Bloomberg noted:
“Wall Street traders pushed the stock market higher, while bond yields retreated after economic reports bolstered speculation the Federal Reserve will be able to pause its interest-rate hikes in September.”
In other words, bad economic news was good news for stocks as it suggests the Fed may be closer to the end of rate hikes. However, what traders overlooked is that bad economic news is not necessarily a good indication of more substantial earnings growth in the future.
In other words, it is a bit of a dichotomy as to why stocks would rally strongly on the back of weaker economic data. Yes, weaker economic data may indeed suggest the Fed should not raise rates further, but such does not mean they will necessarily immediately revert to more accommodative policies. But, as shown, when the Fed reverts to cutting rates and increasing monetary supports, it has not initially supported higher asset prices. Such is because the Fed is acting to counteract the impact of a recessionary and deflationary force on the economy.
Investors have historically bought the market during the rate-hiking cycle, believing the economy was strong enough to withstand higher rates. However, investors did well to sell the first to last rate cuts.
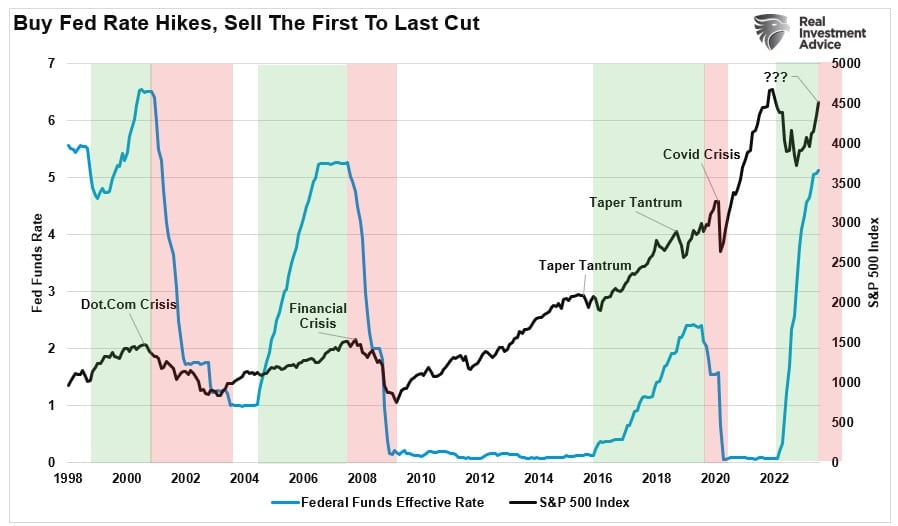
While the market did sell-off initially in 2022, the recovery from the October lows, as the Fed was hiking rates, was in line with previous market reactions. The sentiment remains similar, as economists and analysts are raising estimates for stronger growth, lower inflation, and rising earnings heading into 2024.
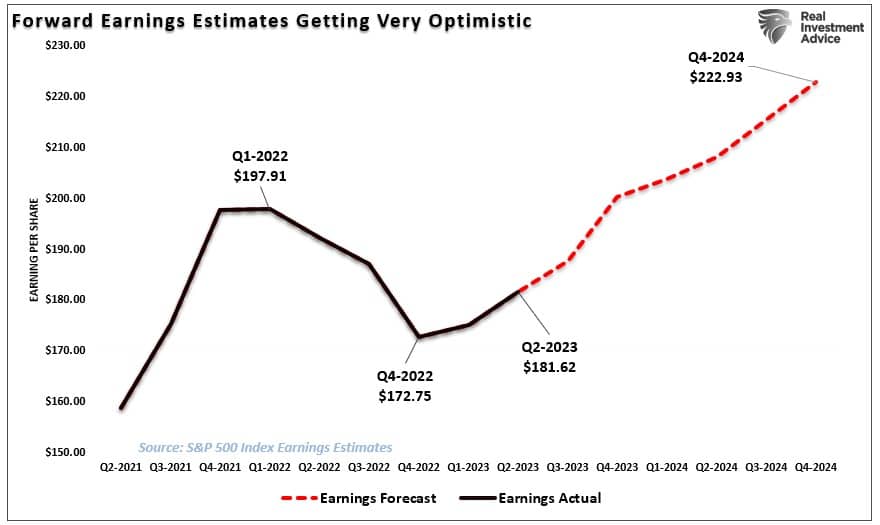
The risk to that view is that things do not work out as optimistically as planned.
Financial Conditions Are Tighter Than You Think
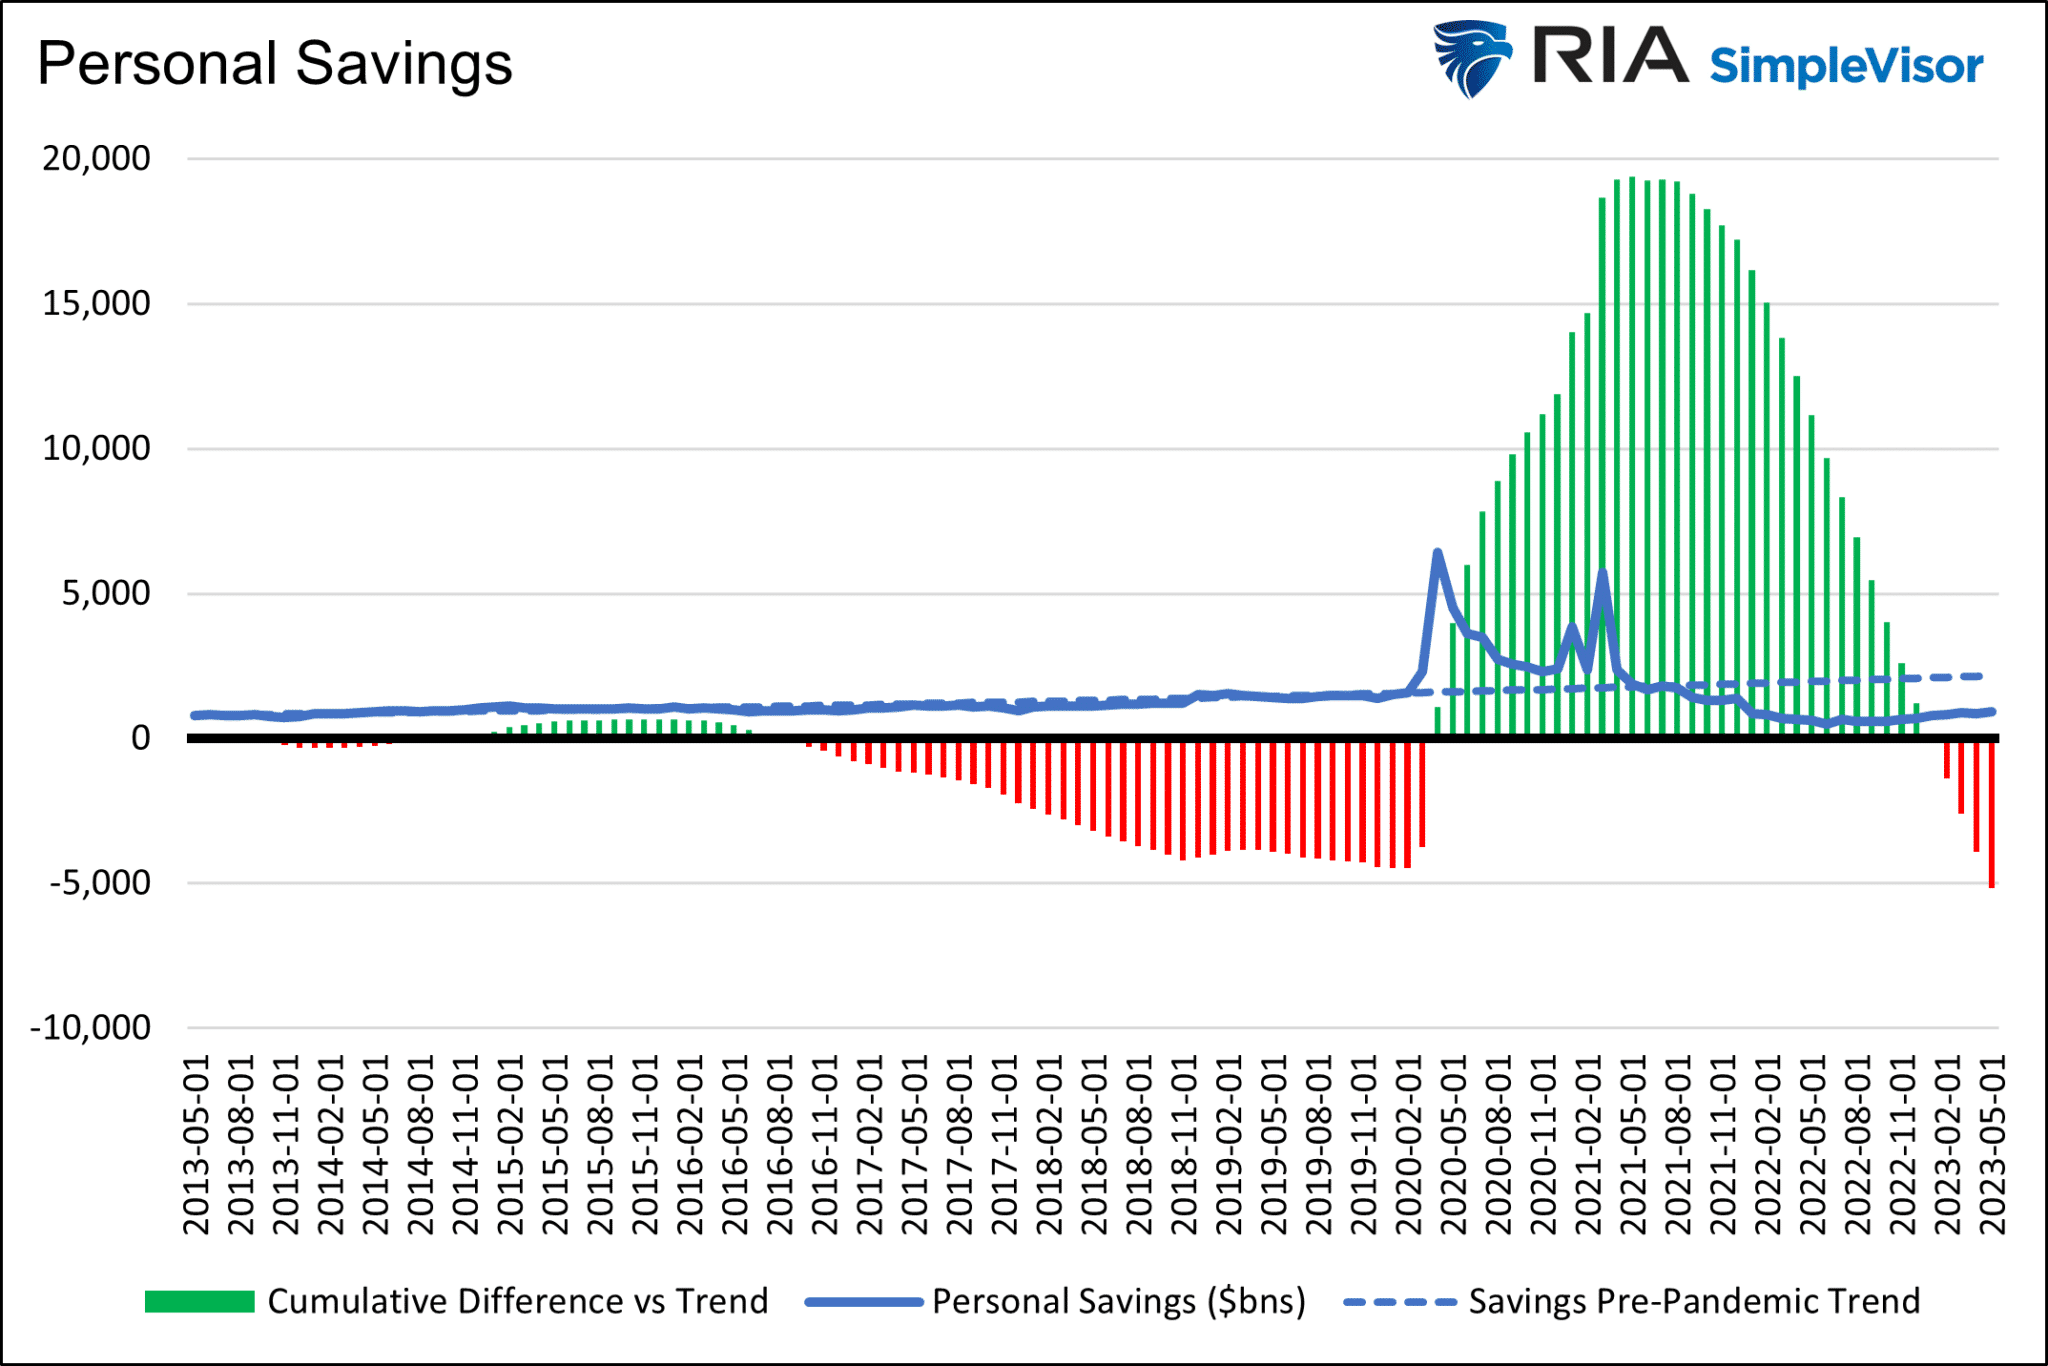
After reviewing the earnings reports from the major retailers, we are beginning to see the impact of higher costs, waning savings, and increased borrowing rates weighing on consumers. As noted in last week’s newsletter:
“The following graph shows the jump in savings commensurate with stimulus. The chart highlights that consumers saved less than average after the two giant government stimulus checks were distributed and drew down on elevated savings to consume. However, and this is important, cumulative personal savings are now below the longer-term trend.”
Given that GDP, with the latest read revised lower this past week, is nearly 70% comprised of consumption, it is not surprising the consumer is beginning to buckle under the weight of higher rates. As shown below, financial conditions, measured by the difference between the 10-year Treasury yield and the “neutral rate,” clearly reside in restrictive territory. Such has previously always preceded an economic downturn since 1980.
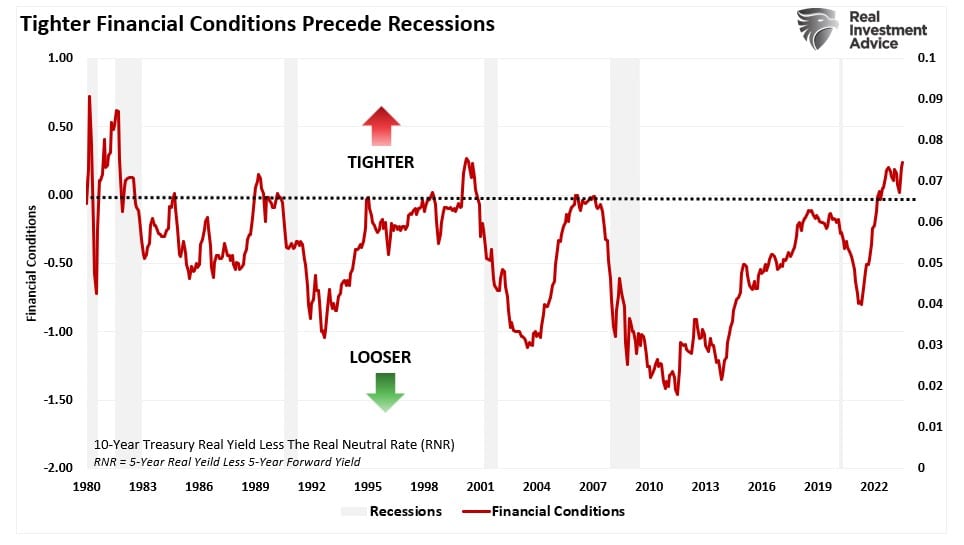
With financial conditions much tighter than many believe, the lag effect of tighter monetary policy remains the biggest threat to investors as we head into 2024. Such is particularly the case with Small and Mid-Capitalization companies, which do not have the liquidity to survive an economic downturn while having to refinance debt at substantially higher rates.
Despite the extremely crowded trade, we continue to see professional investors crowd into the Mega-Capitalization names at a record clip.
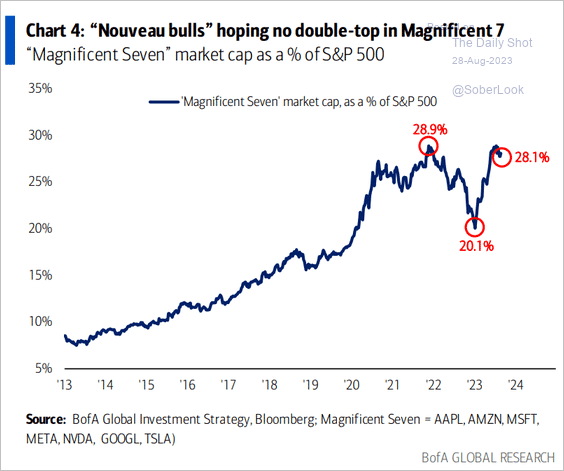
The difference in a market with tight financial conditions comes down to liquidity.
Hiding In The Liquidity
My colleague Albert Edwards and his associate Andrew Lapthorne have recently focused on the dichotomy of the decline in U.S. corporate interest payments despite the rise in interest rates. The premise was that the decrease in interest payments may contribute to the delay in the onset of a recession. As Albert noted this past week:
“History shows that, to the (limited) extent economists do actually predict a recession, its tardiness usually means they give up waiting just at the point it arrives (the bus stop dilemma). The resilience of corporate profits has been a key reason this recession has been delayed – especially as companies in aggregate, are now a net beneficiary of higher rates.“
However, I agree with his conclusion that there may be more to this story.
“Yet beneath the mega-caps the vast bulk of companies are in big trouble.“
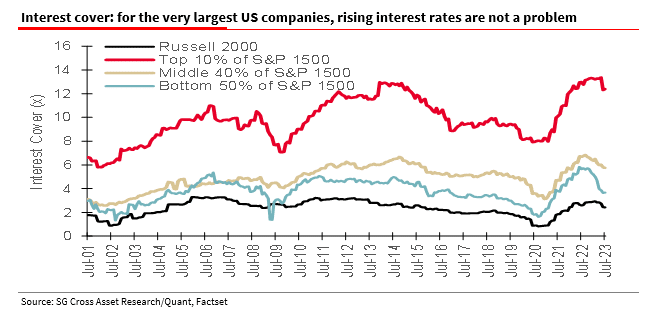
We remain pretty vocal that small and mid-capitalization companies have the least ability to weather that storm if and when a recession sets in. There are several reasons for this. First, as noted by Andrew, they don’t have the cash to service higher borrowing costs compared to their mega-cap brethren.
“The largest 10% of companies represent 62% of the overall non-financial market cap of the S&P 1500, so from a market perspective, it would appear that interest rates are not yet affecting the balance-sheet stress of the market overall. But lower down the size scale, things are tough and getting tougher. Interest coverage at the bottom 50% of S&P 1500 companies and the smallest quoted companies (as listed in the Russell 2000 index) falling sharply from low levels.”
Secondly, these smaller companies don’t have access to the capital markets as easily as larger capitalization companies and do not have the massive cash balances held by the mega-cap companies.
“It stands to reason that smaller quoted companies in the Russell 2000 index, as well as unquoted companies, don’t have as much access to corporate bond issuance so have been unable to lock into the near-zero long-dated fixed borrowings that the larger companies have.”
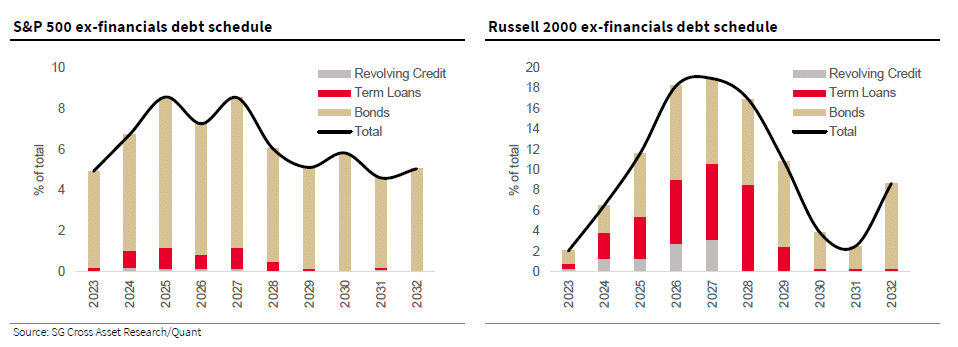
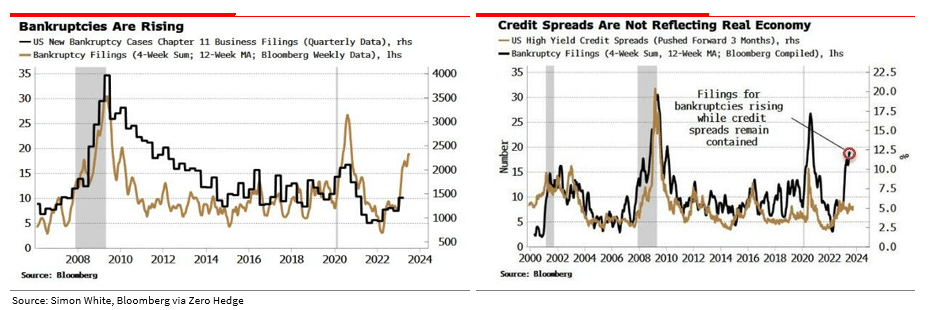
As that debt wall of term loans hits over the next few years, higher borrowing costs will raise the risk of defaults and bankruptcies. While we may not be in a recession yet, it doesn’t mean it can’t happen. As noted by Simon White via Bloomberg, tightening financial conditions have seen corporate bankruptcies rise by 71% since last year. If financial conditions are still elevated over the next few years, that bankruptcy risk increases markedly.
As Albert concludes:
“Contrary to what the mega-cap valuations might suggest, smaller companies remain the beating heart of the US economy – maybe the mega-caps are more like vampires sucking the lifeblood out of other companies. It seems the lights are going out all over the US smaller-cap corporate sector.
They weren’t able to lock into long-term loans at almost zero interest rates and pile it high in the money markets at variable rates. Ultimately the pain for US small- and mid-cap companies will trigger the recession most economists are now giving up on, and hey, guess what? I think we’ll soon find out that even the large- and mega-cap stocks might not be immune to the indirect recessionary impact of higher interest rates after all.“
Portfolio managers must chase the market higher or potentially suffer career risk. Therefore, the easiest place to allocate cash is the mega-capitalization companies with low risk of bankruptcy or default and extremely high liquidity.
I agree with Albert that current exuberance in the markets and the belief of a “no landing” scenario are likely vastly overblown. Substantially tighter financial conditions remain the most significant risk to the markets. Therefore, when the Fed begins cutting rates to fix what it broke, we will see the rotation to safety occurring simultaneously.
How We Are Trading It
Heading into this past week, we had previously stated that we were using the correction from the July peak to”
“…opportunistically to increase equity exposure overall and rebalance portfolio sectors closer to index weightings. We still expect a year-end push as portfolio managers chase performance to close the year. However, something else can always happen, so we remain risk-aware.”
With portfolios near full target equity exposure, we will use the current rally to rebalance portfolio risks as needed. As in this week’s commentary, we are certainly not oblivious to the impact of tighter financial conditions. However, for now, traders are offsetting those risks with the “hope” the Fed will reverse policy sooner rather than later. Therefore, we must pay attention to what the market is doing in the short term but keep a vigilant watch on overall market action as we head into year-end.
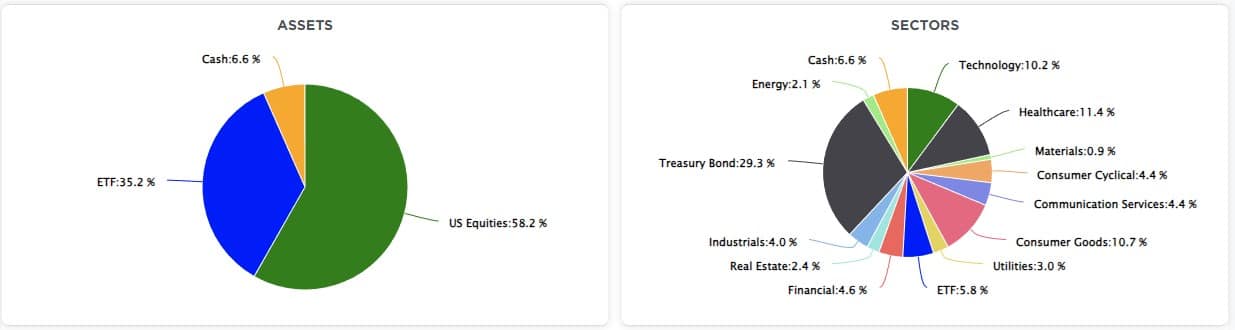
Our current allocation remains virtually the same heading into next week. However, next week, we will be swapping the majority of our portfolio allocations in Treasury Bond ETFs into a similar duration Treasury Bond. This will provide a guaranteed yield to the maturity, maintain portfolio liquidity, and reduce the portfolio’s expenses overall.
Have a great Labor Day weekend.
See you next week.
Research Report

Subscribe To “Before The Bell” For Daily Trading Updates
We have set up a separate channel JUST for our short daily market updates. Please subscribe to THIS CHANNEL to receive daily notifications before the market opens.
Click Here And Then Click The SUBSCRIBE Button
Subscribe To Our YouTube Channel To Get Notified Of All Our Videos
Bull Bear Report Market Statistics & Screens

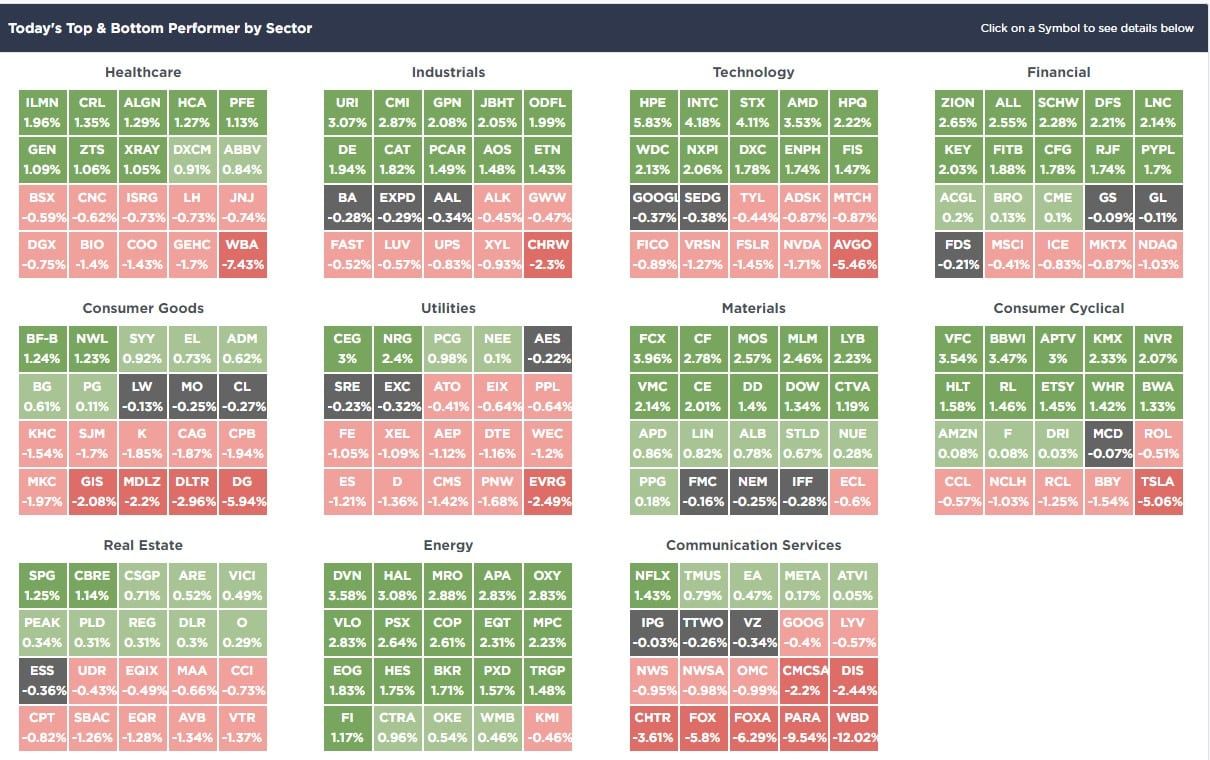
SimpleVisor Top & Bottom Performers By Sector
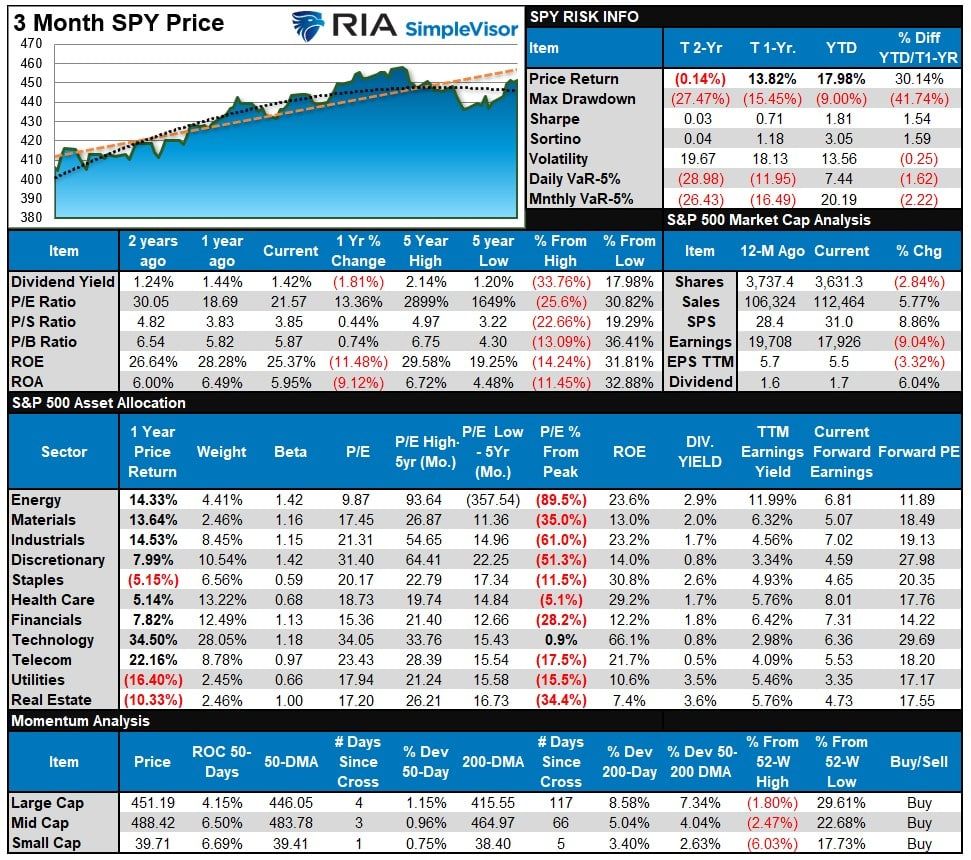
S&P 500 Weekly Tear Sheet
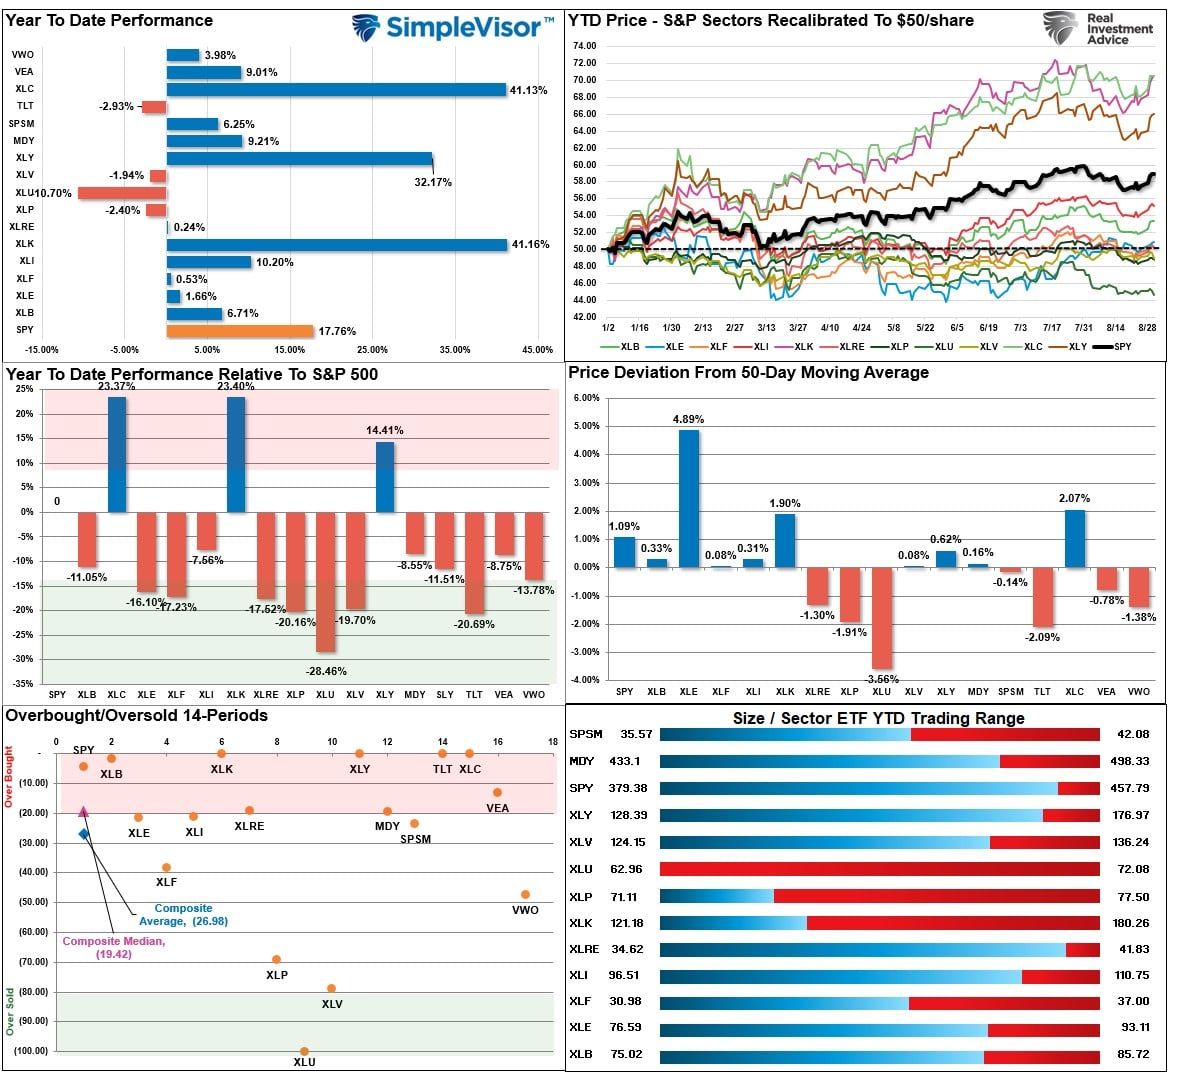
Relative Performance Analysis
As noted last week:
“While the market rallied on Friday following Powell’s speech, most markets and sectors remain more oversold than not, suggesting a likely continuation of the rally this week. Small and Mid-Cap markets remain the most oversold, with Bonds and Technology stocks midway through a reversal. Maintain positioning for now. We will look to rebalance exposures once we get back to more overbought short-term conditions.”
With most of the major markets and sectors moving back into more overbought areas, a further rally will become more challenging short term. Look for pullbacks to support and a reversal of the more overbought conditions to add to portfolio positions. With the MACD buy signal in place, we want to increase exposure; however, we can make those increases more opportunistically.
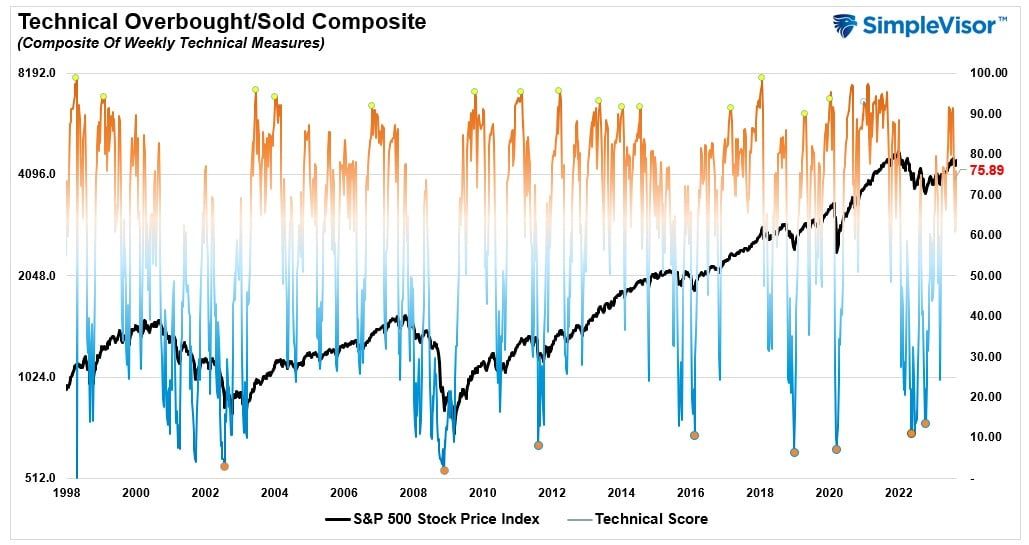
Technical Composite
The technical overbought/sold gauge comprises several price indicators (R.S.I., Williams %R, etc.), measured using “weekly” closing price data. Readings above “80” are considered overbought, and below “20” are oversold. The market peaks when those readings are 80 or above, suggesting prudent profit-taking and risk management. The best buying opportunities exist when those readings are 20 or below.
The current reading is 75.89 out of a possible 100.
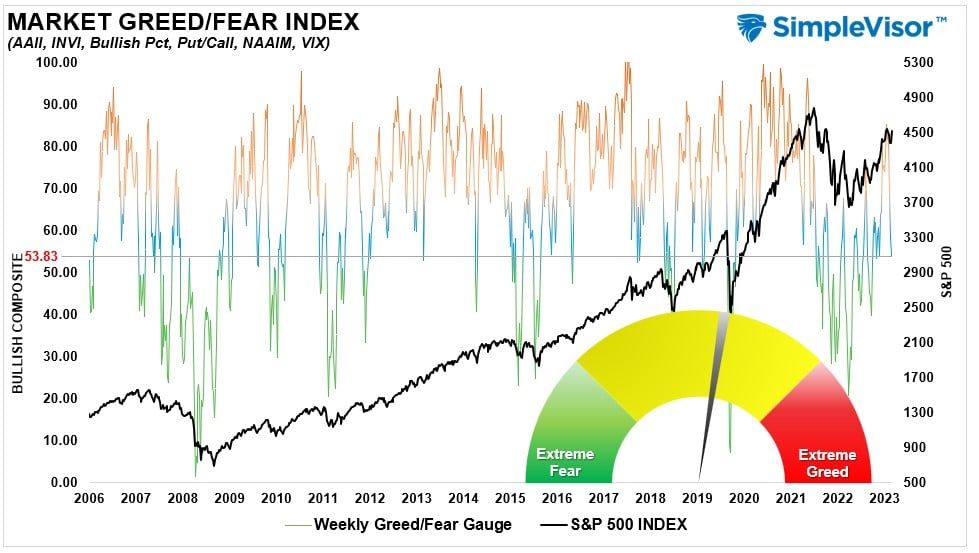
Portfolio Positioning “Fear / Greed” Gauge
The “Fear/Greed” gauge is how individual and professional investors are “positioning” themselves in the market based on their equity exposure. From a contrarian position, the higher the allocation to equities, the more likely the market is closer to a correction than not. The gauge uses weekly closing data.
NOTE: The Fear/Greed Index measures risk from 0 to 100. It is a rarity that it reaches levels above 90. The current reading is 53.83 out of a possible 100.
Relative Sector Analysis
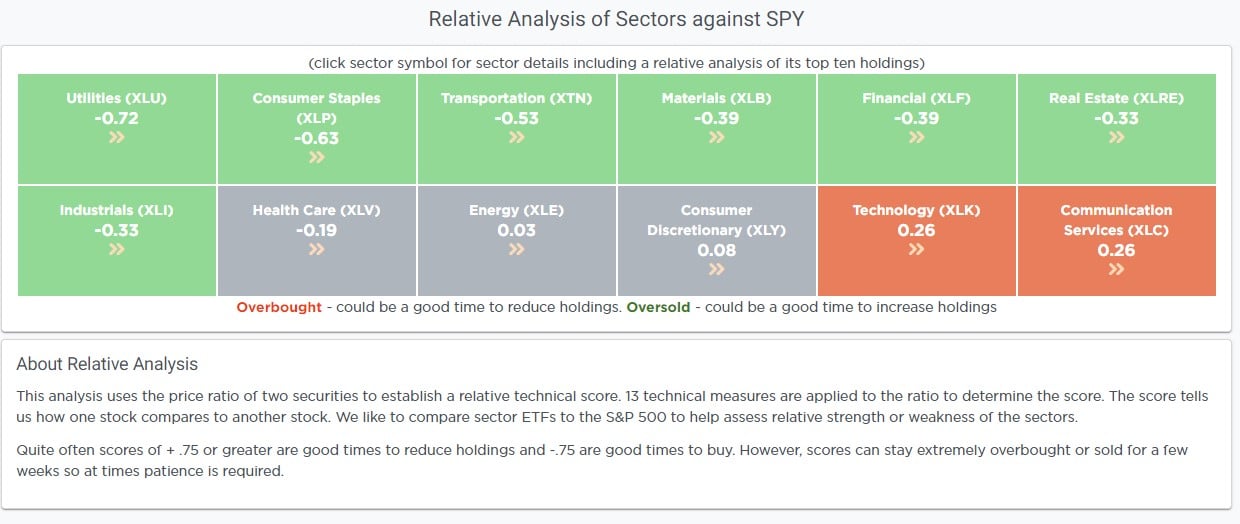
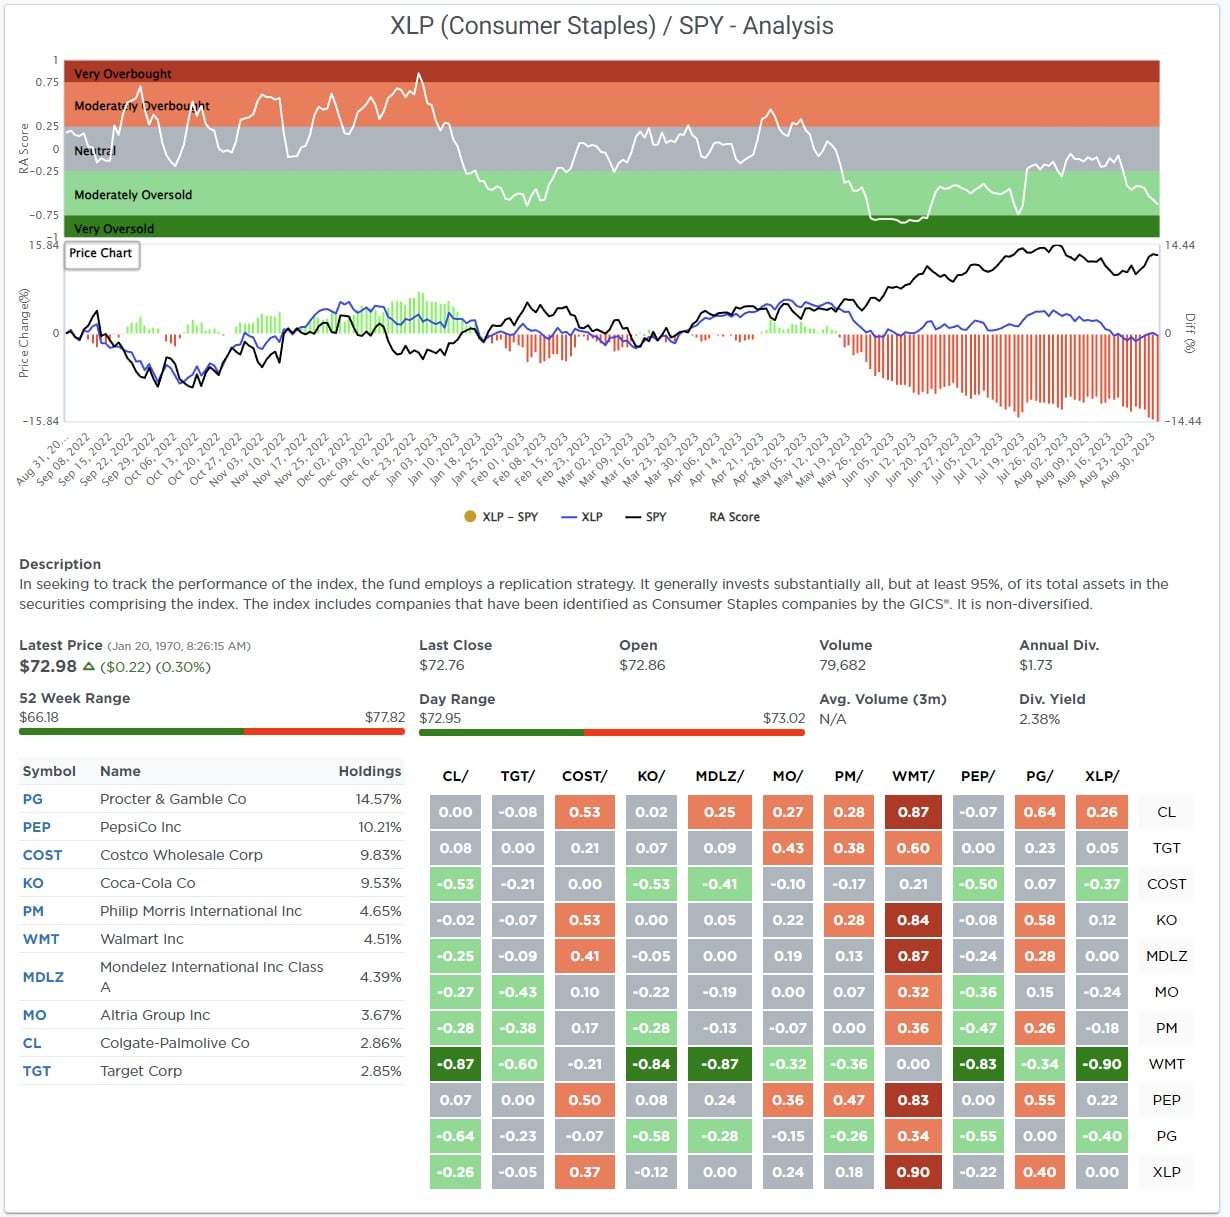
Most Oversold Sector Analysis
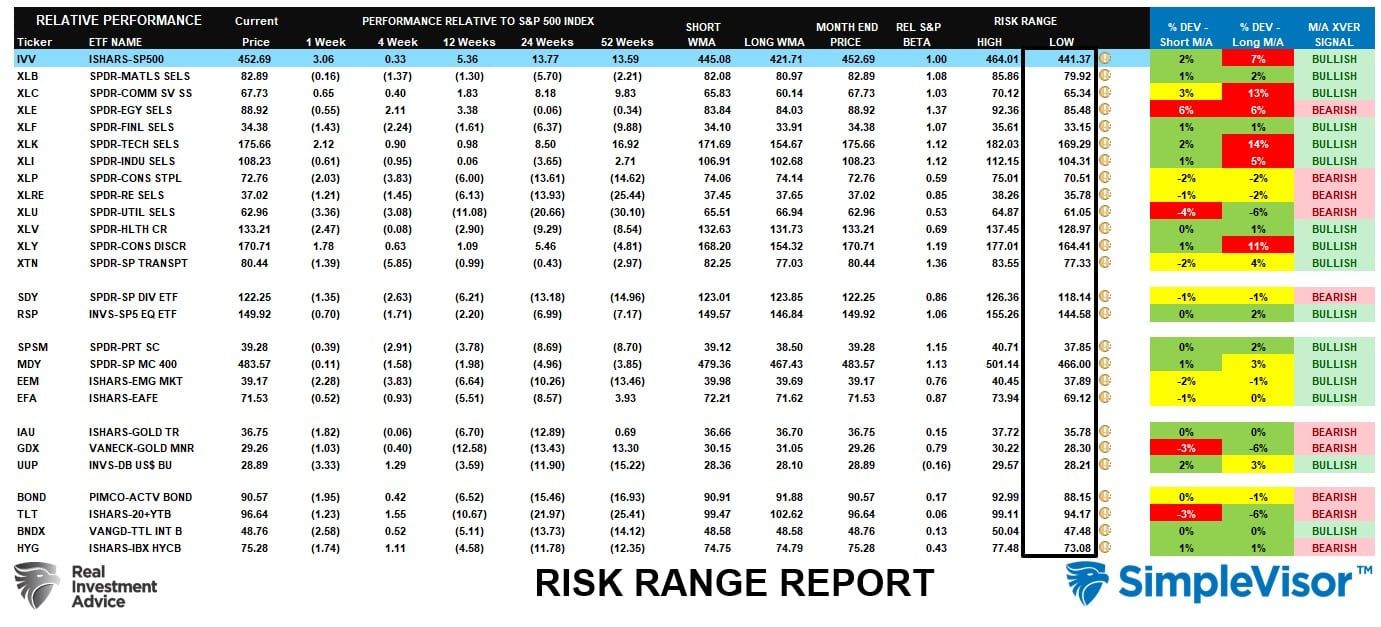
Sector Model Analysis & Risk Ranges
How To Read This Table
- The table compares the relative performance of each sector and market to the S&P 500 index.
- “MA XVER” (Moving Average Crossover) is determined by the short-term weekly moving average crossing positively or negatively with the long-term weekly moving average.
- The risk range is a function of the month-end closing price and the “beta” of the sector or market. (Ranges reset on the 1st of each month)
- The table shows the price deviation above and below the weekly moving averages.
The risk/range report has reset for the beginning of the month. Data will resume next week.
Weekly SimpleVisor Stock Screens
We provide three stock screens each week from SimpleVisor.
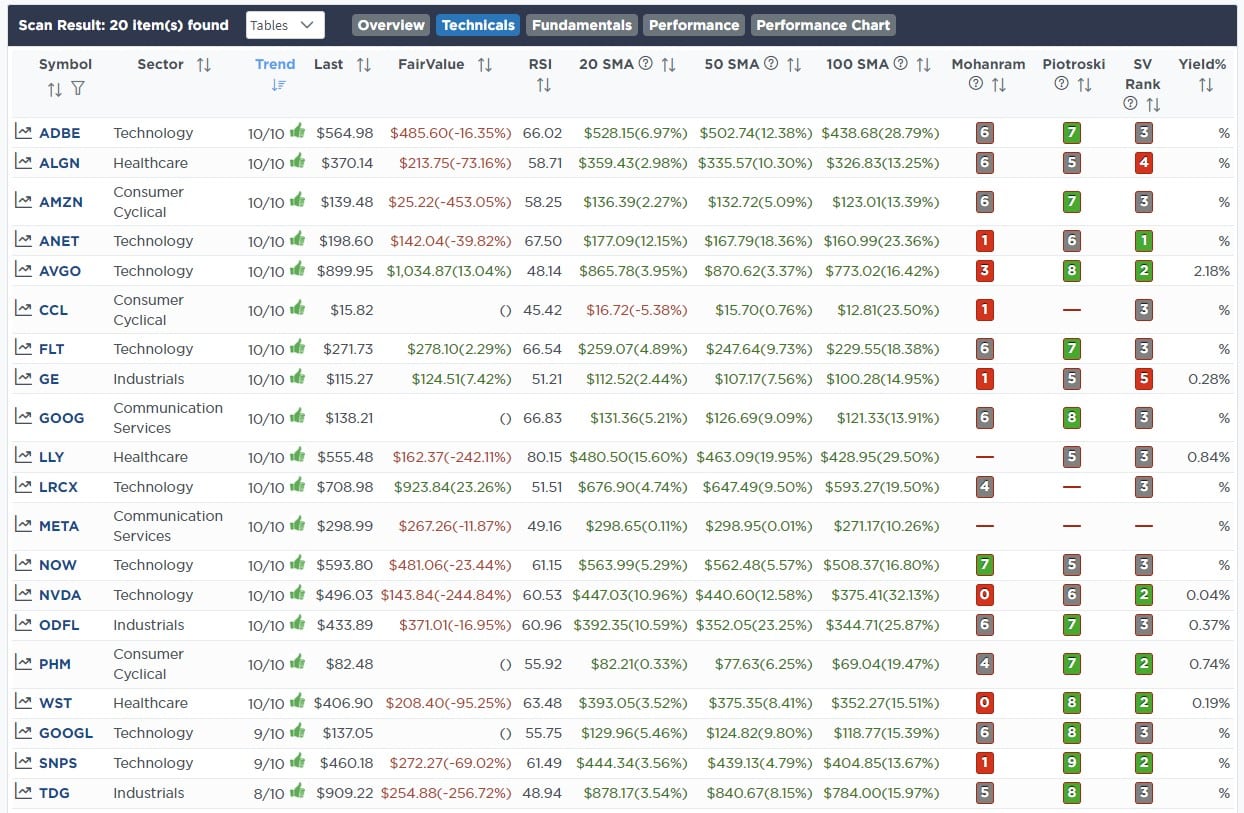
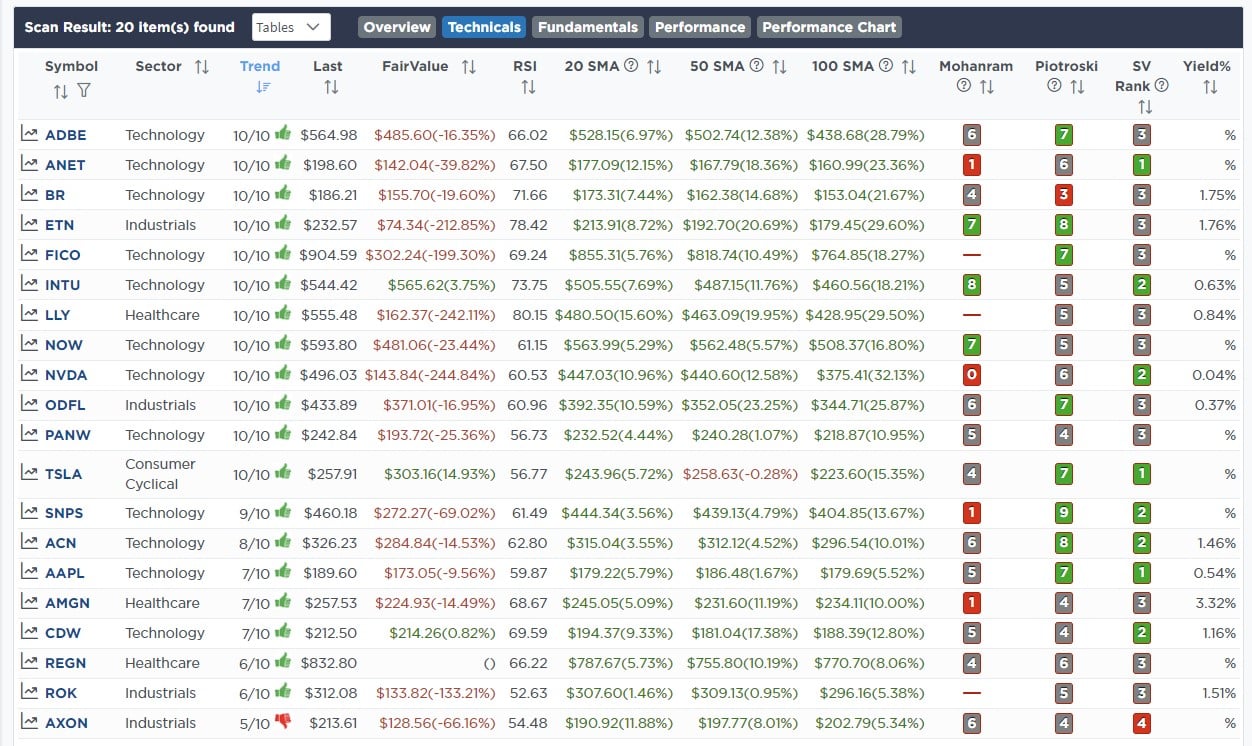
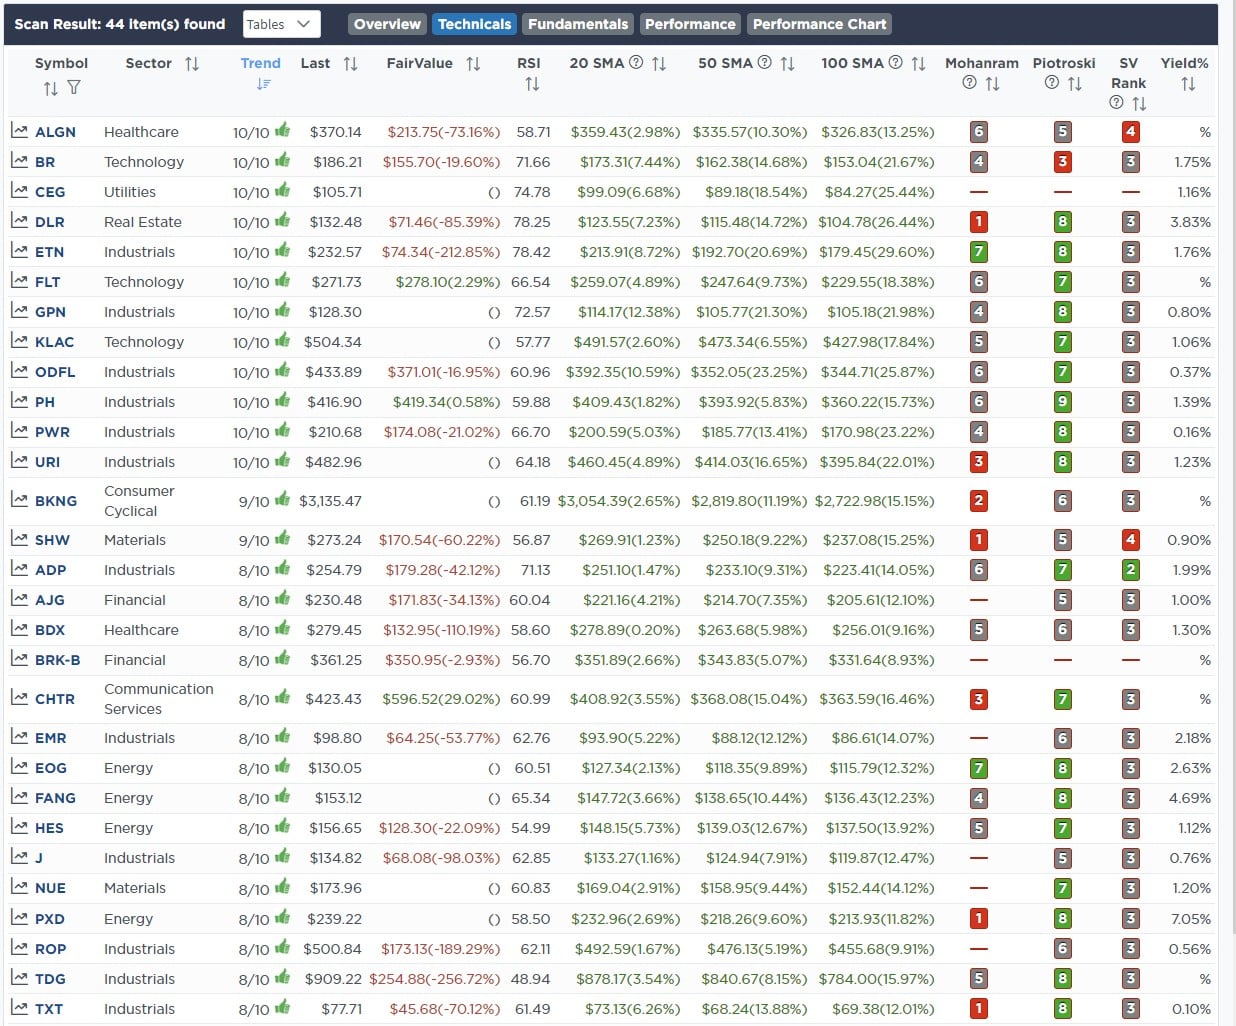
This week, we are searching for the Top 20:
- Relative Strength Stocks
- Momentum Stocks
- Fundamental & Technical Strength
(Click Images To Enlarge)
R.S.I. Screen
Momentum Screen
Fundamental & Technical Strength
SimpleVisor Portfolio Changes
We post all of our portfolio changes as they occur at SimpleVisor:
August 28th
“After the recent selloff in Nvidia (NVDA), we are restarting a position after selling our stake earlier this year. As shown in the chart below, the consolidation over the last couple of months worked off the more egregious overbought readings. With NVDA holding support at the 20- and 50-DMA and the MACD on a reasonable “buy signal,” we are building a starter position. Ideally, a pullback that holds support would allow us to add to the position further. The addition brings our technology weighting in both models closer to the benchmark. Such should allow portfolios to track the index into the end of the year more closely.”
Equity Model
- Add 1% of the portfolio to Nvidia (NVDA).
ETF Model
- Add 1% of the portfolio to the iShares Technology ETF (XLK)
August 31st
“This morning, we added to our existing regional bank holdings in our portfolio after the recent pullback. With the expectation that rates will decline in 2024, banks should benefit by easing stress on their existing collateral. In the equity model, we are increasing our stake in both PNC Bank (PNC) and Truist Financial (TFC) to 2% and adding 1% to our holding of the Banking ETF (KBE) in the ETF Model.”
Equity Model
- Increase both PNC Bank (PNC) and Truist Financial (TFC) to 2% of the portfolio each.
ETF Model
- Add 1% to the Banking ETF (KBE)

Lance Roberts, C.I.O.
Have a great week!

