
Inside This Week’s Bull Bear Report
- Stock Markets Are Leading A Little Too Much
- How We Are Trading It
- Research Report – Retirement Savers Are Piling Into Stocks
- Youtube – Before The Bell
- Market Statistics
- Stock Screens
- Portfolio Trades This Week
Market Review And Update
Last week’s newsletter discussed the ongoing bullish trend of the market. To wit:
“As we have discussed, there is little reason to be bearish on the market. The ongoing advance remains within a trend channel from the October 2023 lows. We continue to recommend maintaining exposure to equity risk, but be aware that the current advance is getting rather long in terms of time. The market will have a correction at some point over the next few months, which will provide a better entry point for increasing exposure.”
We have discussed the need for a market correction over the last few weeks. On Wednesday, the FOMC statement sent the stock lower as Jerome Powell eliminated the possibility of a rate cut by March. However, a stellar employment report on Friday, which would suggest the Fed stays on hold longer, sent the market surging to all-time highs.
While the media tried to apply several reasons why the market was higher, bullish momentum is intact. The selloff on Wednesday, as shown, tested the rising trend channel and opened a window for buyers to step in. There are only small windows of opportunity to increase equity exposure during substantial, bullish advances. However, as is always the case, the current “bullish stampede” will end, and a reversal will occur.

As shown above, the current bullish stampede is very similar to what we saw from March to July last year. At that time, it was the chase for “A.I.” that was driving the market while the majority of stocks dragged. The market remained overbought, trading in a defined trend channel as prices advanced. Then, the markets corrected by 10% into October, which is typical for any given year.
Today, we again see that same “unstoppable advance” with the same bifurcation in the market. While the “Magnificent 7” stocks again drive the markets, another 5-10% correction over the next several months should be no surprise. Such is particularly the case as we approach the upcoming Presidential election, where market participants may want to reduce exposure to offset potential election risks.

There is little reason to be overly concerned with the market for now. However, there is little doubt that the market is detached from the economic underpinnings.
Such is our discussion for this week.
Need Help With Your Investing Strategy?
Are you looking for complete financial, insurance, and estate planning? Need a risk-managed portfolio management strategy to grow and protect your savings? Whatever your needs are, we are here to help.

Stock Markets Are Leading A Little Too Much
A Wall Street axiom states that the stock markets lead the economy by about six months. Such makes sense, given that investors are parsing earnings data and see improvements on a real-time basis that lagging economic data may not reflect. However, as discussed in “Stock Markets Are Detached From Everything,” the current environment is slightly different. To wit:
“While stock prices can deviate from immediate activity, reversions to actual economic growth eventually occur. Such is because corporate earnings are a function of consumptive spending, corporate investments, imports, and exports. The market disconnect from underlying economic activity is due to psychology. Such is particularly the case over the last decade, as successive rounds of monetary interventions led investors to believe ‘this time is different.'”
While not as precise, a correlation between economic activity and the rise and fall of equity prices does remain. For example, in 2000 and again in 2008, corporate earnings contracted by 54% and 88%, respectively, as economic growth declined. Such was despite calls for never-ending earnings growth before both previous contractions.
As earnings disappointed, stock prices adjusted by nearly 50% to realign valuations with weaker-than-expected current earnings and slower future earnings growth. So, while stock markets are once again detached from reality, looking at past earnings contractions suggests such deviations are not sustainable.
The chart below is our Consumer Confidence Composite index, an average of the University of Michigan and Conference Board measures. Again, there is a decent correlation between confidence and the markets. While confidence has improved, as expected with the market rally, the exuberance of the stock markets remains quite detached from the economy’s primary driver – the consumer.
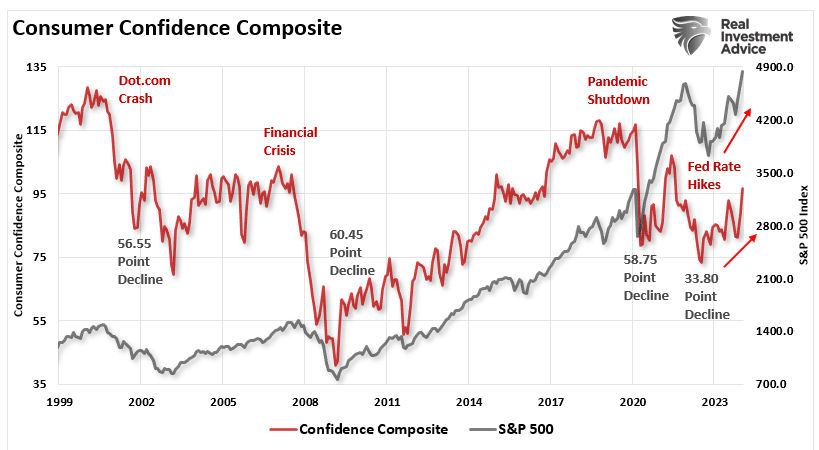
That relationship between confidence, consumption, and economic growth has become stretched. While consumers are still spending, such remains a function of the remnants of previous liquidity flows, a sharp reduction in savings, and an increase in debt. However, there are limits to those supports. Secondly, much of the current economic data is measured annually. As such, those comparisons will become more challenging as time progresses.

As noted, the chart below shows how much debt each individual currently needs to fill the gap between the cost of living and what real disposable incomes and savings can support. In other words, every family needs an average of $4052 in debt each year to fill the living gap. Such is why consumer credit per capita continues to surge higher.

Other Indicators Also Suggest Stock Markets Are Overly Excited
Other indicators also suggest that stock markets are too far ahead of themselves. One such indicator is the Conference Board’s Leading Economic Index (LEI). That index comprises ten components that typically lead to changes in the overall economy.

The stock market typically correlates to the LEI, given that the S&P is one of its components, except currently. The current deviation from the LEI is something we have not seen previously. Given that such a deep decline in the LEI has previously been coincident with the onset of recession, this time is indeed different. Stock markets are beating that the LEI will return to growth trends without a recession.

Furthermore, stock markets are also well deviated from the ISM composite index. As discussed in “Signs But No Recession,” today’s economy is markedly different, with “services” comprising roughly 80% of the economy. Therefore, we built an “economically weighted” composite ISM index. To wit:
“If we weight the composite index to economic levels (77% services, 23% manufacturing), the index is only at the cusp of a recession warning.”
That composite index is below and overlays the annual rate of change of the S&P 500 Index. Stock markets and the composite ISM index correlate highly to changes. When the index is rising, unsurprisingly, stock markets are also rising. The clear exception is that since 2023, stock markets have been accelerating while the ISM composite index remains flirting with a contraction.

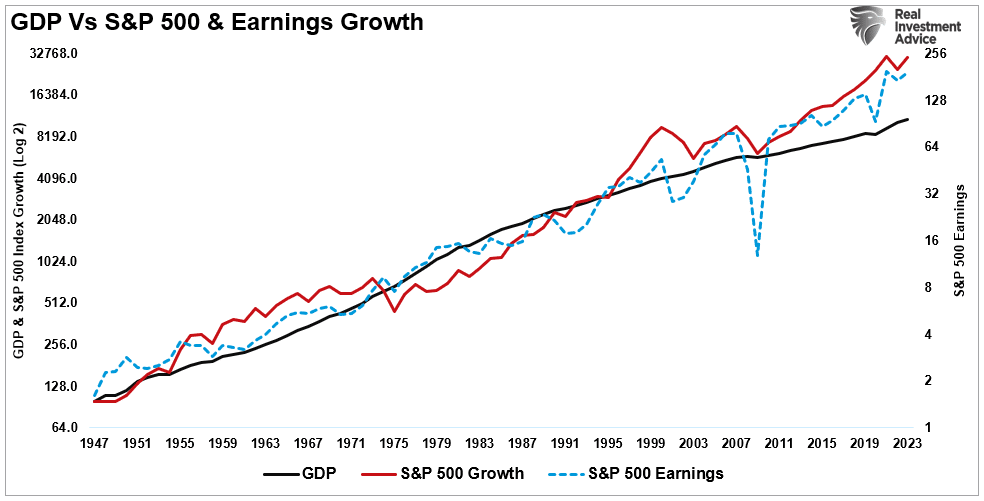
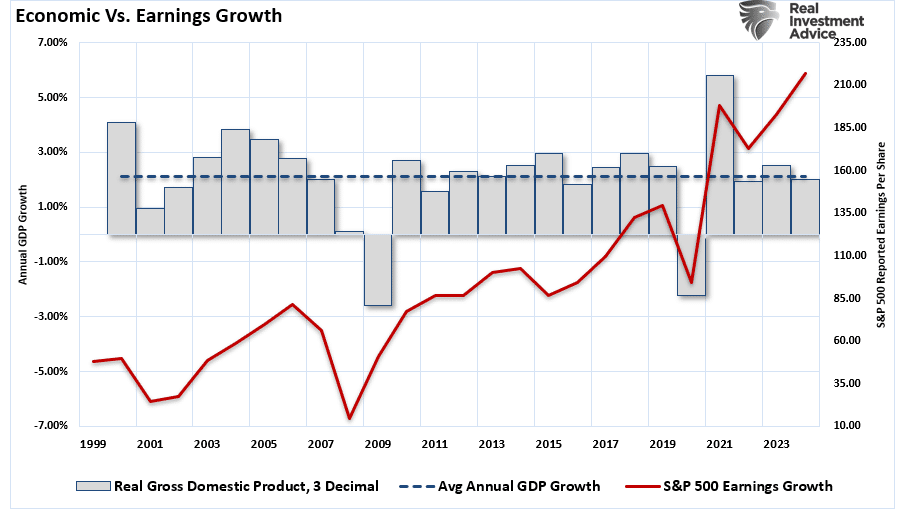
These deviations are significant because earnings are derived from economic activity. When consumers and businesses are active in a consumption-driven economy, those activities create revenue growth. Corporations derive earnings from revenue growth, which happens at the top line of the income statement. Wall Street expects earnings to remain well deviated above the long-term growth trend, which historically has been unsustainable. As shown below, earnings have historically grown 6% on a peak-to-peak basis and 5% on a trough-to-trough basis. The current exponential growth trend line suggests that the $217 estimated earnings projections for 2024 are exceptionally deviated from the $168 long-term growth trend.

Furthermore, the expected growth rate of the economy is certainly not strong enough to support the anticipated earnings growth rate.
Historically, it has not been unprecedented for stock markets to overshoot fundamental macro indicators when a “bullish stampede” is afoot. However, the deviation from the historical fundamental underpinnings has previously served as a cautionary tale to investors.
Will this time be different? It is certainly possible. However, as investors, it would be prudent to be aware of the risk that historical deviations have led to stock markets correcting down to the fundamental underpinnings and not vice-versa.
How We Are Trading It
As noted above, with the Federal Reserve pushing back on equity markets, there is a risk of a further correction over the next couple of weeks. With the markets being excessively optimistic, overbought, and deviating above long-term means, we suggest that investors continue to hold some excess cash and wait for a better opportunity to deploy that capital.
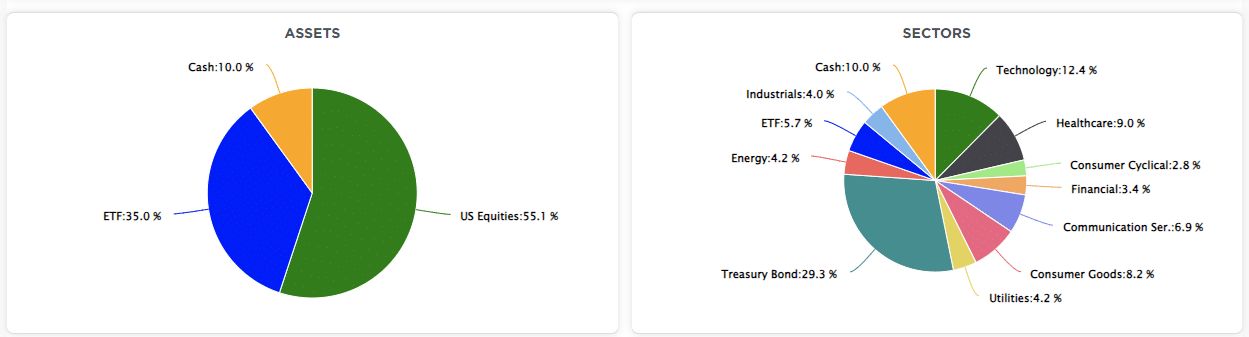
With the bulk of earnings for the S&P 500 behind us by the end of this coming week, we should start to see where markets are stabilizing. As discussed previously, we have yet to see a meaningful rotation into value from growth, leaving this market confined to a smaller number of winners versus losers. We suspect that will change at some point, and our portfolio seems well positioned with some value balanced against growth for such a rotation.
Given we suspect a further correction is forthcoming, we suggest reverting to basic portfolio management rules to reduce portfolio risks for now.
- Trim Winning Positions back to their original portfolio weightings. (ie. Take profits)
- Sell Those Positions That Aren’t Working. If they don’t rally with the market during a bounce, they will decline when it sells off again.
- Move Trailing Stop Losses Up to new levels.
- Review Your Portfolio Allocation Relative To Your Risk Tolerance. If you have an aggressive allocation to equities, consider raising cash levels and increasing fixed income accordingly to reduce relative market exposure.
Have a great week.
Research Report

Subscribe To “Before The Bell” For Daily Trading Updates
We have set up a separate channel JUST for our short daily market updates. Please subscribe to THIS CHANNEL to receive daily notifications before the market opens.
Click Here And Then Click The SUBSCRIBE Button
Subscribe To Our YouTube Channel To Get Notified Of All Our Videos
Bull Bear Report Market Statistics & Screens

SimpleVisor Top & Bottom Performers By Sector

S&P 500 Weekly Tear Sheet

Relative Performance Analysis
As noted last week, the “capitalization-weighted index” is overbought, but the composite index average and median are not. However, this week’s higher surge is now bringing most sectors and markets toward overbought. While we could see more upward pressure next week, a correction into the end of the month would be unsurprising. We suggested a bit of rotation from leaders to laggards was likely, which happened mildly last week. Still, given the Fed’s reversal to more liquidity, we will likely continue to see high-beta names lead the charge until we start seeing a significant economic activity slowdown.

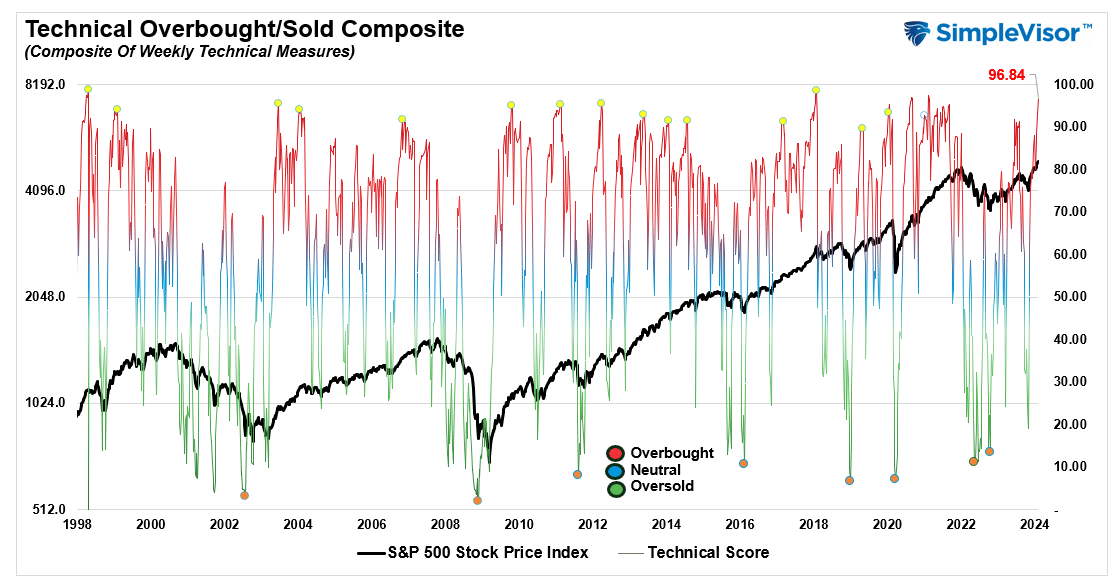
Technical Composite
The technical overbought/sold gauge comprises several price indicators (R.S.I., Williams %R, etc.), measured using “weekly” closing price data. Readings above “80” are considered overbought, and below “20” are oversold. The market peaks when those readings are 80 or above, suggesting prudent profit-taking and risk management. The best buying opportunities exist when those readings are 20 or below.
The current reading is 96.84 out of a possible 100.
Portfolio Positioning “Fear / Greed” Gauge
The “Fear/Greed” gauge is how individual and professional investors are “positioning” themselves in the market based on their equity exposure. From a contrarian position, the higher the allocation to equities, the more likely the market is closer to a correction than not. The gauge uses weekly closing data.
NOTE: The Fear/Greed Index measures risk from 0 to 100. It is a rarity that it reaches levels above 90. The current reading is 76.92 out of a possible 100.

Relative Sector Analysis

Most Oversold Sector Analysis

Sector Model Analysis & Risk Ranges
How To Read This Table
- The table compares the relative performance of each sector and market to the S&P 500 index.
- “MA XVER” (Moving Average Crossover) is determined by the short-term weekly moving average crossing positively or negatively with the long-term weekly moving average.
- The risk range is a function of the month-end closing price and the “beta” of the sector or market. (Ranges reset on the 1st of each month)
- The table shows the price deviation above and below the weekly moving averages.
As noted last week:
“That lead/lag analysis is becoming more evident in the latest analysis as Technology is overbought while the economically sensitive sectors and bonds are oversold. While I would not be surprised to see a rotation occur, given the current backdrop of liquidity, momentum, and weakening economic data, we could continue to see this bifurcation last a while longer.”
That remained the case this past week with Discretionary and Communications already outside its risk/reward range in the first two days of the month. More notably, the deviations of those leading sectors are becoming significantly deviated from their long-term moving averages. The last time we saw double-digit deviations like this was heading into 2022. For now, however, most sectors and markets have bullish trends with moving-average crossovers. Such suggests higher prices for now, but realize that eventually this will reverse.

Weekly SimpleVisor Stock Screens
We provide three stock screens each week from SimpleVisor.
This week, we are searching for the Top 20:
- Relative Strength Stocks
- Momentum Stocks
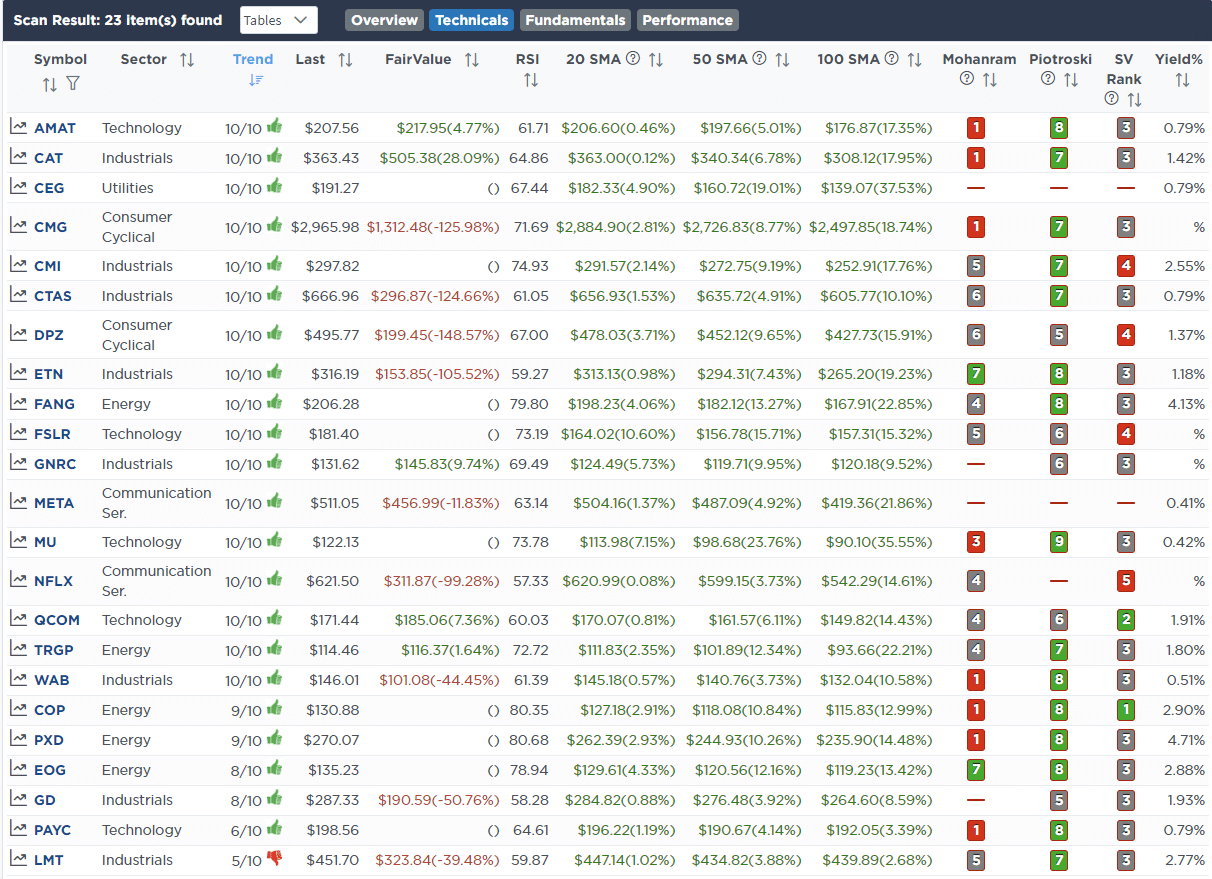
- Fundamental & Technical Strength W/ Dividends
(Click Images To Enlarge)
R.S.I. Screen

Momentum Screen

Fundamental & Technical Strength
SimpleVisor Portfolio Changes
We post all of our portfolio changes as they occur at SimpleVisor:
February 1st
As we noted previously, we are using opportunities to build out the dividend equity model. Yesterday’s sell-off provided another opportunity to add to some existing positions, and initiate a new one, in our process. We need to increase the weight of the Technology shares, but will wait until after today’s earnings to look for a better entry point.
Dividend Equity Model
- Initiating a position in Duke Energy (DUK)
- Add to existing holdings as follows, increasing each to 2.2% of the portfolio.
- Philip Morris (PM)
- Simon Property Group (SPG)
- Federal Realty Trust (FRT)
- Stanley Black and Decker (SWK)
- Realty Income (O)
- Legget and Platt (LEG)
- Verizon (VZ)
- Consolidate Edison (ED)
February 2nd
“As noted yesterday, we are using earnings weakness and other price opportunities to continue building out the Dividend Equity Model. Today, we are adding another 1/3rd of target position sizes to Apple, Abbvie, Google, Goldman Sachs, JP Morgan, and Coca-Cola.
In the Equity and ETF models we are shifting duration in bond portfolios by reducing our large weighting in 1-3 year T-Bills (SHY) to 7-10 year Treasury bonds (IEF.) With the Federal Reserve cutting rates this year, and the recent pullback providing an entry point, we are shifting our duration mildly.“
Dividend Equity Model
- Increasing current holds by the same amount as the original buys.
- Apple (AAPL), Abbvie (ABBV), Google (GOOG), Goldman Sachs (GS), JP Morgan (JPM), and Coca-Cola (KO).
Equity And ETF Models
- Sell 5% of the iShares 1-3 Year Treasury Bill ETF (SHY)
- Initiate a 5% position in the iShares 7-10 Year Treasury Bond ETF (IEF)

Lance Roberts, C.I.O.
Have a great week!

