
Inside This Week’s Bull Bear Report
- The Market Responds To The Last Fed Rate Hike
- The Debt Ceiling Non-Crisis
- How We Are Trading It
- Research Report – Minimum Wage & The Fed’s Fear
- Youtube – Before The Bell
- Stock Of The Week
- Daily Commentary Bits
- Market Statistics
- Stock Screens
- Portfolio Trades This Week
The Market Responds To The Last Fed Rate Hike
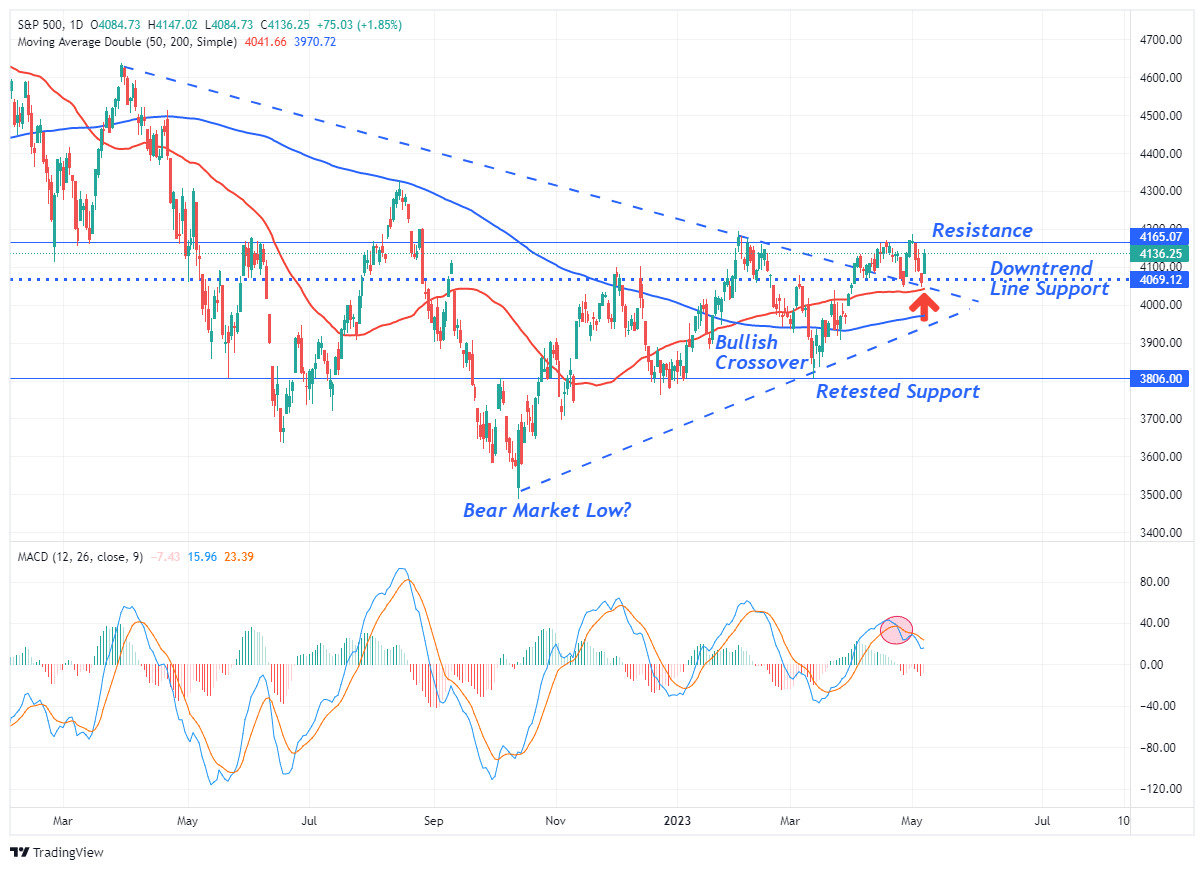
The debt ceiling and the Fed have consumed market headlines this past week. However, as noted last week, the short-term “sell signal” triggered.
“Given that the MACD “sell signal” turned from a lower level than the three previous peaks, we could see a short-term reversal to a buy signal. However, should such occur, there is likely limited upside. Therefore, we suggest using the current rally to reduce risk, rebalance portfolios and raise cash levels moderately is still advisable.”
While the market rallied to the February highs last Thursday and Friday, the signals kept us out of trouble of being overly exposed to equity risk. The reductions we made a couple of weeks ago helped shield portfolios from this week’s correction, which was both needed and expected. While technical signals often don’t make sense, more often than not, they are picking up on the “herd mentality” of the market. When an event happens, we immediately look for headlines to blame for the sell-off or advance, but the market is usually ahead of whatever the trigger turned out to be.
The market remains on a “sell signal” and again tested and held critical support at the 50-DMA and the downtrend support line from the April highs. The consistent test and holding of support remain bullish overall, and unless or until that is broken, the more bearish concerns are secondary.
The Fed’s End Game
This past Wednesday, the Federal Reserve hiked the Fed Funds rate for the last time by 0.25%. That hike brought the rate to 5% as the Fed signaled it is the last rate hike, at least for now.
“The FOMC statement used language broadly similar to how officials concluded their interest-rate increases in 2006, with no explicit promise of a pause by retaining a bias to tighten.” – WSJ
And:
“For me the key was a change of a single word, saying that they believe that they will be determining whether future raises are necessary, whereas last time they said that they are anticipating that further rate hikes will be necessary. With the word ‘determining‘ in place of ‘anticipating‘ is essentially telling the markets that the Fed is now on pause.” – Sam Stovall, chief investment strategist at CFRA Research in New York. “
However, while the Fed paused, the bulls wanted to hear a “pivot” to cutting rates. That language remained elusive as the Fed said it would continue to focus on incoming data, such as employment and inflation, which remain too strong and elevated. Friday’s employment report of 269,000 jobs and a 0.5% wage increase is certainly not conducive for a “rate cut” any time soon.
The problem for the Federal Reserve is the banking crisis. As rates remain high, money flows out of banks and into money market funds with a 5% yield.

As capital leaves the banks, they are forced to sell assets to meet the withdrawals. With those assets trading at a deep discount, the banks are pushed into insolvency because of the Fed rate hikes. Moreover, as bank share prices decline and news fills the mainstream media, depositors panic and withdraw their funds, further impairing the banks. It’s a vicious cycle the Fed has created.
The Fed will most likely need to start providing facilities to banks to stabilize them by offering to buy their assets at face value. This will essentially be a limited form of Quantitative Easing. Either that or the Fed will be forced to cut rates to reduce the collateral stress. However, cutting rates potentially reignites inflation.
The Fed is in a very tough spot. However, I suspect we will have a resolution sooner than later.
Then there is the concern over the debt ceiling and a potential default on our debt.
Need Help With Your Investing Strategy?
Are you looking for complete financial, insurance, and estate planning? Need a risk-managed portfolio management strategy to grow and protect your savings? Whatever your needs are, we are here to help.

Never Let A Crisis Go To Waste
The financial media is rife with misinformation on the debt ceiling and the jump in interest rates. However, a history review shows that the “debt-ceiling” issue is not only a non-crisis, but the recent rise in rates is likely an opportunity to buy bonds.
Let’s start with the media scare tactics over the debt ceiling:
- If Congress doesn’t raise the debt ceiling, the Treasury will run out of money.
- The U.S. will default on its debt.
- The markets and economy will crash.
While there is a grain of truth behind these statements, they are largely false. However, for the media, a manufactured crisis should never be allowed to go to waste. To wit:
The jobs, benefits and financial security of millions of Americans could start disappearing in less than a month as the Republican House leverages a debt showdown to try to force big spending cuts on President Joe Biden.
Treasury Secretary Janet Yellen on Monday issued a stark warning that the US government could run out of money to pay its obligations as soon as June 1 unless Congress raises its borrowing authority. Failure to do so could trigger a domestic and international financial catastrophe.
Or this from the Washington Post:
“Time is running out on Congress to raise the debt ceiling and prevent the nation from defaulting, a scenario that could destabilize global markets and devastate the economy.
If no deal is reached, Congress doesn’t act, and the White House doesn’t do something unilaterally, it’s likely the government wouldn’t have enough money to pay all of its bills. It would ‘default’ on some of its obligations. There is no precedent for the government missing payments like this.“
While a remarkable statement to get “clicks,” even a cursory review of history suggests the hyperbole falls well short of reality.
What Is The Debt Ceiling Anyway
Let’s start with an explanation of the “debt ceiling.”
“The debt ceiling is the legal limit on the total amount of federal debt the government can accrue. The limit applies to almost all federal debt, including the roughly $22.3 trillion of debt held by the public and the roughly $6.2 trillion the government owes itself as a result of borrowing from various government accounts, like the Social Security and Medicare trust funds. As a result, the debt continues to rise due to both annual budget deficits financed by borrowing from the public and from trust fund surpluses, which are invested in Treasury bills with the promise to be repaid later with interest.” – CRFB
The purpose of establishing a debt ceiling was to place a “credit limit” on the Government. In a responsible Government, as the debt ceiling approaches, members of Congress should begin discussing budget cuts, spending reductions, or revenue increases. The goal, logically, is to keep the country in a “surplus” position over time.
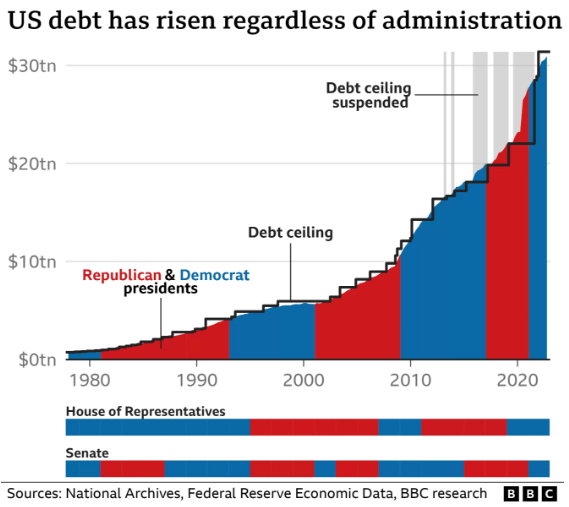
In 1980, that all changed, and eight administrations and four decades later, Government debt surged, deficits exploded, and the debt ceiling rose 78 times. (49 times under Republicans and 29 times under Democrats.)
Has The U.S. Ever Defaulted On Its Debt?
Yes.
“Investors in T-bills maturing April 26, 1979, got told that the U.S. Treasury could not make its payments on maturing securities to individual investors. The Treasury was also late in redeeming T-bills which become due on May 3 and May 10, 1979. The Treasury blamed this delay on the failure of Congress to act in a timely fashion on the debt ceiling legislation in April. Also, an unanticipated failure of word processing equipment used to prepare check schedules contributed to the delay.” – The Financial Review
Because “fear-mongering” attracts readers, the mainstream media missed that there are two types of default.
The first is an actual default, where the borrower cannot repay the principal owed to its creditors.
The second is a “technical default.” In 1979, as noted, the Treasury was entrenched over a “debt ceiling debate” and could not make interest payments. There was little worry by lenders over the safety or security of their capital. They knew that when the U.S. resolved the “technical issues,” the Government would make its payments.
Such is the “crisis” bond investors currently face.
- Could there be a short-term delay in making interest payments? Absolutely.
- Is there any risk of a default on the payment of interest or principal on outstanding Treasury bonds? Absolutely not.
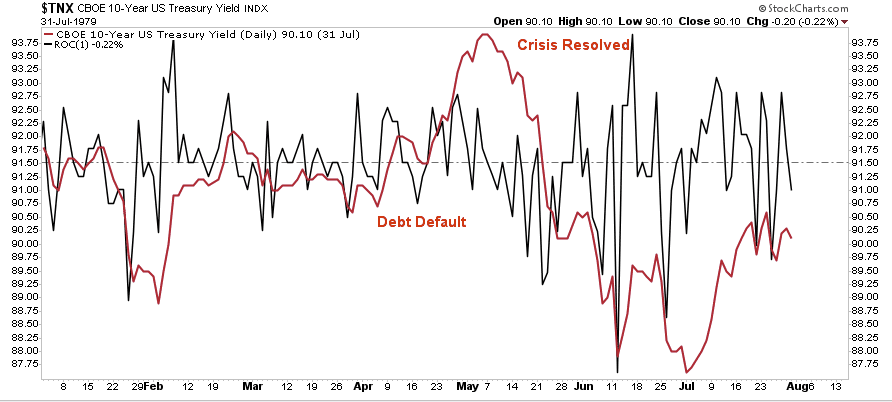
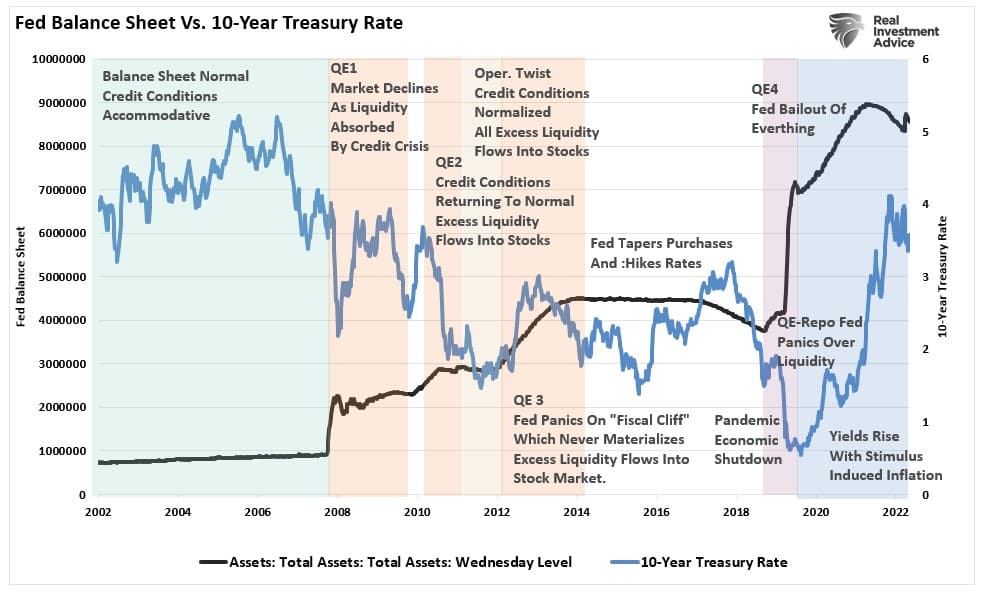
As shown, 10-year rates did spike shortly over the initial concerns of the default. However, as bondholders realized there was no continuing threat, they began to buy bonds at a discount to the previous value. Over the next few months, rates fell as sanity returned to the bond market. (Later that year, rates would rise again over legitimate concerns of the oil crisis.)
It is unsurprising to see Treasury yields rise as media rhetoric sparks fear of default. However, as noted above, the current debt ceiling crisis is likely a non-crisis.
Debt Ceiling Crisis Non-Crisis
Congress will lift the debt ceiling. As noted by the Treasury Department:
“Congress has always acted when called upon to raise the debt limit. Since 1960, Congress has acted 78 separate times to permanently raise, temporarily extend, or revise the definition of the debt limit – 49 times under Republican presidents and 29 times under Democratic presidents. Congressional leaders in both parties have recognized that this is necessary.”
Just as happened every time previously, Congress will lift the debt ceiling again. However, we are assured there will be a lot of drama in the process, with both parties of Government pointing their finger at each other. The simple reason is that despite differences of opinion and political agendas, both parties want to continue spending money. Such is why the runaway spending and deficit increases continue to accelerate. The consequence of increasing debts and deficits is evident in the declining economic growth rates over the past 40 years.

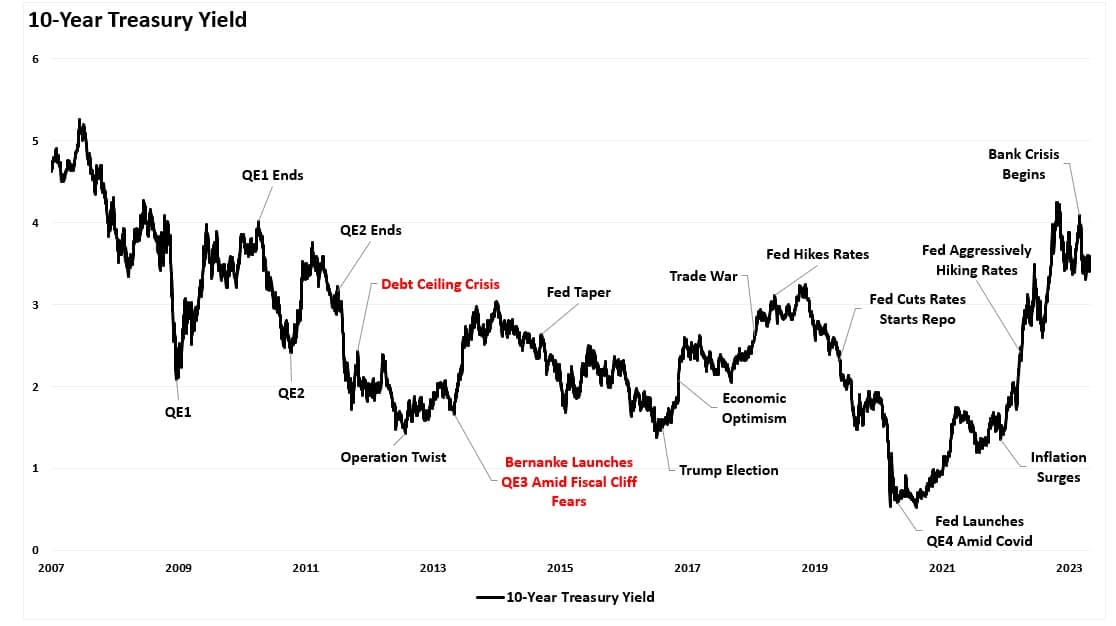
Since 2009, a debt ceiling fight has become almost an annual event between policymakers. The most prominent was in 2011, which led to a comprise to cut $1 trillion in spending. At that time, Ben Bernake launched the third round of Quantitative Easing to compensate for what was feared to be a “fiscal cliff” in 2013. Such was due to spending cuts getting automatically imposed.
As shown, rates spiked during the “debt ceiling crisis” as concerns over default rose. Subsequently, rates fell to new lows as deficits surged and economic growth slowed. Currently, rates have increased due to surging inflation and strong economic growth from massive fiscal injections in 2020 and 2021. However, as the monetary leaves the system, economic growth rates are already slowing, as debt levels crest $32 Trillion. Yields will eventually move lower in response to a reversal of inflation and economic activity.
Why Now Is Likely A Great Bond Buying Opportunity
There are several vital points evident from reviewing history.
- While politicians talk a tough game, the current debate over the debt ceiling is nothing more than political posturing.
- The media is a primary source of misinformation about the debt ceiling and potential outcomes.
- Bond investors should welcome the debt ceiling debate as an opportunity to buy bonds at cheaper prices with higher yields.
Are there currently risks to the bond market that investors should be concerned about near term? Yes. The current spike in inflation has lasted longer than expected due to the massive amount of monetary liquidity still in the economy. Furthermore, rates rise when the Fed “tapers” its bond purchases as they are doing now.
However, both of these issues will resolve themselves going forward. Eventually, inflation will decline as economic activity slows, and the Fed will return to monetary accommodation. More importantly, yields historically fall as investors’ “risk preference” shifts from “risk-on” to “risk-off” during economic recessions.
As if always the case with investing, timing, as they say, is everything.
Given the extreme short-position against 10-year Treasury bonds by speculators, we may be seeing an excellent opportunity to add duration to our bond portfolios.

Moreover, with the equity market still overvalued and profit margins under pressure, we suspect bonds will provide a chunk of our capital gains over the year or so.
Of course, if you are betting on a recession within the next 12 months, equity markets have only minimal upside compared to the bond market, where yields will likely approach zero.
How We Are Trading It
Last week we stated:
“While the market technicals remain bullish-biased, the defensive rotation and narrowing growth leadership typically indicate a slowing economic cycle or a recessionary onset. In the current episode, the crowding into a handful of Mega-capitalization names is already at extreme levels.”
That analysis has not changed much this week.
With our sell signals still intact, we remain cautious for now. We noted last week that the “upside may be somewhat limited,” which was the case. However, we are now approaching more oversold levels with technically strong support. If we see an improvement in the price action, we suggest increasing exposure again accordingly. However, for now, that is not the case.
For now, continue to use reflexive rallies to raise some cash and rebalance equity risk heading into the summer months. While the Fed is done hiking rates, the lag effect of the previous hikes is still working its way through the system.
Continue reducing risks and rebalancing allocations for now.
- Tighten up stop-loss levels to current support levels for each position.
- Hedge portfolios against significant market declines.
- Take profits in positions that have been big winners.
- Sell laggards and losers.
- Raise cash and rebalance portfolios to target weightings.
Have a great week.
Research Report
Subscribe To “Before The Bell” For Daily Trading Updates (Formerly 3-Minutes)
We have set up a separate channel JUST for our short daily market updates. Please subscribe to THIS CHANNEL to receive daily notifications before the market opens.
Click Here And Then Click The SUBSCRIBE Button
Subscribe To Our Youtube Channel To Get Notified Of All Our Videos
Stock Of The Week In Review
In the aftermath of the Silicon Valley Bank failure, the market has favored Mega-Cap stocks.
The rationale is that tighter bank lending standards, the likely result of bank difficulties, will make borrowing more difficult and costly for smaller companies versus larger ones. Large companies have more access to needed capital via the bond markets and are, therefore, less reliant on banks. Further helping Mega-Cap stocks, any liquidity the Fed and government add to markets will flow to the large Mega-Cap stocks.
Given many of MGK’s top holdings have soared and are approaching overbought territory, we thought it might be helpful to look beyond the top seven largest holdings of MGK to the remaining 44% of the ETF. We searched the remaining 87 stocks for past and future earnings growth and how efficiently they reinvest said earnings to promote future earnings growth.
Here is a link to the full SimpleVisor Article For Step-By-Step Screening Instructions.

Login to Simplevisor.com to read the full 5-For-Friday report.
Daily Commentary Tidbits
How Long Until The Fed Cuts Rates
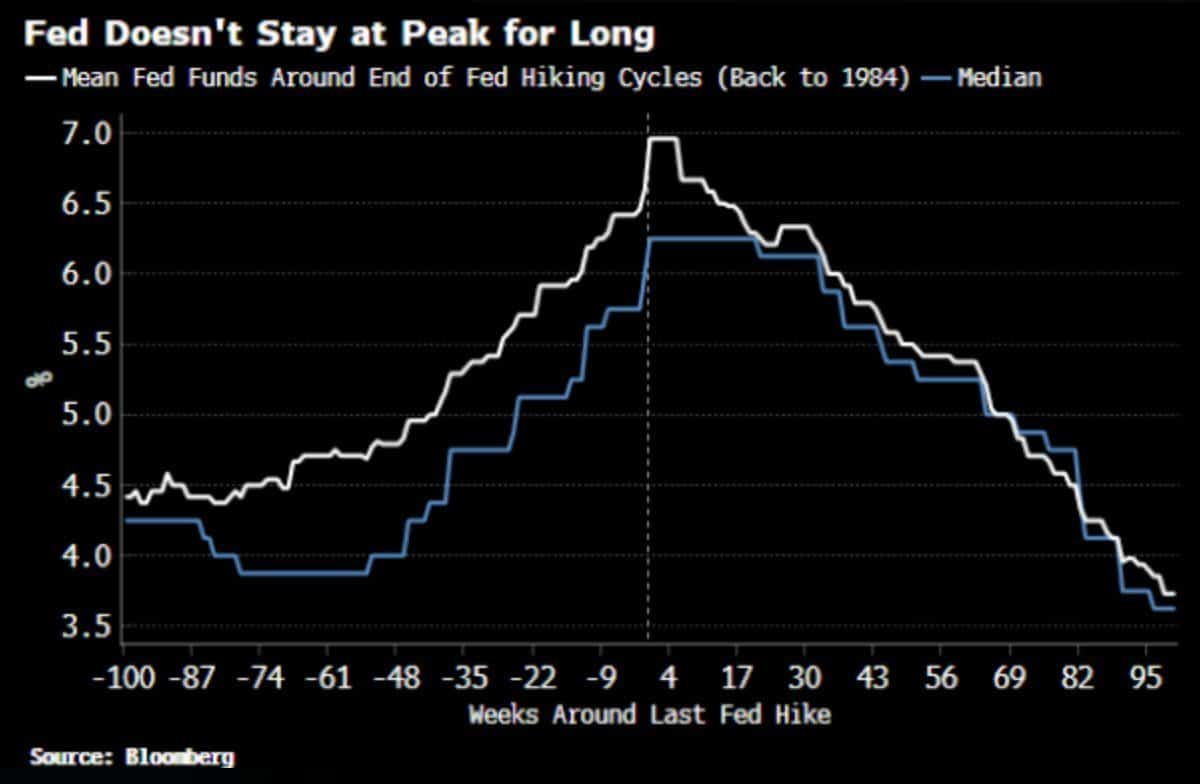
Yesterday’s Commentary, Is the Fed Done, contemplates whether or not Wednesday’s rate hike was the last for the cycle. If it was, as many seem to think, the next question for investors should be how long until the Fed cuts rates. Yesterday’s Commentary shared a table with market-implied Fed rate cut probabilities. A day after the meeting, with the banking crisis accelerating, investors expect a 50% chance for the first 25 basis point rate cut in July. The market expects the Fed to cut rates by almost 2% by this time next year.
While Powell and Fed keep chanting “higher for longer,” history argues Fed rate cuts could be coming by this summer. As we share below from Bloomberg, Fed pauses do not last very long. However, this time is different. Inflation is well above the Fed’s 2% target, forcing them to keep rates high unless “something breaks.” What may break? Regional banks are breaking, and the situation is starting to become worrisome. The Fed will be forced to react. Will they add liquidity backstops for troubled banks or will it resort to cutting rates? Assuming the banking situation calms down, the Fed will likely pause until the economy slows materially and the unemployment rate increases substantially. Until those occur, inflation will likely remain sticky.
(Subscribe To The Daily Market Commentary For A FREE Pre-Market Email)
Bull Bear Report Market Statistics & Screens

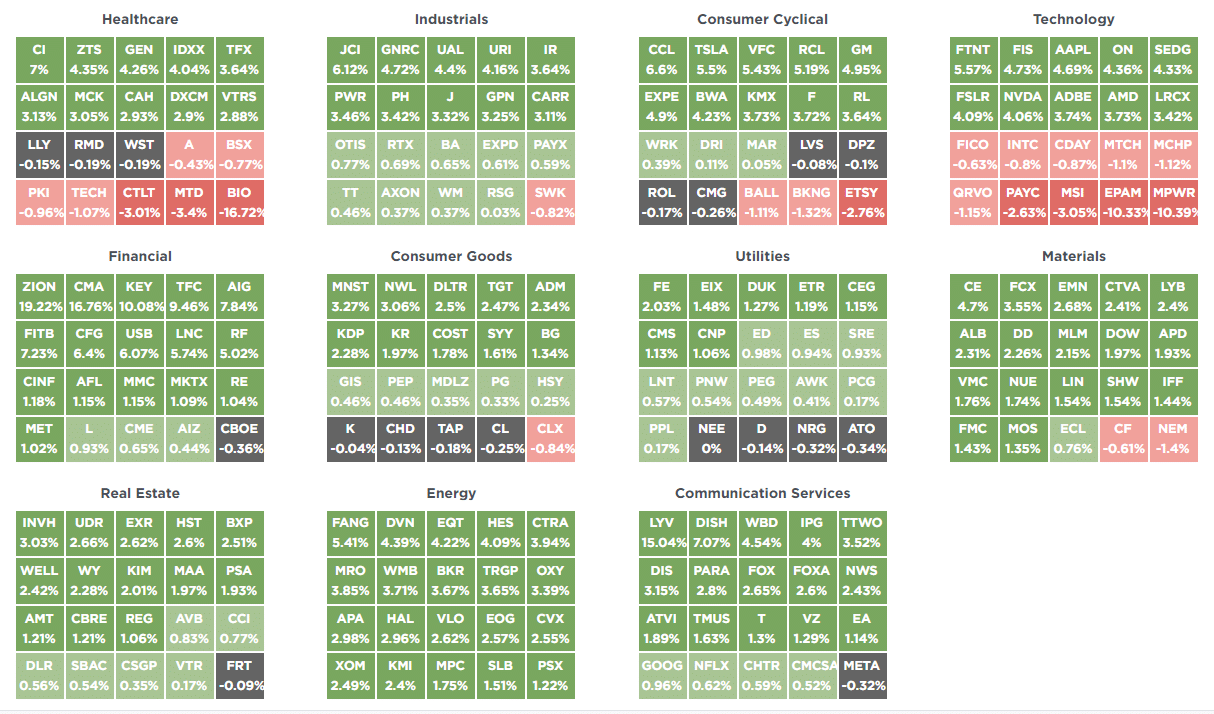
SimpleVisor Top & Bottom Performers By Sector
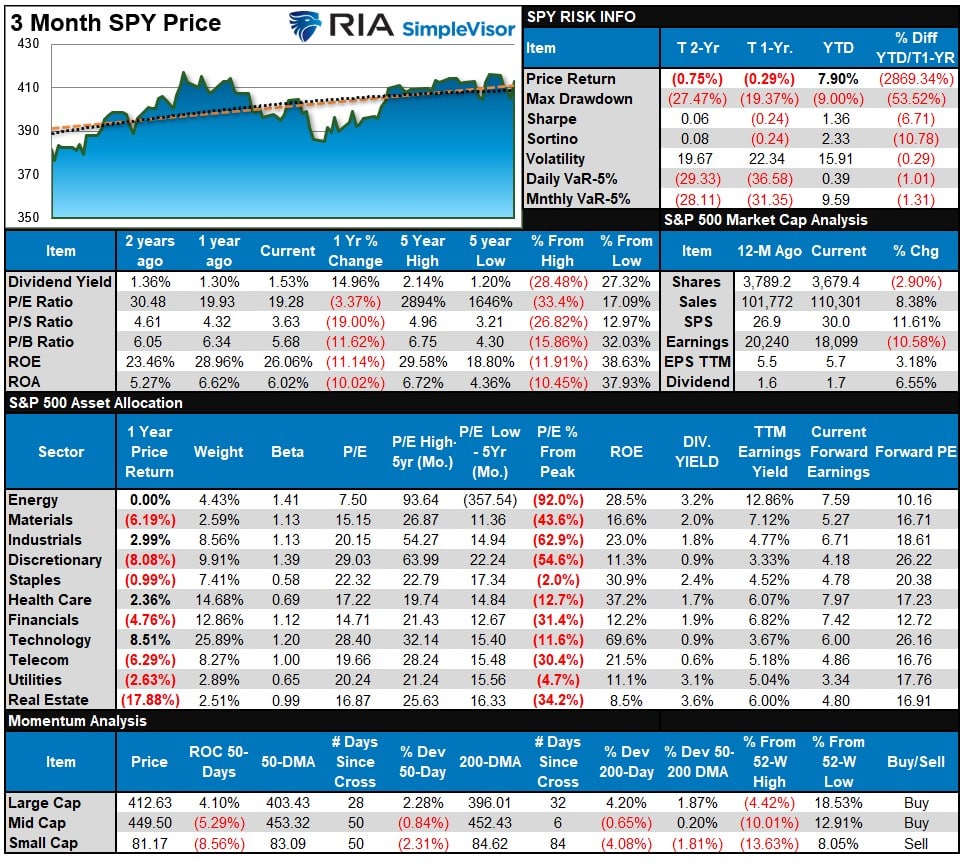
S&P 500 Weekly Tear Sheet
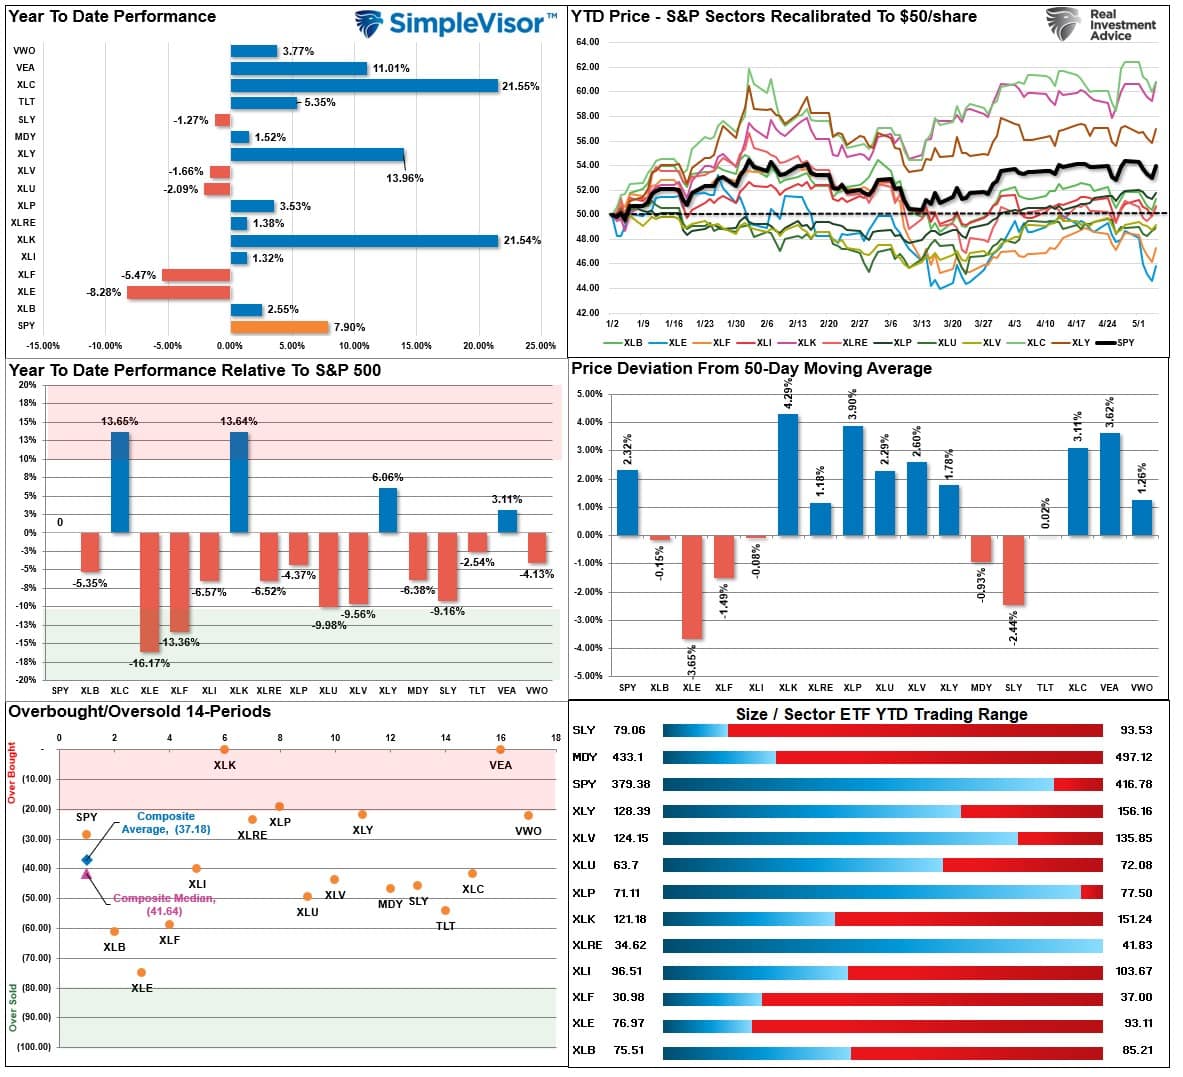
Relative Performance Analysis
In 2022, we regularly commented about the outsized gains of Energy stocks compared to the drag from Technology and Communications, which the media had deemed “dead.” This year is the reverse as the massive outperformance of Technology, Communications, and DIscretionary are the big winners as the “disinflation” trade becomes the focus. Just as in 2022, investors need to remember that next year, the leaders will likely once again be something entirely different.
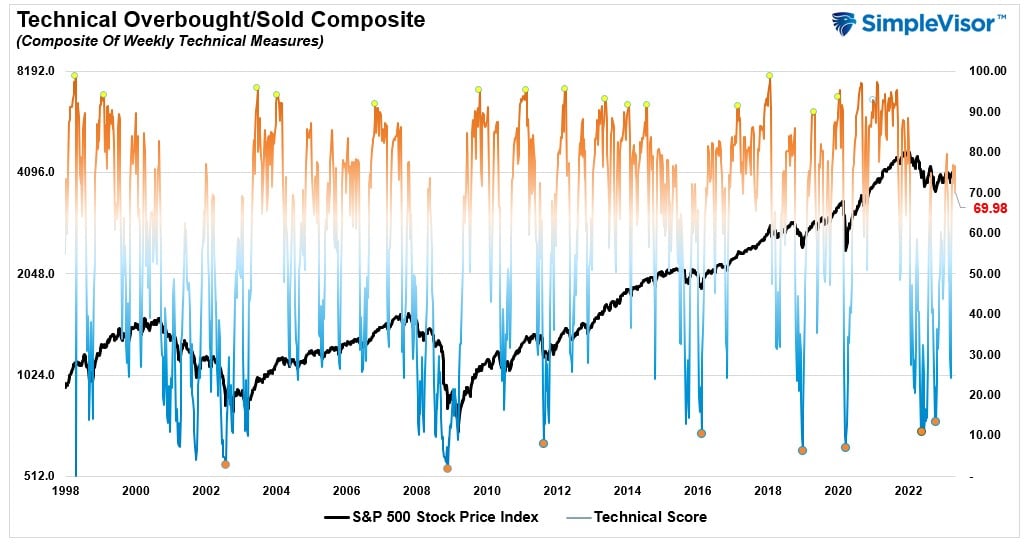
Technical Composite
The technical overbought/sold gauge comprises several price indicators (RSI, Williams %R, etc.), measured using “weekly” closing price data. Readings above “80” are considered overbought, and below “20” are oversold. The market peaks when those readings are 80 or above, suggesting prudent profit-taking and risk management. The best buying opportunities exist when those readings are 20 or below.
The current reading is 69.98 out of a possible 100.
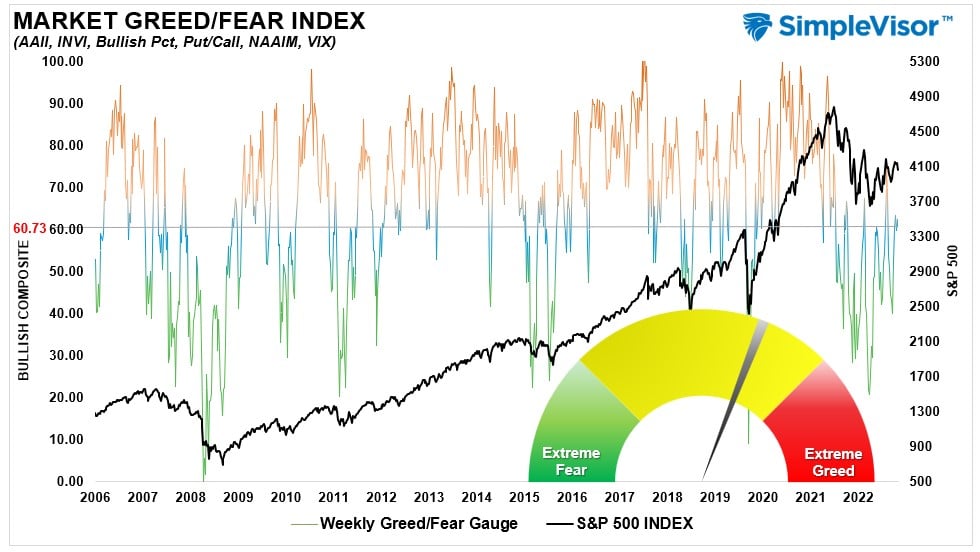
Portfolio Positioning “Fear / Greed” Gauge
The “Fear/Greed” Gauge is how individual and professional investors are “positioning” themselves in the market based on their equity exposure. From a contrarian position, the higher the allocation to equities, the more likely the market is closer to a correction than not. The gauge uses weekly closing data.
NOTE: The Fear/Greed Index measures risk from 0 to 100. It is a rarity that it reaches levels above 90. The current reading is 60.73 out of a possible 100.
Sector Model Analysis & Risk Ranges
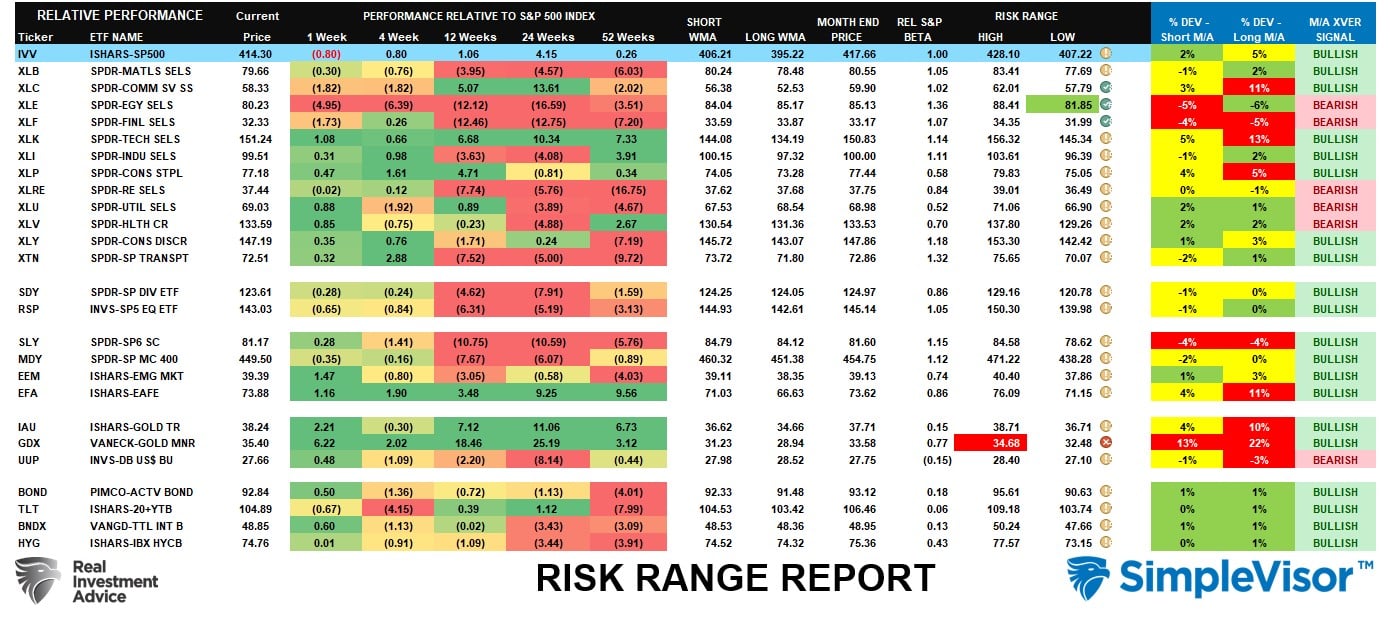
How To Read This Table
- The table compares the relative performance of each sector and market to the S&P 500 index.
- “M” XVER” “Moving Average Cross Over) is determined by the short-term weekly moving average crossing positively or negatively with the long-term weekly moving average.
- The risk range is a function of the month-end closing price and the “beta” of the sector or market. (Ranges reset on the 1st of each month)
- The table shows the price deviation above and below the weekly moving averages.
The market remains bullish, with Technology, Discretionary, and Communications leading the way. Importantly, fixed income is now on bullish buy signals suggesting lower yields. Keep your investments focused on areas with bullish crossovers, as those sectors and markets will continue to lead the charge over the rest of this year.
Weekly SimpleVisor Stock Screens
We provide three stock screens each week from SimpleVisor.
This week we are searching for the Top 20:
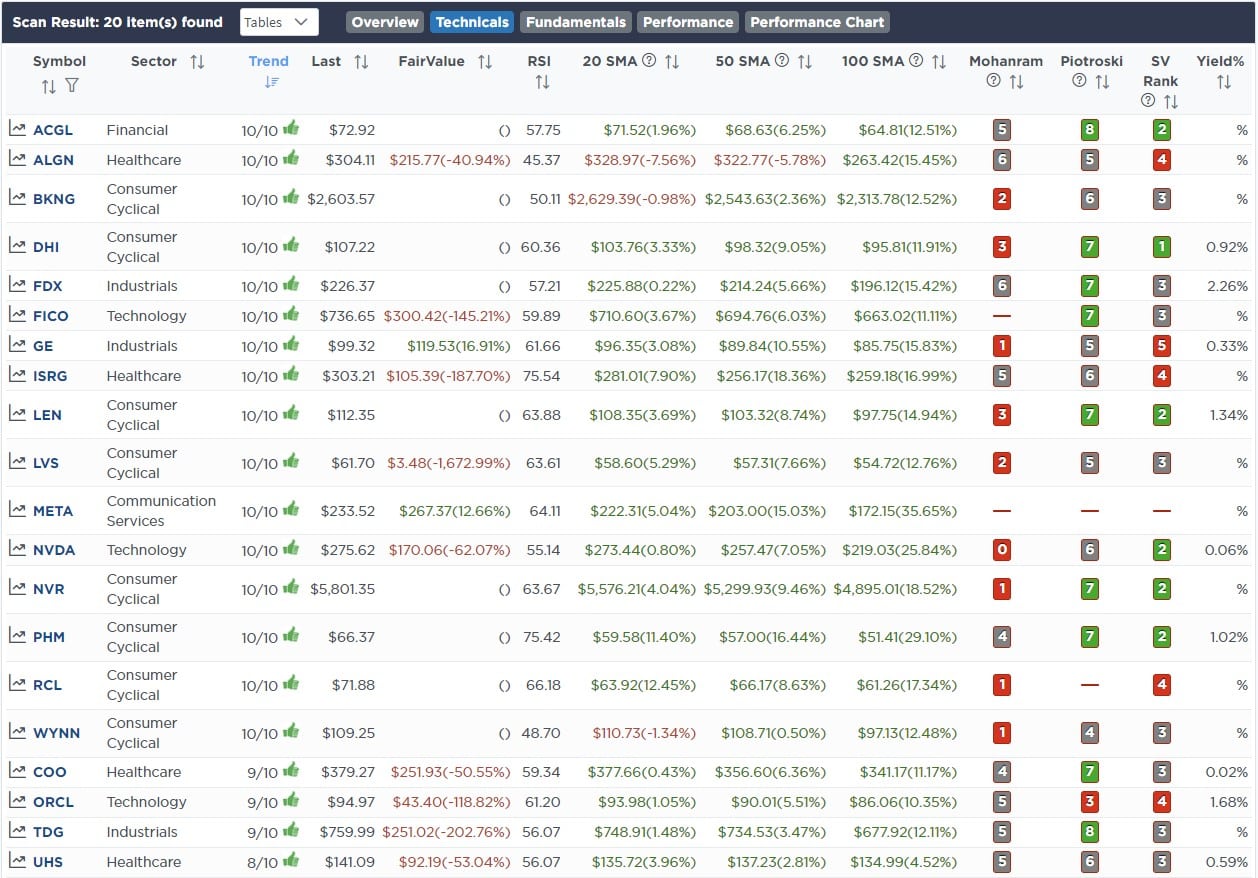
- Relative Strength Stocks
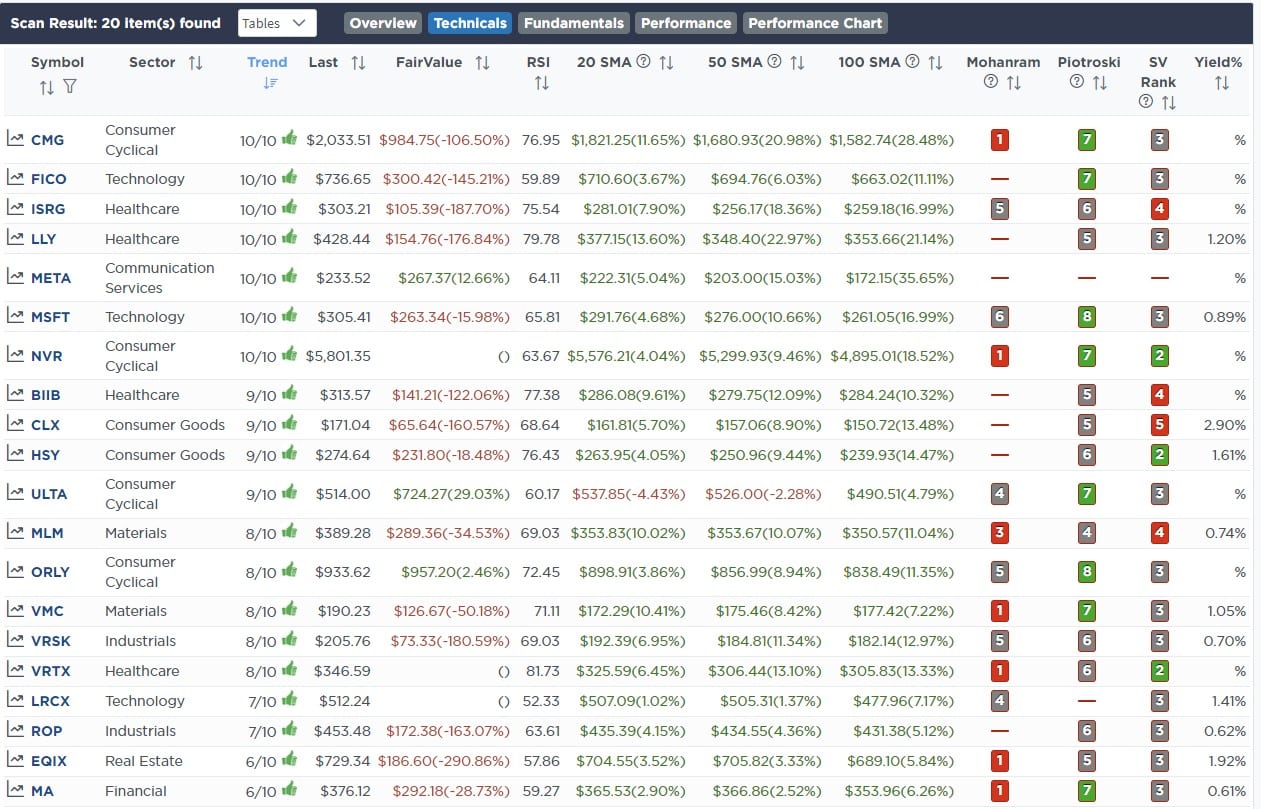
- Momentum Stocks
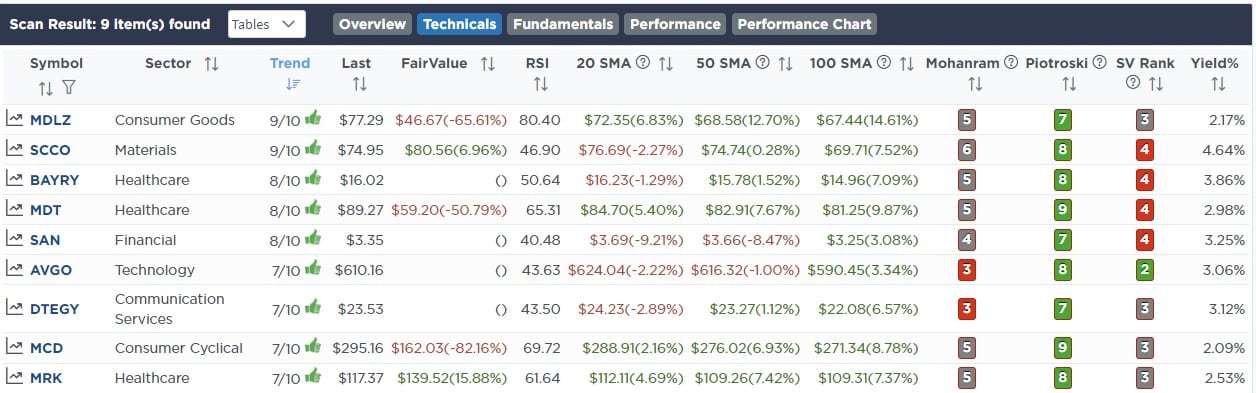
- Technically Strong Stocks With Dividends
(Click Images To Enlarge)
RSI Screen
Momentum Screen
Technically Strong With Dividends
SimpleVisor Portfolio Changes
We post all of our portfolio changes as they occur at SimpleVisor:
No Trades This Week

Lance Roberts, CIO
Have a great week!

