Reasons To Be Bullish. Are There Any?


In this 05-26-22 issue of “Reasons To Be Bullish. Are There Any?”
- Market Review & Update
- Are There Any Reasons To Be Bullish?
- Portfolio Positioning
- Sector & Market Analysis
Follow Us On: Twitter, Facebook, Linked-In, Sound Cloud, Seeking Alpha
Need Help With Your Investing Strategy?
Are you looking for complete financial, insurance, and estate planning? Need a risk-managed portfolio management strategy to grow and protect your savings? Whatever your needs are, we are here to help.
Schedule your “FREE” portfolio review today.

Weekly Market Recap With Adam Taggart
Market Finally Rallies
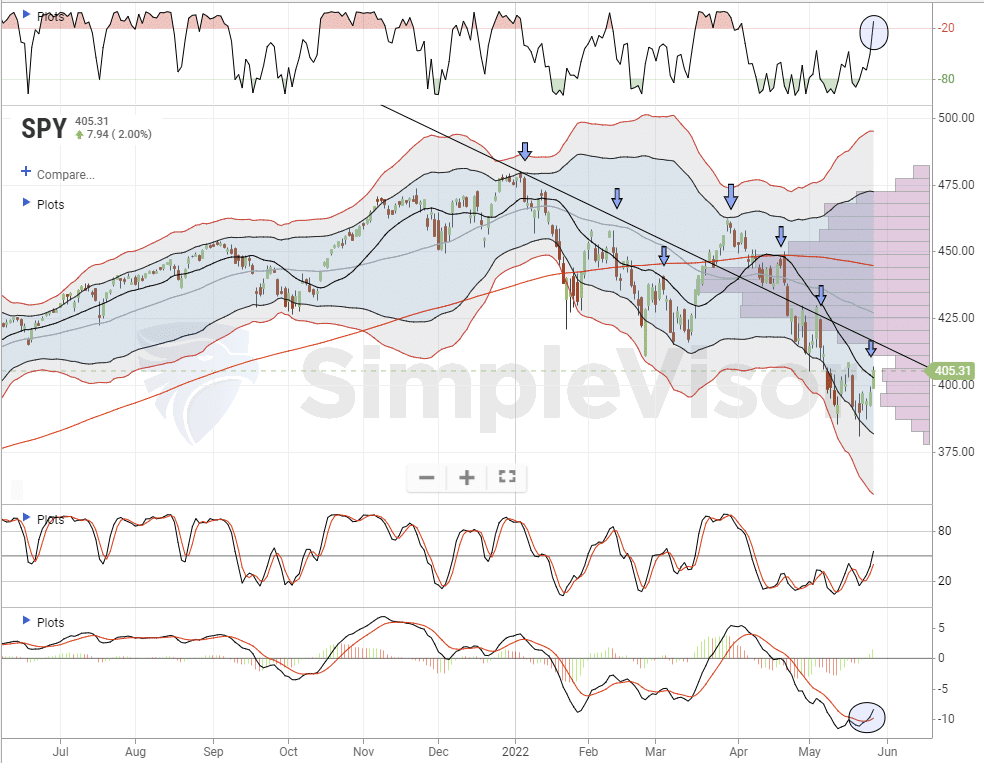
Over the last few weeks, we have been a bit of a broken record suggesting a counter-trend rally was likely. However, that rally remained very elusive. Finally, a rally took hold this week, as investors found reasons to be bullish pushing the market above the 20-dma and triggering a fairly strong “buy” signal.
As John Murphy noted on Friday:
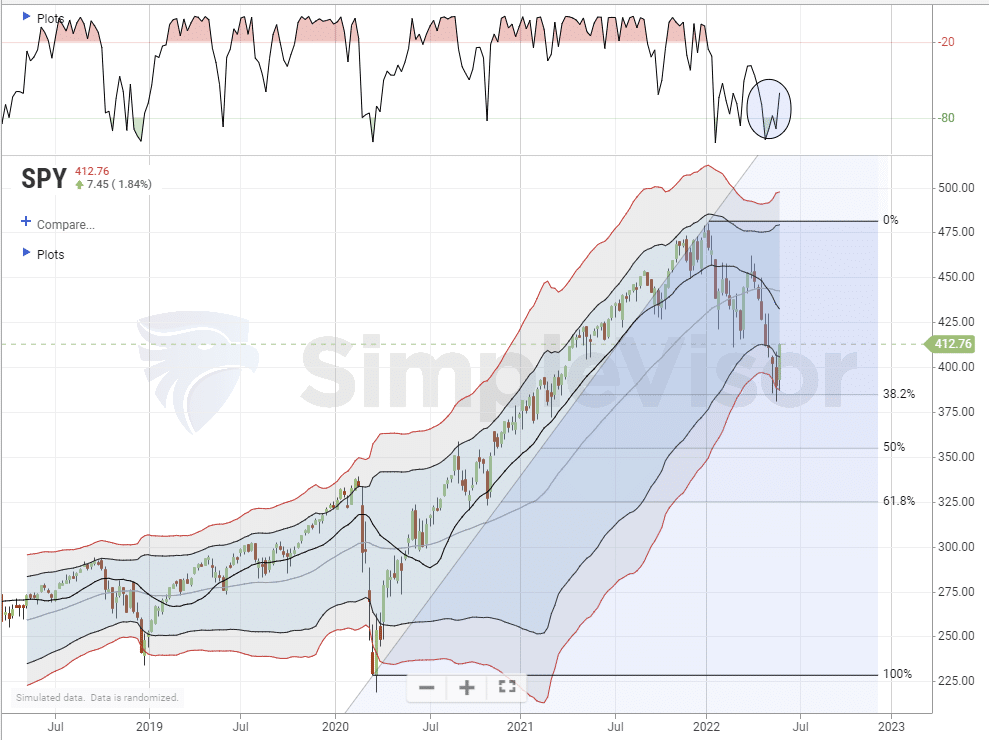
“Stocks are having their best week in two months which suggests that a short-term bottom may be in place. The weekly bars show the S&P 500 bouncing off its 38% Fibonacci retracement line measured from its 2020 bottom to this year’s top. That’s not usual because those retracement lines often provide some support. That’s especially true if the market has reached an oversold condition — which it has.”
Notably, as shown, the market was also 3-standard deviations below its 1-year moving average which further added support for a bounce.
As John continues:
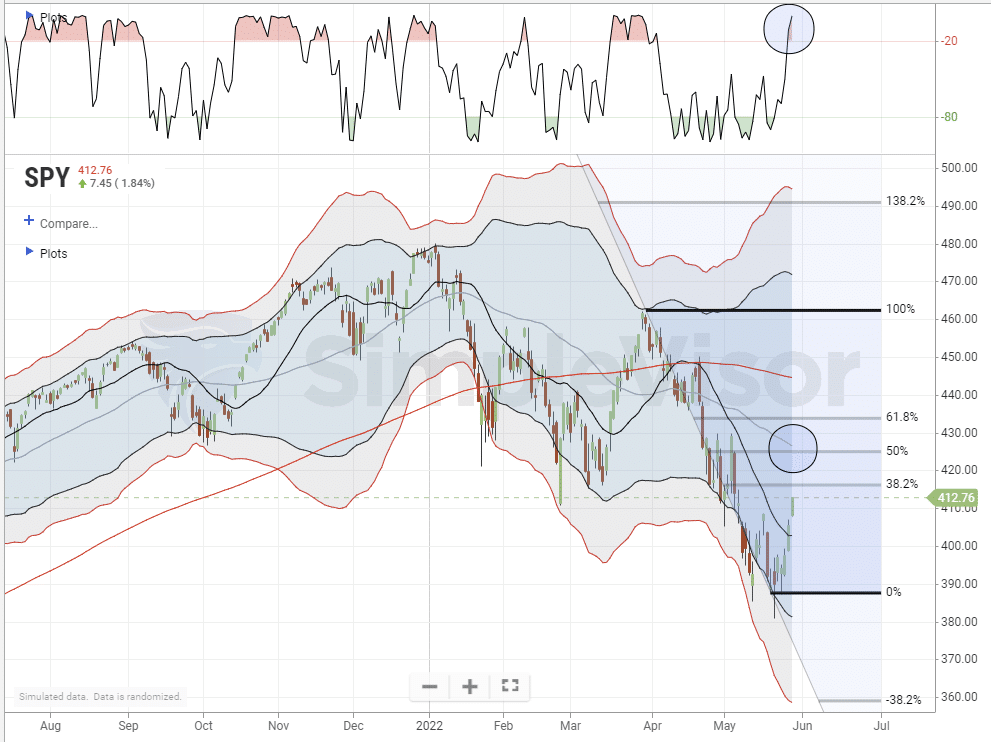
“The daily bars show the S&P 500 exceeding its mid-May peak to turn its short-term trend higher. Stocks, however, have a lot of overhead resistance barriers to deal with.
The grey horizontal lines measure Fibonacci retracement lines measured from their late March peak to their May bottom. Those three lines should now act as overhead resistance barriers. The SPX has already reached the lower line at 38%. More substantial resistance is likely at the two higher lines at 50% and 62%. Moving average lines should also act as overhead resistance. That’s especially true of the blue 50-day average which may be tested (blue circle).
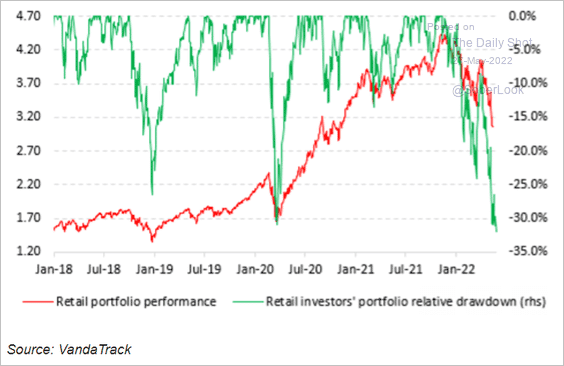
We agree with John’s analysis, which, at least for now suggests that rallies should be sold into, portfolios rebalanced, and cash levels raised. As we will discuss below, with the average investor down 30% this year, there are many “trapped longs” looking for an exit.
Markets Are Weakest When Narrow
“In this market environment, it seems everything moves up or down, with these swings changing on a day-to-day, or sometimes minute-to-minute, basis. This is not market leadership.
Bob Farrell, one of the O.G. gods of technical analysis, explains why this dynamic is such a problem for any bulls still out there. Spelling it out in rule seven of his famous 10 rules of investing, Farrell said, ‘Markets are strongest when they are broad and weakest when they narrow to a handful of blue chip names.'” – Yahoo Finance
That “weakness” in the market leadership has been highly evident over the last 6-months. As discussed in December last year, despite the S&P 500 minting a 28% total return last year, there was a lot of devastation happening below the surface. To wit:
“Without the support of the top-10 holdings, the year-to-date returns and overall volatility would be very different.
Looking at a sampling of the more ‘popular’ trading stocks, you can understand current retail traders’ frustration. A vast majority of 2020 and early 2021’s high-flying stocks are down significantly from their respective 52-week highs.”
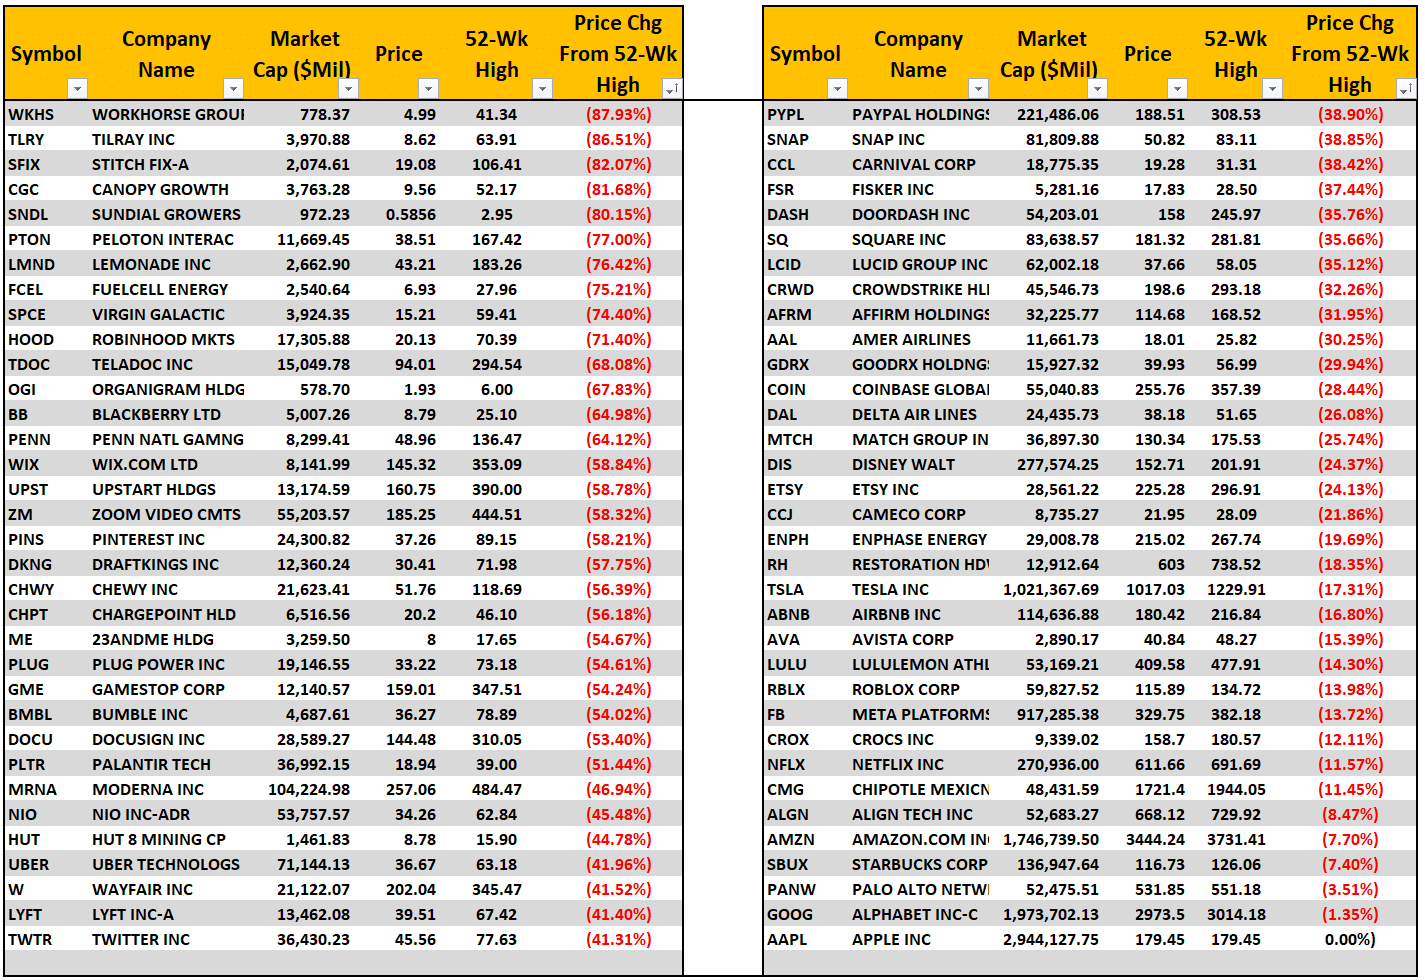
Since publishing that table in mid-December 2021, many of those stocks tumbled even further this year. The issue of narrow breadth is now readily apparent. As noted by Yahoo Finance:
“The following chart from Bank of America technical research strategist Stephen Suttmeier, CFA, CMT shows the New York Stock Exchange advance-decline line.”

Such is a textbook example of a market lacking solid leadership. The damage suffered by the biggest stocks in the market no longer gets concealed.
But are there reasons to be bullish?

Are There Any Reasons To Be Bullish
For the last few weeks, we discussed the highly bearish sentiment, oversold conditions, and seemingly endless selling of equities. With the Fed set to hike rates over the next few months in 50 bps increments, inflation running hot, and the economy slowing, investors’ negative bias is not surprising. Of course, from a contrarian viewpoint, such begs the question, “are there any reasons to be bullish?”
The answer, at least short-term, is “yes.”
The chart from Sentiment Trader below shows the performance of the S&P 500 Index when the Risk On/Risk Off indicator crosses below 4.9 for the first time in three months. While it does denote short-term bottoms, it doesn’t necessarily suggest the “bear market” is over, as seen in 2008.
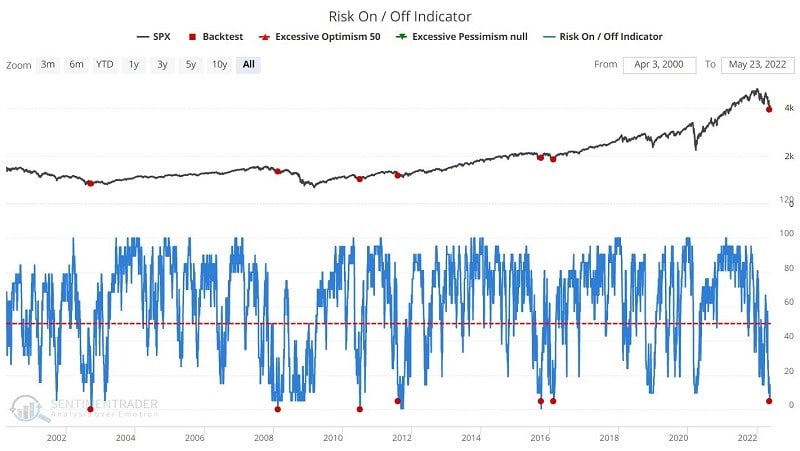
I liked their conclusion as it represents our views on the market currently.
“It is quite possible that we are in a bear market and that, given the second-highest ever peak for the Shiller PE ratio, the bear market could be one of the particularly devastating kinds. As a result, given the fact that all of the market indexes are below their respective 200-day moving average (i.e., in established downtrends), it is important to “play some defense” (for me, defined as holding some cash).”
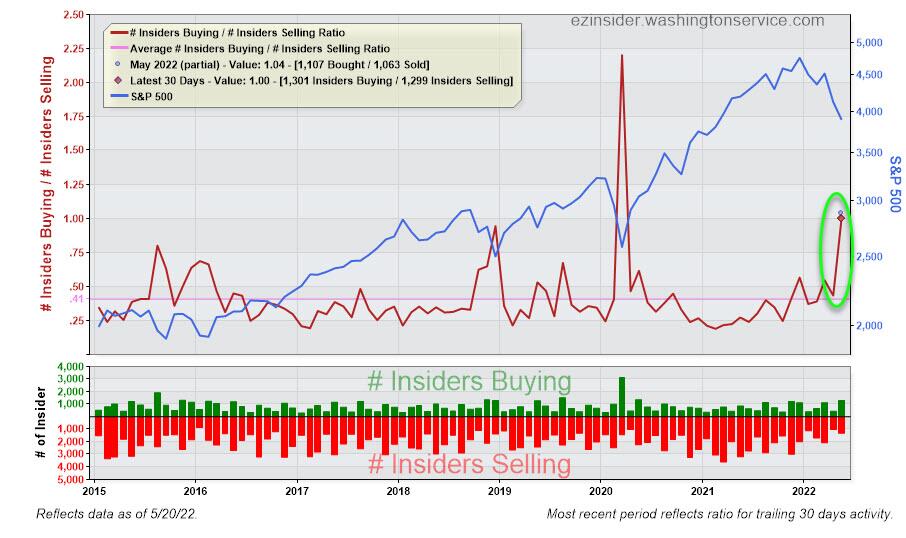
Another bullish sign for the market as of late is a return of corporate insider buying. As noted previously, corporate share buybacks have comprised roughly 40% of the market’s advance since 2011. Despite the recent selloff, corporate insider buying picked up sharply, which previously noted market bottoms.
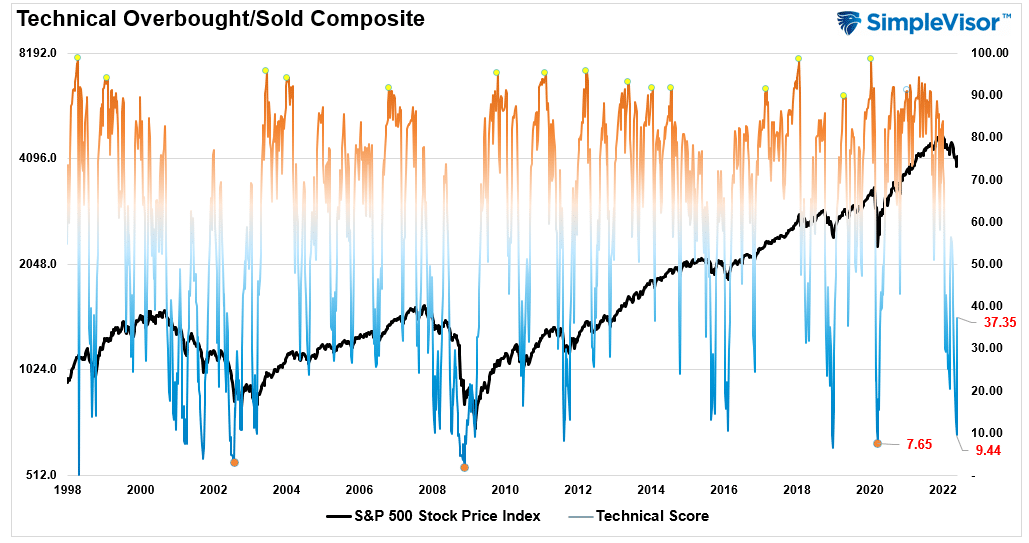
When these signals combine with negative sentiment, positioning, and, extreme oversold technical conditions, markets historically rally. Such was the case this week as the index bounced from 9.44 to 37.35.
Such brings us to two essential questions: “why now, and how long will it last?”
This Week’s MacroView

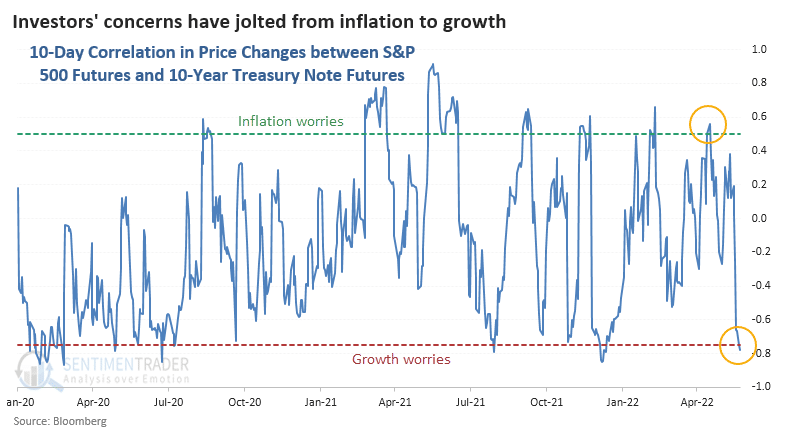
Investors Are Changing Their Focus
To answer the “why now” question, investors are changing their focus. For the last several months, investors focused solely on surging inflation rates and the related impact of more aggressive monetary policy. Investors now realize that inflation has likely peaked, economic growth is slowing, and the risk of a recession is rising. Such suggests two things:
- The Federal Reserve will probably be less aggressive on monetary policy than previously expected; and,
- Valuations will reprice for slower earnings growth.
This change of focus gets reflected in the bond market’s price action. Since the beginning of this year, investors dumped bonds as inflation surged and the Fed became increasingly hawkish. However, as CPI showed a peak in April, rates topped and have turned lower as investors are beginning to price in disinflationary pressures and slower economic growth.
We see the same as the Citi Economic and Inflation Surprise index measures. The index measures the difference between expectations and actual data reported. As shown, inflation data is weaker than expectations, and economic data remains fragile after the sharp surge in 2020.

In the short term, the decline of inflation, and interest rates, could provide a tailwind for “growth-oriented” stocks, particularly in the technology sector. Such is because declining interest rates lower the discount rate applied to earnings growth, and lower inflation levels improve their profit margins.
However, while those are some reasons to be bullish short-term, we must remain aware that as economic data weakens, earnings will weaken also. In just the last two weeks, forward earnings estimates declined by roughly 4.5%.
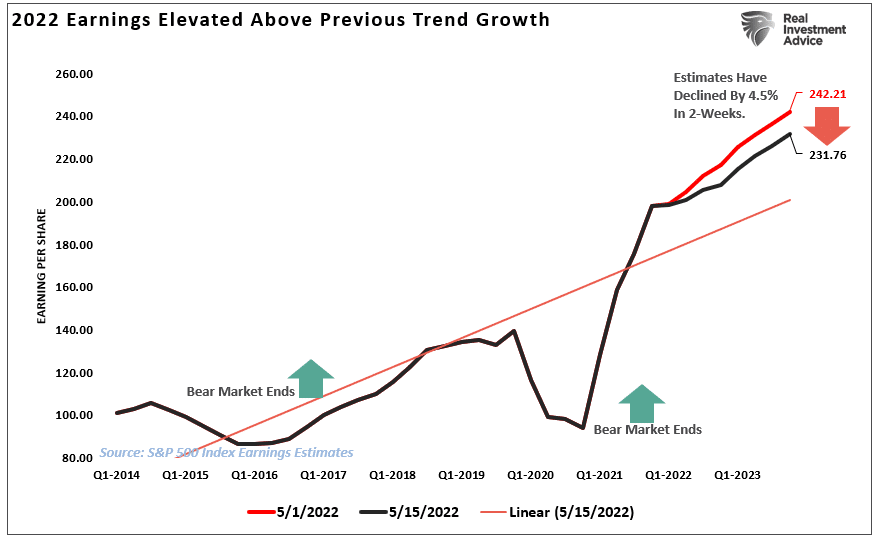
With the Fed tightening monetary policy, it is understandable that investors are shifting their focus to slower growth.
Too Many Trapped Longs
Concerning how long it will last, I suspect the rally could be powerful but short-lived as a tremendous number of investors swept up during the decline and are looking for a sellable rally. Such is a continuation of investor actions so far this year. For the most part, the 20-dma has consistently acted as the “exit” for “trapped longs.”
The market review and update above noted that the market got deeply oversold and triggered a decent “buy signal.” While that is indeed a reason to be bullish short-term, there are still many technical challenges the market must overcome to regain a more bullish trajectory.
Adding to the technical challenges, there are fundamental hurdles as well. As economic growth weakens over the next few months, even assuming the Fed doesn’t break something in the markets, the reversion of valuations will likely continue as markets realign expectations with reality.
We certainly agree with Sentiment Trader’s recent conclusion:
“The good news is that there are a large number of highly bullish signals taking place. The bad news is that it may be more accurate to say that many “typically” bullish signals are taking place. There is never any guarantee that any signal or group of signals will “work” the next time around. The primary concern is that during bear markets like 2000-2002 and 2007-2009, many purportedly bullish indicators get overwhelmed by other primary bearish factors.
The jury remains “out” on the current decline. Inflation, rising interest rates, high valuation, and a potentially slowing economy may force the market much lower.”
We continue to sell into rallies.

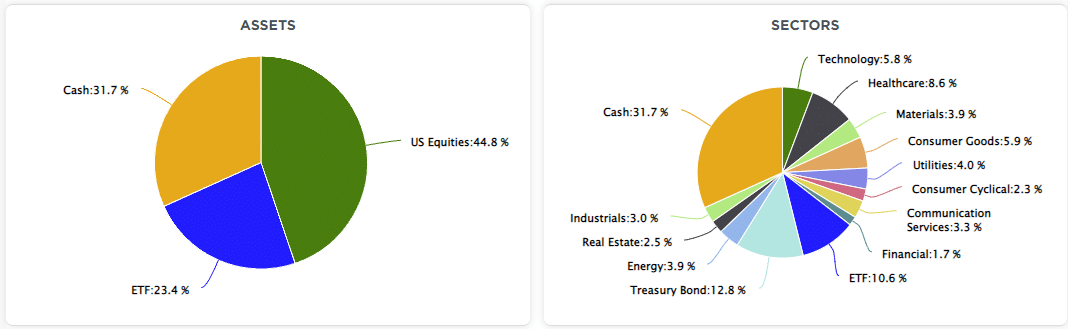
Portfolio Update
Over the last week, we made no changes to our portfolio, expecting that we would finally get the reflexive rally we discussed over the previous few weeks. It has been challenging, and the emotional pressure to “do something” has been incredible. However, as noted previously, such is where mistakes get made.
This week, the market finally mustered the beginning of a rally that could last a couple of weeks or more. We need a large enough rally to reverse the current highly bearish sentiment plaguing the market. Such will provide an excellent opportunity to reduce risk, rebalance portfolio allocations, and raise cash.
If you missed last week’s newsletter, we laid out specific actions to take on this rally.
- Properly size portfolio positions to mitigate the risk of concentrated positions.
- Rebalance portfolio allocations
- Take profits from highly overbought and extended positions.
- Sell laggards
- When you are not sure what to do, do nothing. Cash is an excellent hedge against risk.
- Don’t dismiss the value of bonds in a portfolio.
- Look for non-correlated assets to mitigate risk.
Notably, don’t try and time the market rally peak. While there are reasons to be bullish short-term, use rallies to sell into. For example, with the market above the 20-dma, take profits in overbought and extended positions, reducing them to portfolio target weights. At the 50-dma, rebalance the portfolio to a lower equity weighting and sell stocks that are not rising with the market.
However you approach the process is up to you, but trying to time the exit exactly will likely not work out well. As we have seen multiple times this year, reversals can wipe out your opportunities quickly.
Have a great week.
Market & Sector Analysis
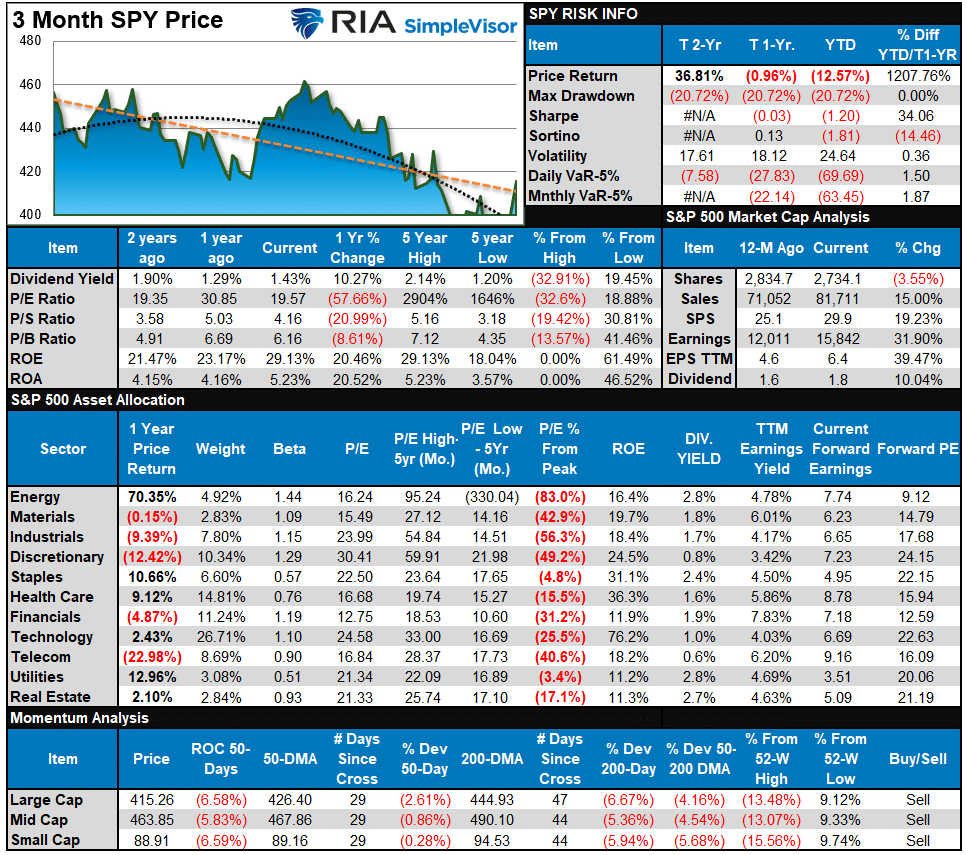
S&P 500 Tear Sheet
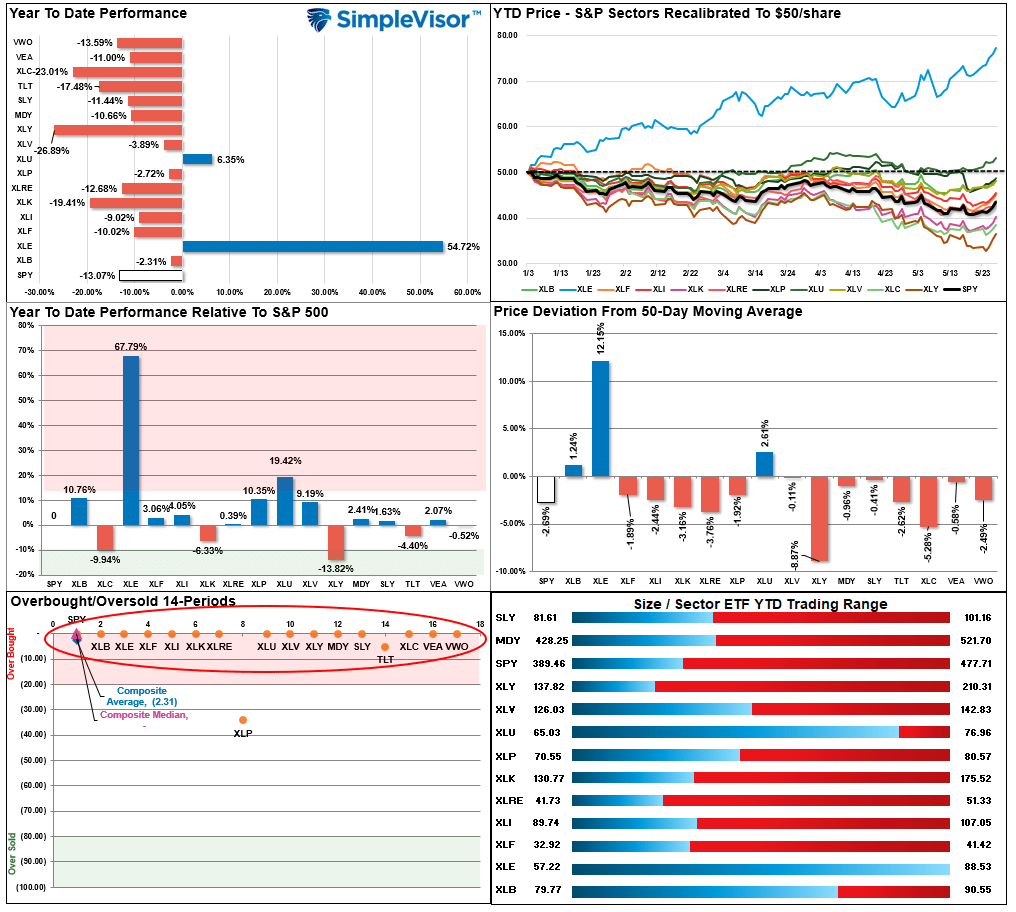
Relative Performance Analysis
Technical Composite
The technical overbought/sold gauge comprises several price indicators (RSI, Williams %R, etc.), measured using “weekly” closing price data. Readings above “80” are considered overbought, and below “20” are oversold. The current reading is 37.35 out of a possible 100.
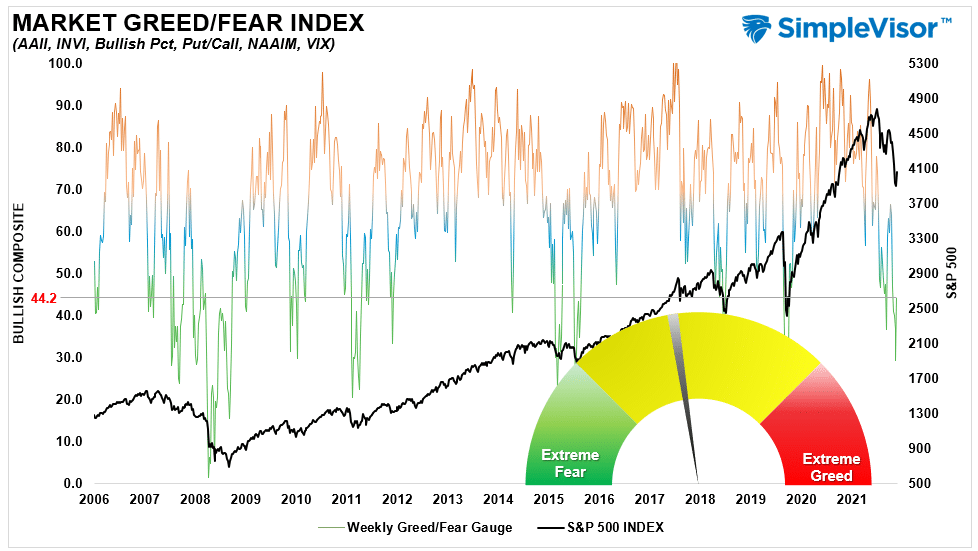
Portfolio Positioning “Fear / Greed” Gauge
The “Fear/Greed” gauge is how individual and professional investors are “positioning” themselves in the market based on their equity exposure. From a contrarian position, the higher the allocation to equities, to more likely the market is closer to a correction than not. The gauge uses weekly closing data.
NOTE: The Fear/Greed Index measures risk from 0 to 100. It is a rarity that it reaches levels above 90. The current reading is 44.2 out of a possible 100.
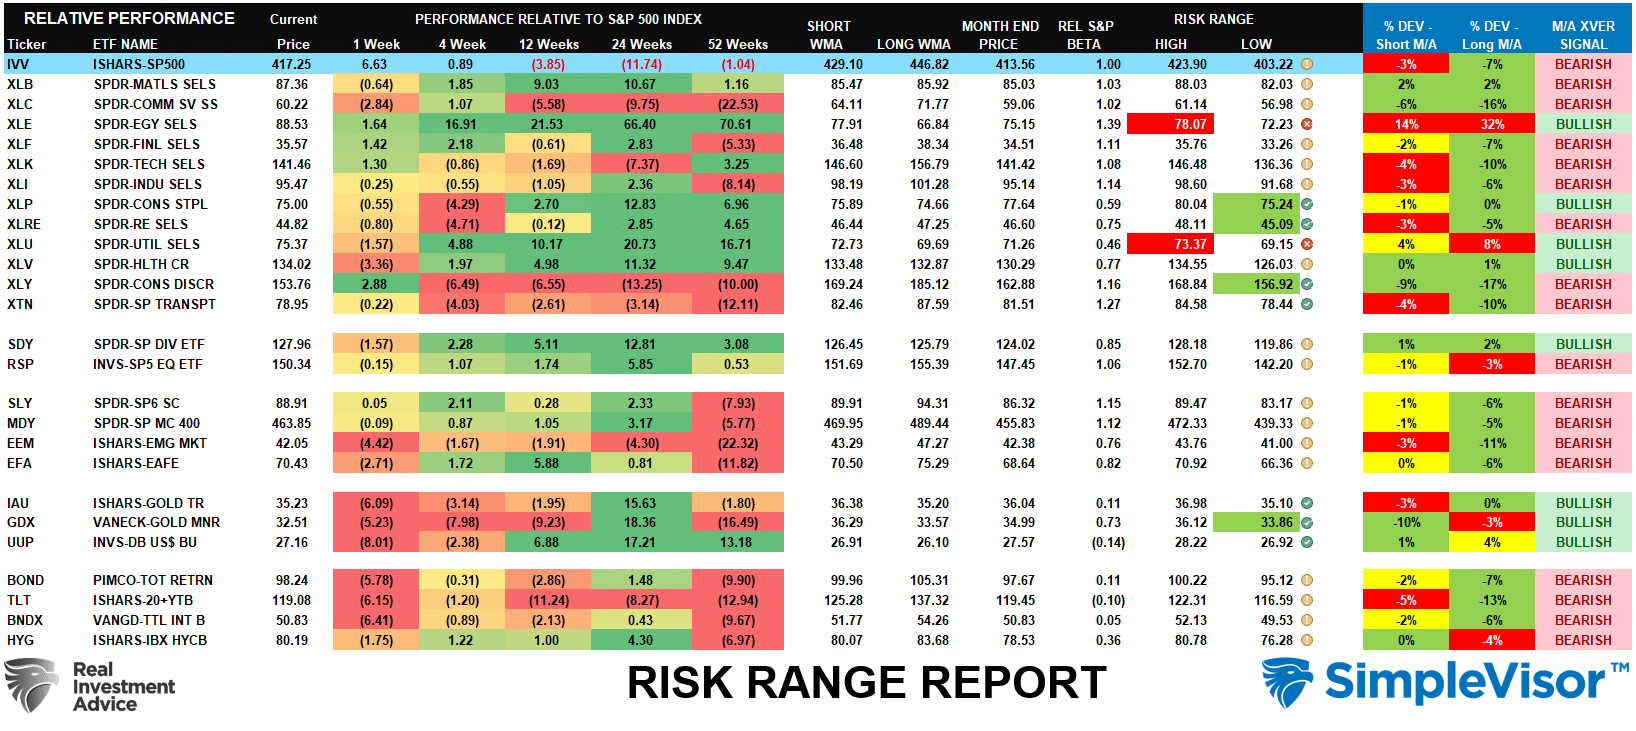
Sector Model Analysis & Risk Ranges
How To Read This Table
- The table compares the relative performance of each sector and market to the S&P 500 index.
- “M/A XVER” is determined by whether the short-term weekly moving average crosses positively or negatively with the long-term weekly moving average.
- The risk range is a function of the month-end closing price and the “beta” of the sector or market. (Ranges reset on the 1st of each month)
- The table shows the price deviation above and below the weekly moving averages.
- The complete history of all sentiment indicators is under the Dashboard/Sentiment tab at SimpleVisor.
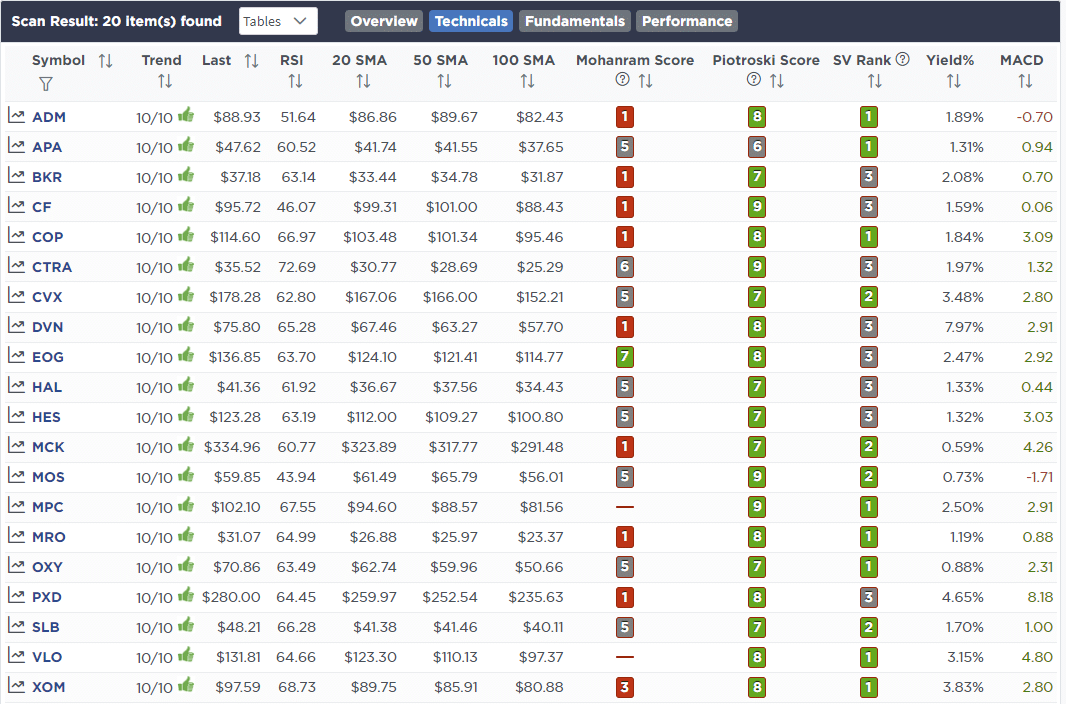
Weekly Stock Screens
Each week we will provide three different stock screens generated from SimpleVisor: (RIAPro.net subscribers use your current credentials to log in.)
This week we are scanning for the Top 20:
- Relative Strength Stocks
- Momentum Stocks
- Technically Strong With Strong Fundamentals
These screens generate portfolio ideas and serve as the starting point for further research.
(Click Images To Enlarge)
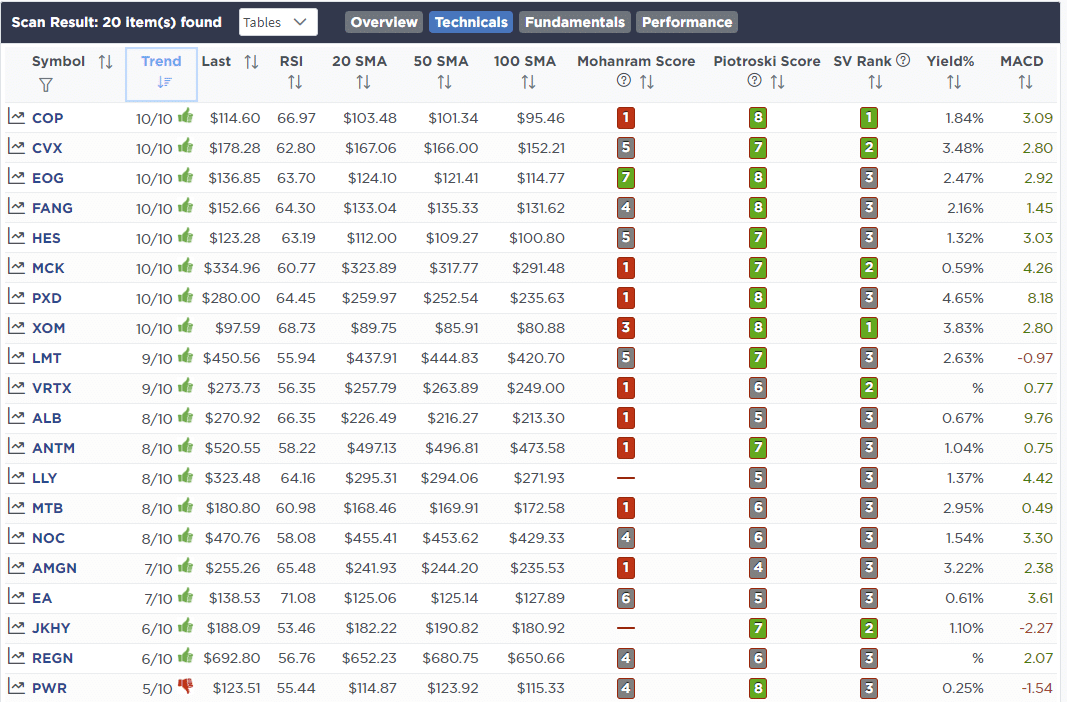
RSI Screen
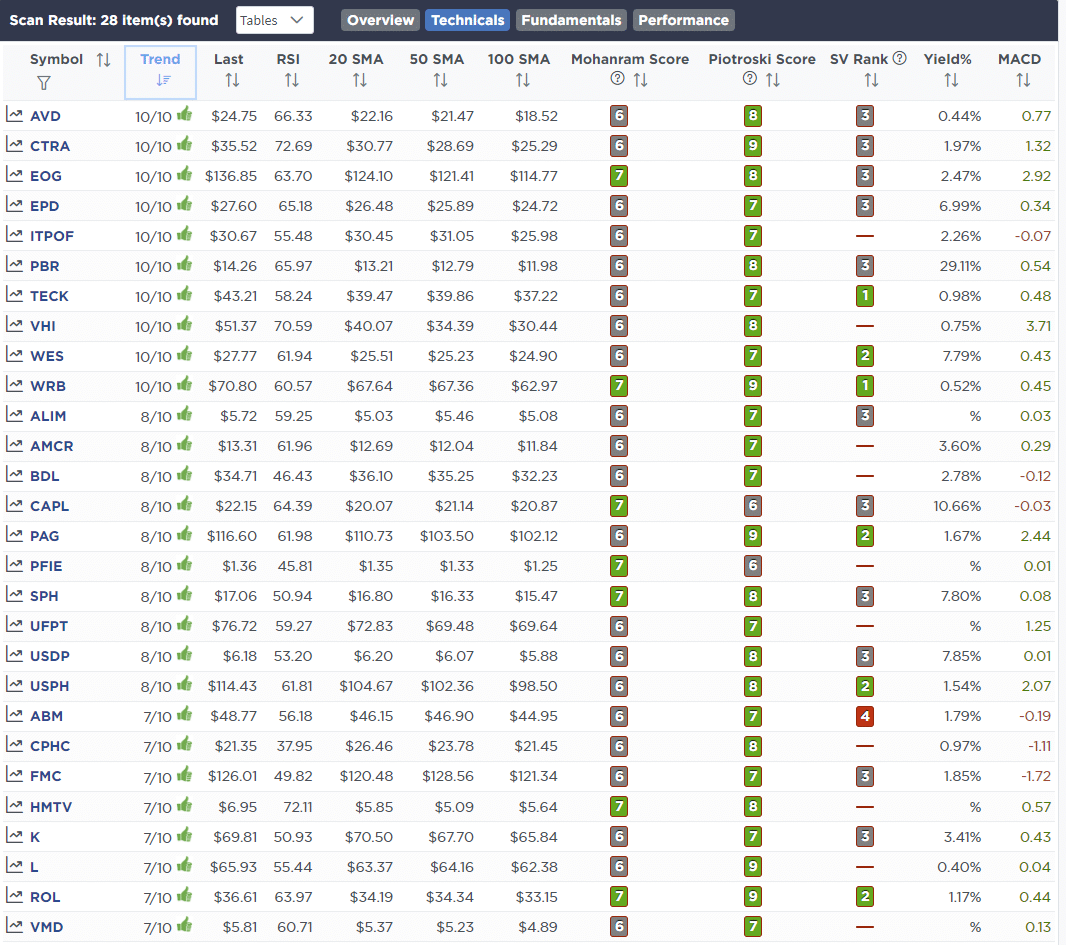
Momentum Screen
Technical & Fundamental Strength Screen
SimpleVisor Portfolio Changes
We post all of our portfolio changes as they occur at SimpleVisor:
No trades this past week.

Lance Roberts, CIO
Have a great week!


