
In this 12-31-21 issue of “Santa Claus Rally Sets Stage For January Start.”
- Santa Rally Works
- Portfolio Positioning
- Sector & Market Analysis
Follow Us On: Twitter, Facebook, Linked-In, Sound Cloud, Seeking Alpha
Is It Time To Get Help With Your Investing Strategy?
Looking for complete financial, insurance and estate planning? Need a risk-managed portfolio management strategy to grow and protect your savings? Whatever your needs are, we are here to help.
Schedule your “FREE” portfolio review today.

Administrative Note
I am on vacation this week with my family. However, I did want to provide a short update to wrap up the year. The full newsletter will return next week as we kick on 2022.
In the meantime, all of us at RIA Advisors want to wish you a very happy, and prosperous, New Year. We look forward to continuing to share our thoughts and analysis with you.
Happy New Year.
Santa Rally Works
Previously, we discussed increasing our equity exposure (10% above target allocations) to prepare for an anticipated Santa Claus rally. To wit:
During the previous three weeks, the market action has been brutal to trade at best and nauseating at worst. As shown in the chart below, stock prices have been all over the place.
Chart updated through Thursday.
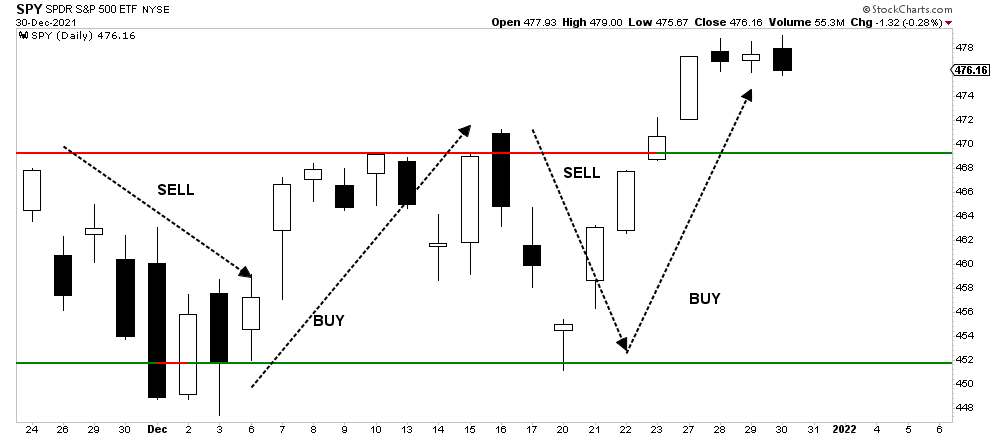
Since then, market participants got rewarded with the Santa Rally.
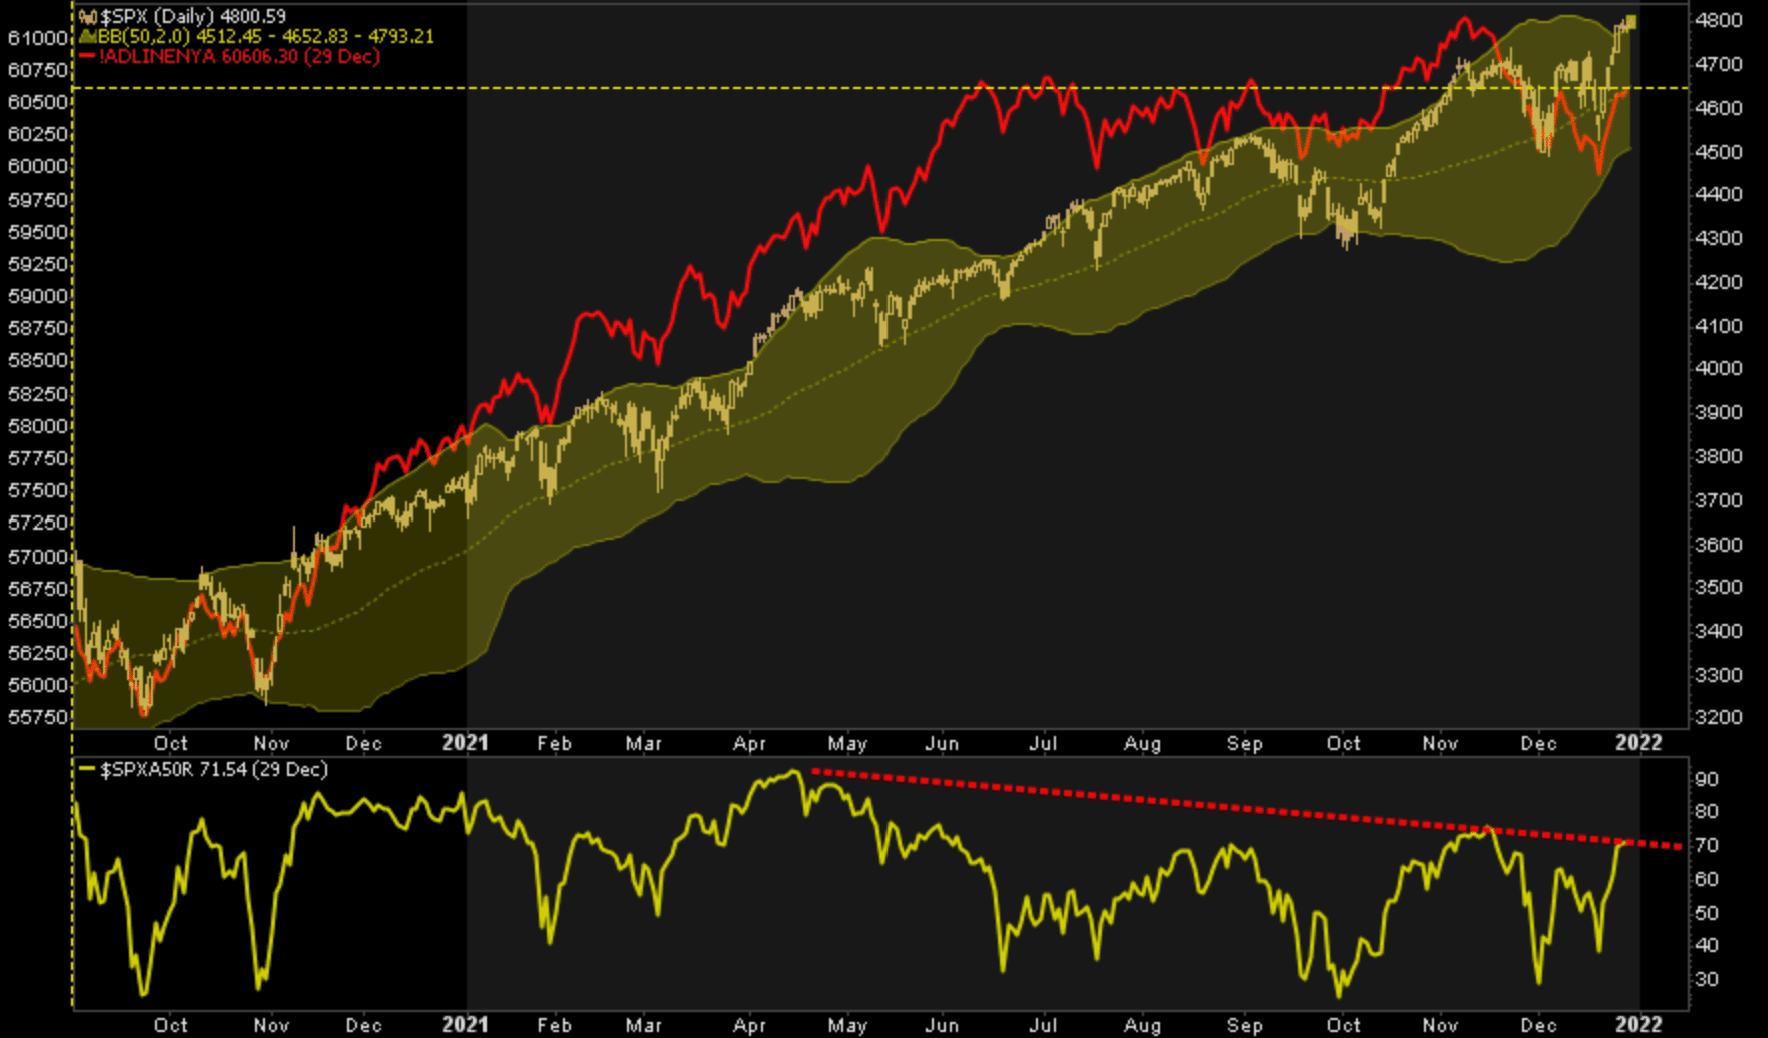
However, as shown, the market is overbought, pushing into heavy bull-trend resistance, and is nearly 10% above its 200-dma. Notably, the upper trend line repeatedly provided resistance against the advance, while the lower trend line provided the support. In September, that changed with the lower support giving way, and is now providing another resistance level to the advance.
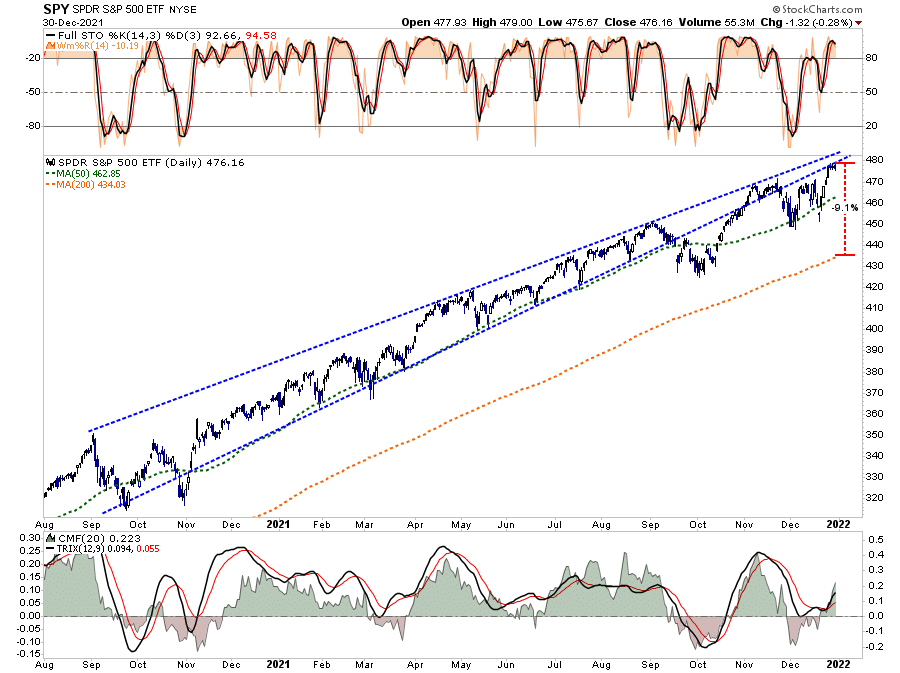
For now, the 50-dma has provided support against the sell-offs in December. So, for now, with our indicators still on short-term “buy signals,” there is no reason to get overly defensive.
However, as we move into January those resistance levels combined with overbought conditions will likely limit further upside. As such, we will likely begin reducing our overweight equity exposure back to target allocation levels.
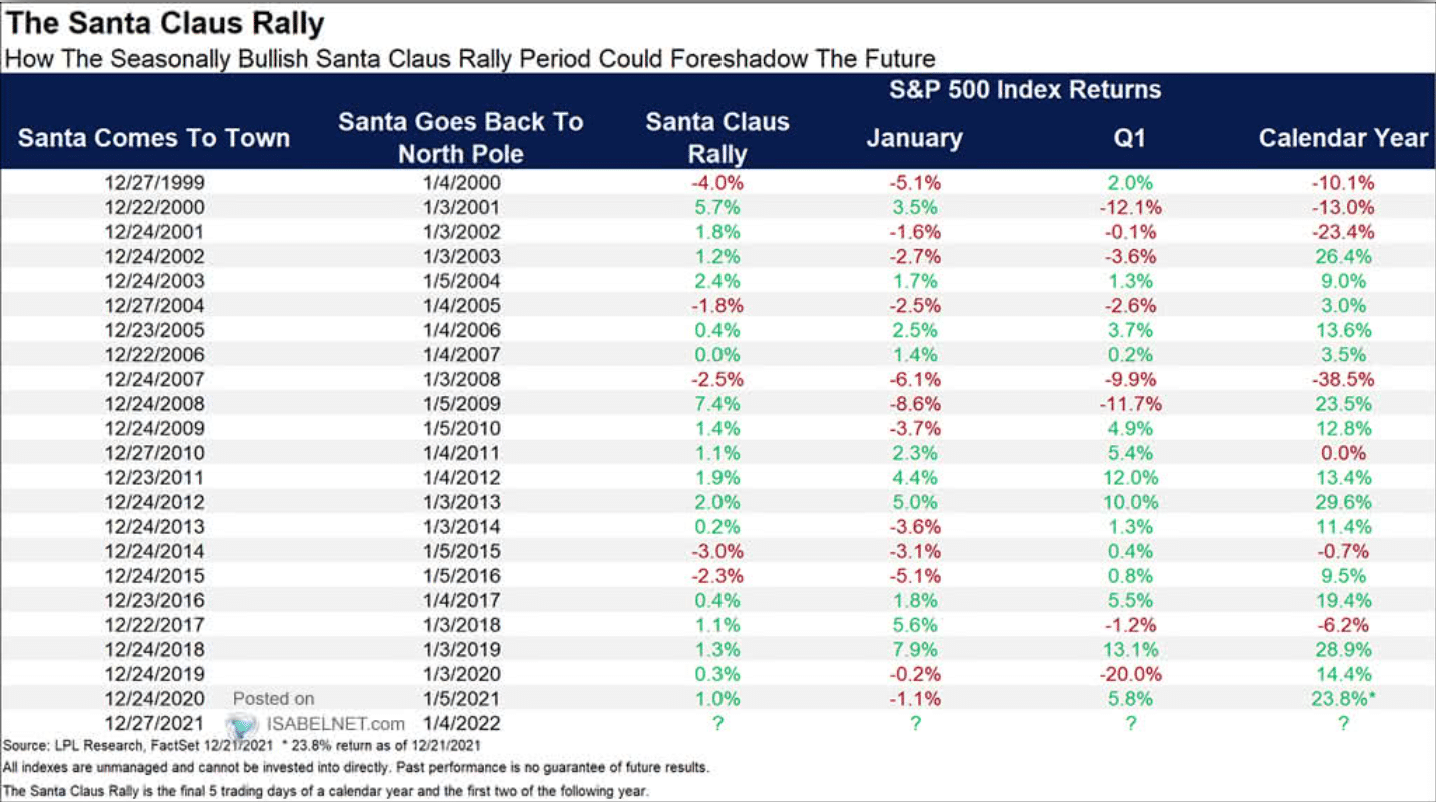
The First 5-Days Of January
With December coming to a close, the early days of January, while still bullish, tends to be much less exciting.
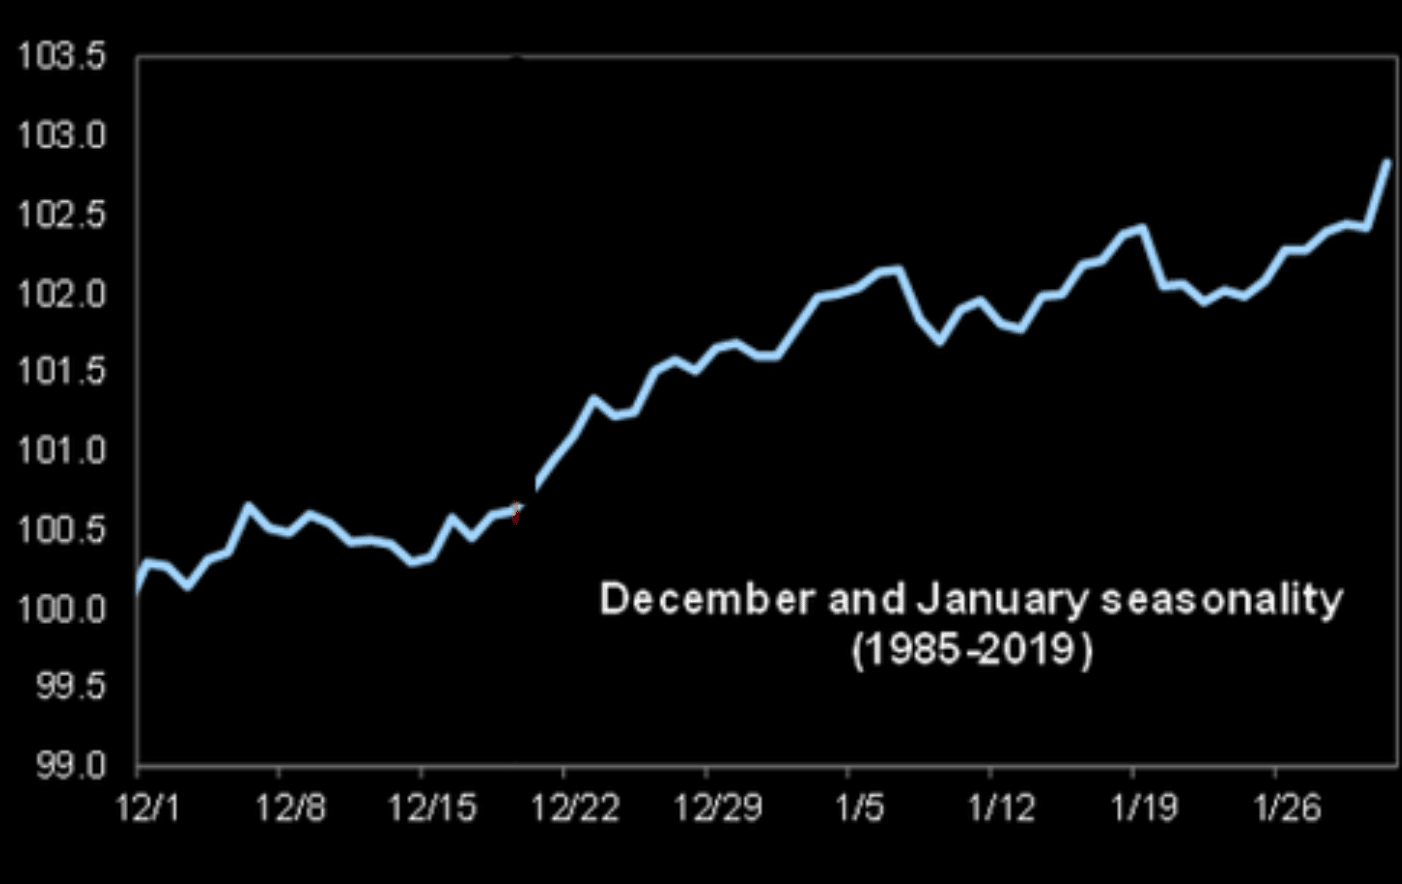
While the first 5-days of January tend to positive, as mutual funds position for the new year, it doesn’t necessarily guarantee the entire month will be positive. As shown below, since 1999, the month of January is about a coin-flip in terms of odds.
More importantly, the breadth of market remains anemic at best. As shown, both the number of stocks trading above their 50- and 200-dma remain negatively diverged from the advancing market. Secondly, the advance-decline line remains weak despite the bullish undertone. Such suggests that weakness is prevalent below the surface which creates correction risk in January.
With the market pushing into resistance, well-extended above long-term means, and overbought, the most prudent course of action heading into the new year will be a slight reduction of overweight equity positioning and a rebalancing of overall portfolio exposures.
The one thing we are watching closely is for a potential rotation to value particularly if inflationary pressures continue to remain elevated. Bonds continue to suggest a risk-off bias to the market as the deviation between bond yields and inflation continues to widen.
This Week’s MacroView

A Note On Inflation
The mid-terms are rapidly approaching and, as we discussed repeatedly over the last 2-years, artificial stimulus has the opposite effect on households than what is believed.
The repeated argument that more stimulus helps the “poor working class” is erroneous. As we argued previously, when you provide “free” money, those that provide the products and services understand that and lift prices accordingly. A recent study shows this impact.
“An analysis by the Penn Wharton Budget Model found that low- and middle-income households spent about 7% more in 2021 for the same products they bought in 2020 or 2019, an average of about $3,500.”
In other words, when you provide “free capital,” the free market economy will adjust prices to compensate for the additional demand on products and services. Those that primarily live paycheck-to-paycheck, with little excess disposable income, see that “free capital” essentially “taxed” away leaving them in the same state they were in previously. (Such is why socialism in any form does not elevate the middle class.)
While the BBB plan is touted by Democrats to be a much needed saving grace for the poor, the reality is that the additional social income will continue to create inflationary pressures that weigh on the poor the most.
Another clear indication that socialistic policies are not leading to stronger, sustained, rates of economic growth is the current yield on Treasury bonds. As shown below, the current deviation between economic growth, and subsequent inflation, as would be expected, should have resulted in higher interest rates. However, because the growth was from an artificial surge in monetary stimulus, the bond market is already pricing in a sharp reversion in growth and inflation over the next two years.

This chart will be a topic we will discuss more heading into the mid-terms.

Portfolio Update
While 2021 was a year of very low volatility, with clear bias of growth over value, we suspect that 2022 could be a very different. With the Fed hiking rates, tapering asset purchases, and global liquidity slowing, a pick up in volatility and a rotation to value would not be a surprise. We are not ready to make that commitment in portfolios yet, but it is something we are keeping a close eye on.
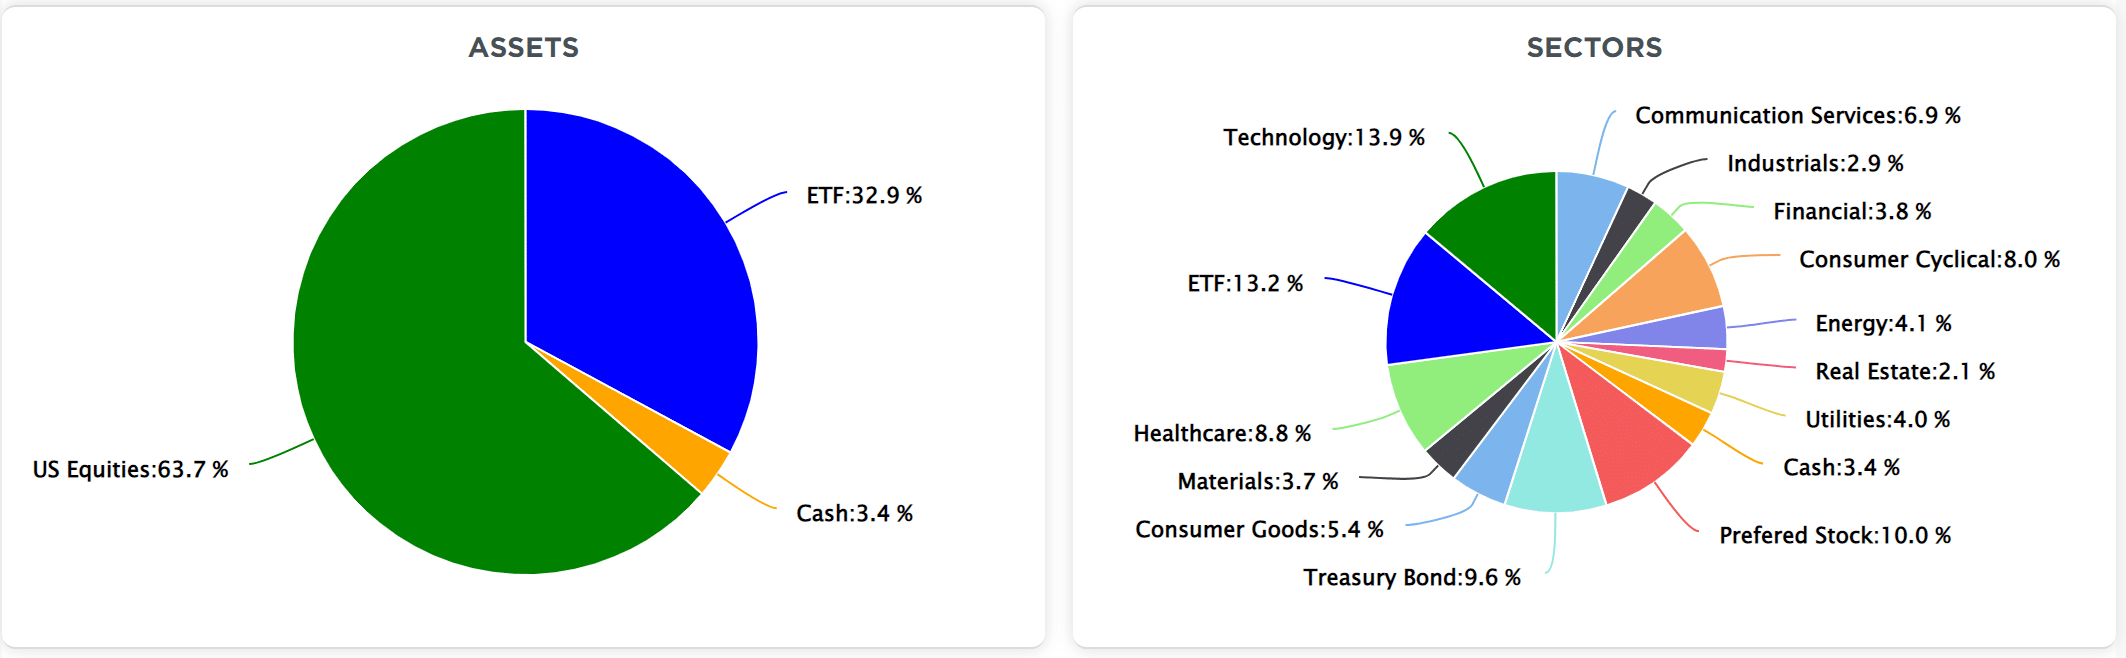
As noted, our portfolios are currently about 10% overweight in equity exposure with the majority of that overweight positioning in an S&P index fund that we are using as a trading position. (Target Model Weights: 60% stocks / 40% bonds and cash.)
We have made no changes to our portfolios over the last couple of weeks, as we prepared for the expected rally. However, moving into 2022, we will likely begin reducing equity exposure to target allocations and rebalancing risks accordingly.
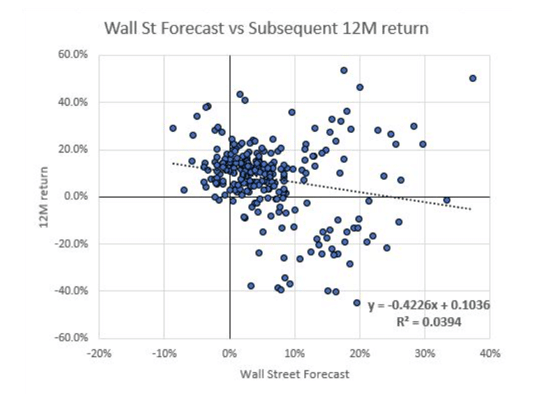
From there, we will continue to monitor the market and respond to its direction as the month of January progresses. As for the rest of the year, analysts remain exceedingly bullish. However, there is a very low correlation between their estimates and eventual outcomes.
“This is the time of year where Wall Street banks publish their year-ahead outlooks. The graph below warns us not to pay any attention to them. With an R-squared of .0394, the correlation between forecasts and subsequent returns is essentially worthless.” – Michael Lebowitz
As always, we should hope for the best. But in life, no matter what we do, from snow skiing to skydiving, we always take many precautions against the risk of getting hurt. Yet, when it comes to investing, we take no precautions other than crossing our fingers.
Such usually leads to less than optimal outcomes.
Market & Sector Analysis
Will Return Next Week

Lance Roberts, CIO
Have a great week!

