
Inside This Week’s Bull Bear Report
- Berkshire’s Dilemma Of Cash And Valuations
- How We Are Trading It
- Research Report –Dumb Money Investors At It Again
- Youtube – Before The Bell
- Market Statistics
- Stock Screens
- Portfolio Trades This Week
Bull Trend Of Market Continues Uninterrupted
Last week, we discussed the ongoing bull rally following Nvidia’s blowout earnings report. To wit:
“The rally continued this past week, spurred higher by Nvidia’s blowout earnings report Wednesday night. After a brief test of the 20-DMA, the market surged to new all-time highs on Thursday, confirming the ongoing bullish trend. As shown, the 20-DMA continues to act as crucial support for the market.”
That remains the case this past week. While the overall market traded higher into the end of the week, setting new all-time highs, the bullish November trend remains intact. While the market remains confined to that narrow rising trend channel, the MACD “buy signal” remains elevated, and an apparent deterioration in the market’s momentum remains.
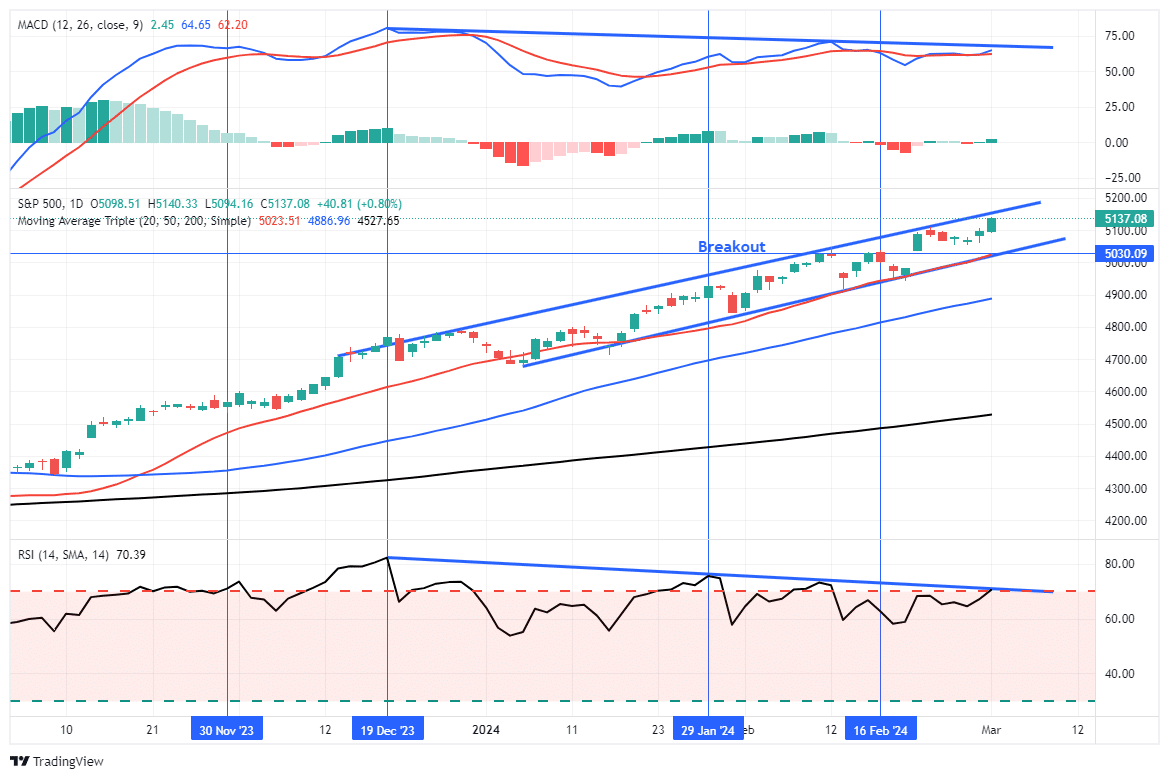
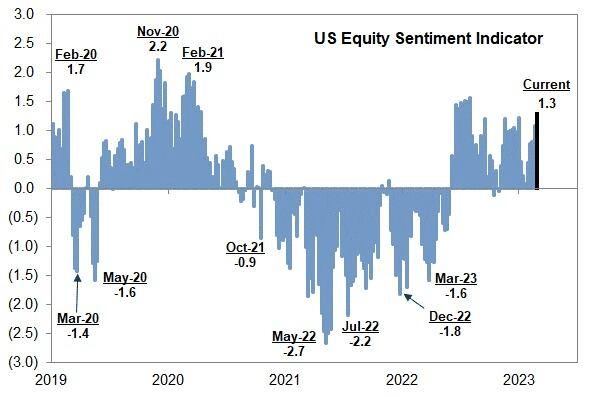
With sentiment very stretched, as shown, the risk of a short-term correction to relieve price extensions remains the most probable outcome.
Furthermore, as noted in our Daily Market Commentary on Thursday:c
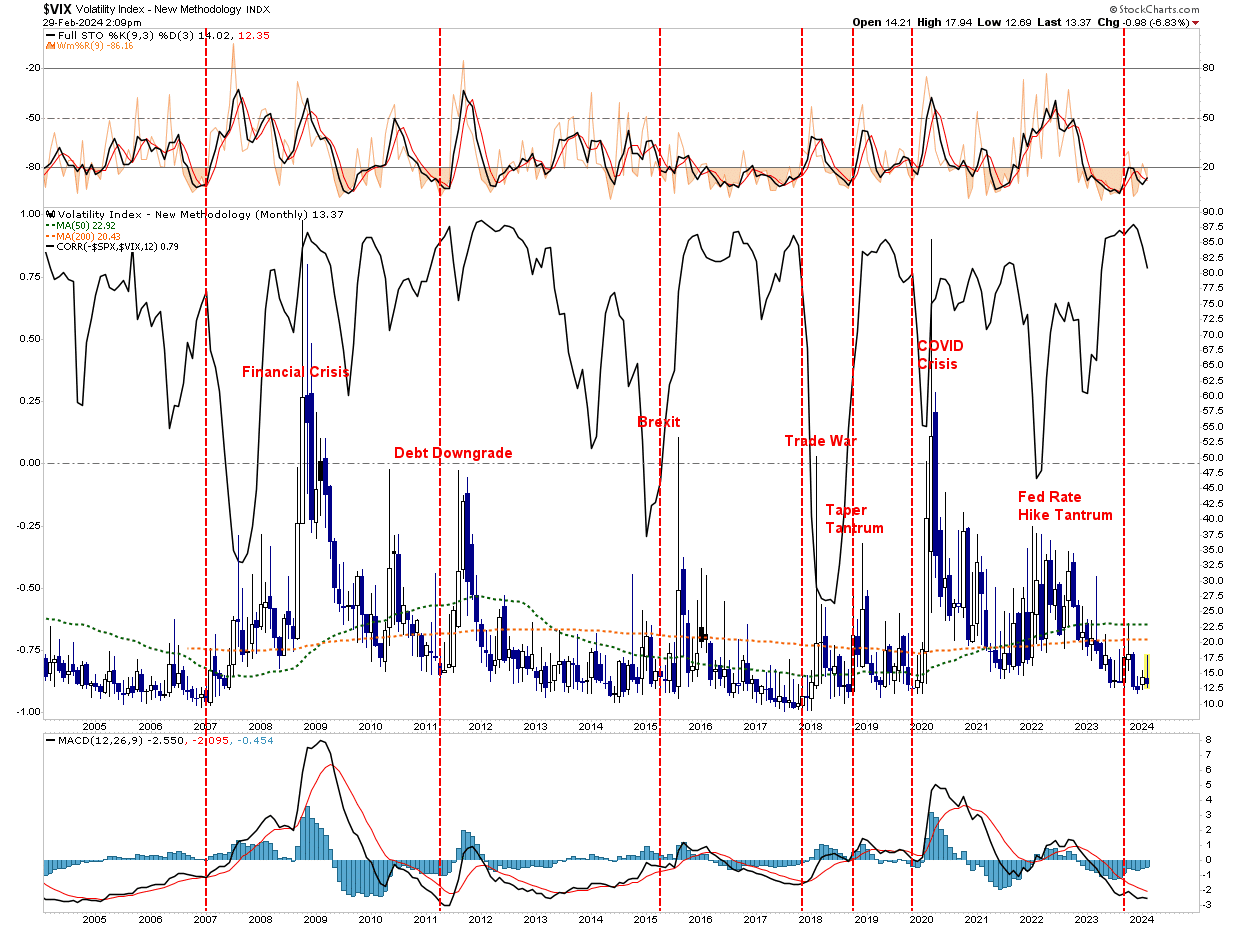
“The negative relationship between the VIX and stocks is the norm, but any deviations in the correlation and, therefore, irregular behaviors of some investors can provide market signals.”
The correlation is above +.75 on a monthly chart. The current level is on par with some more significant market corrections since the Financial Crisis. While this analysis provides a reason for caution, like any indicator, it is imperfect, and the market could move higher before a correction ensues. Therefore, we must know the risks and navigate the market accordingly.
Speaking of markets, such brings us to Berkshire’s dilemma regarding cash and valuations.
Need Help With Your Investing Strategy?
Are you looking for complete financial, insurance, and estate planning? Need a risk-managed portfolio management strategy to grow and protect your savings? Whatever your needs are, we are here to help.

Berkshire’s Dilemma Of Cash And Valuations
“One of the longest-running traditions in modern finance is that every year, one Saturday morning in late February, the world’s financial class – from professionals to mere amateurs – sit down as they have for the past 65 or so years – for an hour and read the latest Berkshire annual letter written by Warren Buffett. In that letter, the man seen by many as the world’s greatest investor, wrote down his reflections, observations, aphorisms and other thoughts which are closely parsed and analyzed for insight into what he may do next, what he thinks of the current economy and market climate, or simply for insights into how to become a better investor.” – Tyler Durden
His latest letter was no different, with various tidbits for investors to digest concerning the current market and investing environment. The one thing that got most of my attention was his comments about the recent surge in cash holdings. Berkshire’s cash and short-term investments (read T-bills) now exceed $160 billion.
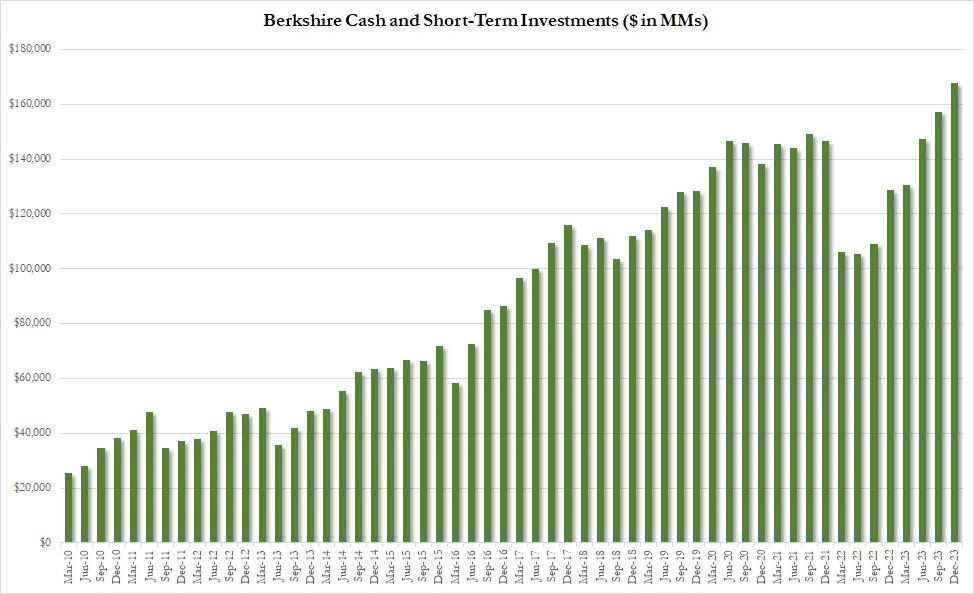
To put that into context, that cash pile alone would make Berkshire the 59th-largest economy in the world, only slightly smaller than Ukraine.

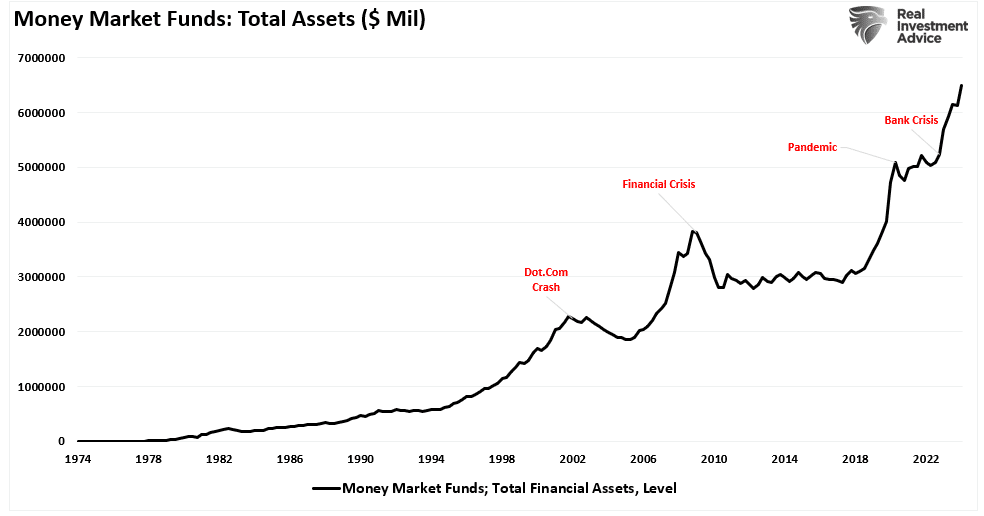
Of course, it isn’t just Berkshire that holds a lot of cash. Money market funds have continued to surge, hitting a record of $6.4 Trillion as of January.
As discussed previously, most money-market account balances belong to corporations and other entities. To wit:
“You will notice the bulk of the money is in Government Money Market funds. These particular types of money market funds often have much higher account minimums (from $100,000 to $1 million), suggesting these funds are not retail investors. (Those would be the smaller balances of prime retail funds.)
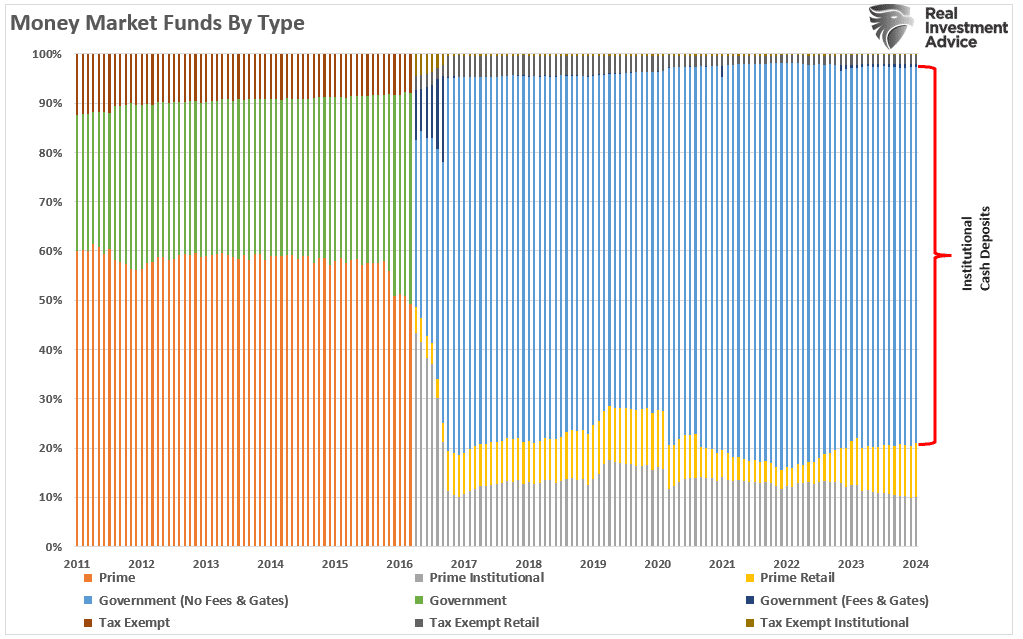
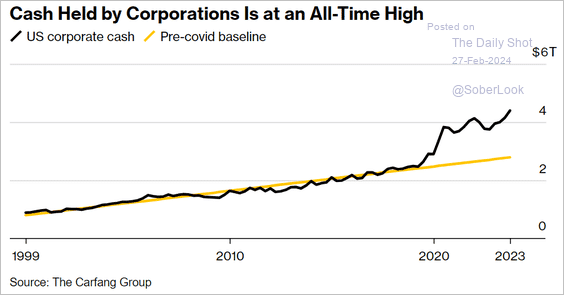
As shown below, more than $4 Trillion of that $6.4 Trillion belongs to corporations, primarily large-capitalization companies like Berkshire, Apple, Google, Microsoft, Meta, Amazon, and the rest.
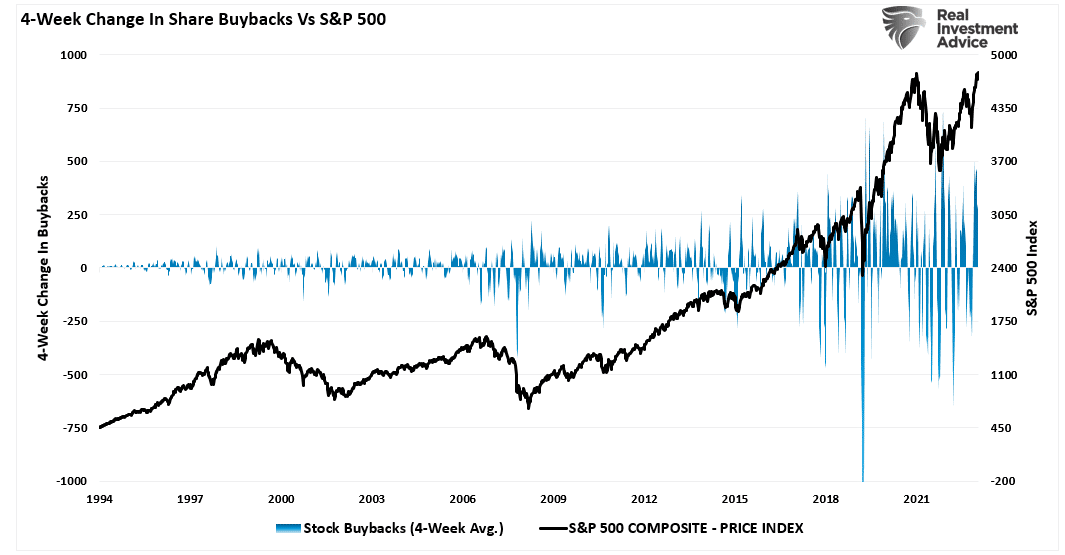
While much of the media continues to hope those funds will flow into the financial markets, the reality is that these dollars are set aside for capital investments, operations, and, of course, buybacks.
“Since the “Great Financial Crisis,” one of the primary uses of corporate “cash on the sidelines” has been for share repurchases to boost earnings. As noted previously, as much as 40% of the bull market since 2012 can be attributed to share buybacks alone.
While Berkshire continues to execute buybacks, Buffett knows how those purchases should be made.
“Such repurchases increase your participation in every asset Berkshire owns. To this obvious but often overlooked truth, I add my usual caveat: All stock repurchases should be price-dependent. What is sensible at a discount to business value becomes stupid if done at a premium.“
Unfortunately, following the financial crisis, most companies committed to buybacks at massive premiums to benefit insiders more than shareholders. Such was our previous commentary on Buffett’s views on buybacks.
However, this brings us to Berkshire’s real dilemma of cash.
Berkshire’s Dilemma
In “Small-Cap Stocks May Be At Risk,” we discussed the importance of economic outlooks on a company’s commitment to capital investments.
“Furthermore, if the economy and the underlying demand were as strong as recent headlines suggest, the business would be ramping up capital expenditures to meet that demand. However, such is not the case regarding capital expenditures and actual versus planned employment.”
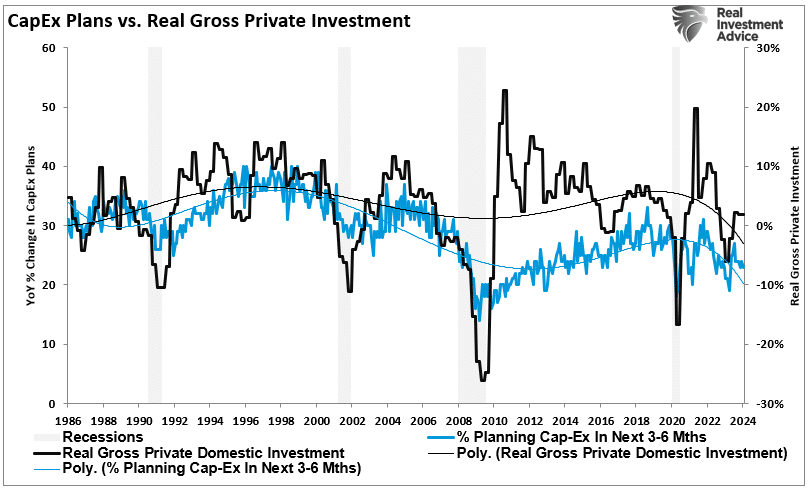
The problem with capital investments is that they take time to generate a profitable return that accretes to the business’s bottom line. The same goes for acquisitions. More importantly, concerning acquisitions, they must both be accretive to the company and reasonably priced. Such is Berkshire’s current dilemma.
“There remain only a handful of companies in this country capable of truly moving the needle at Berkshire, and they have been endlessly picked over by us and by others. Some we can value; some we can’t. And, if we can, they have to be attractively priced.”
This was an essential statement. Here is one of the most intelligent investors in history, suggesting that he cannot deploy Berkshire’s massive cash hoard in meaningful size due to an inability to find acquisition targets that are reasonably priced. With a $160 war chest, there are plenty of companies that Berkshire could either acquire outright, use a stock/cash offering, or acquire a controlling stake in. However, given the rampant increase in stock prices and valuations over the last decade, they are not reasonably priced.
Buffett’s Favorite Measure
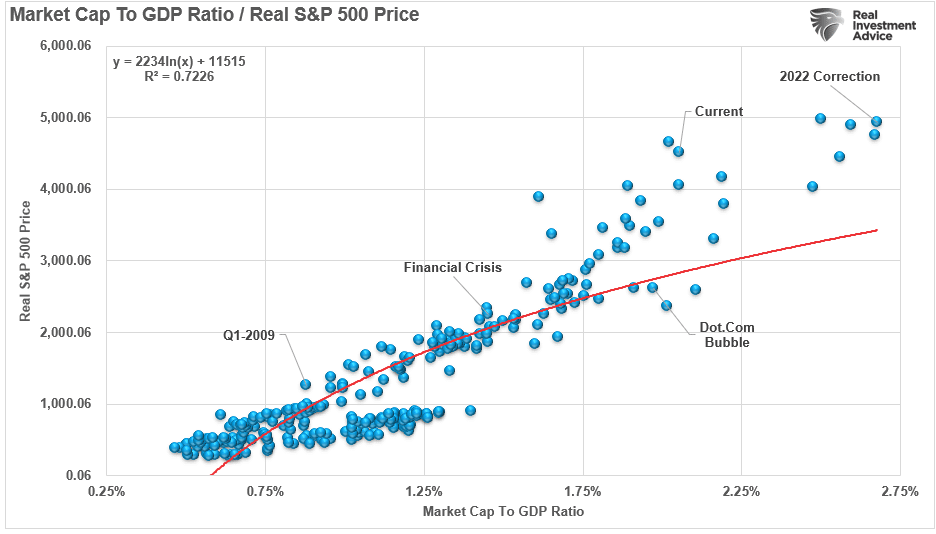
One of Warren Buffett’s favorite valuation measures is the market capitalization to GDP ratio. I have modified it slightly to use inflation-adjusted numbers. The simplicity of this measure is that stocks should not trade above the value of the economy. This is because economic activity provides revenues and earnings to businesses.

As discussed in “Stock Markets Are Detached From Everything,” the current environment is anything but opportunistic for a value investor like Warren Buffett. To wit:
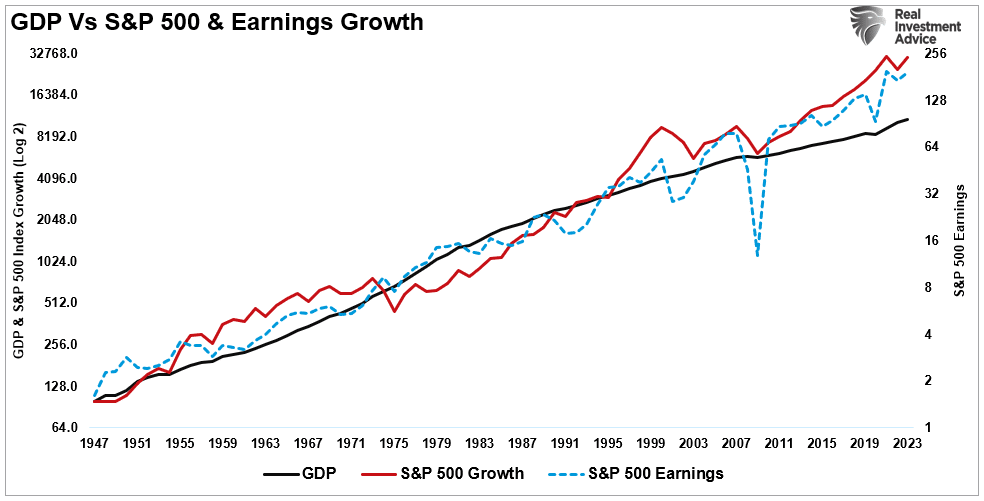
“While stock prices can deviate from immediate activity, reversions to actual economic growth eventually occur. Such is because corporate earnings are a function of consumptive spending, corporate investments, imports, and exports. The market disconnect from underlying economic activity is due to psychology. Such is particularly the case over the last decade, as successive rounds of monetary interventions led investors to believe ‘this time is different.’”
There is a correlation between economic activity and the rise and fall of equity prices. For example, in 2000 and again in 2008, corporate earnings contracted by 54% and 88%, respectively, as economic growth declined. Such was despite calls for never-ending earnings growth before both previous contractions.
As earnings disappointed, stock prices adjusted by nearly 50% to realign valuations with weaker-than-expected current earnings and slower future earnings growth. So, while stock markets are once again detached from reality, looking at past earnings contractions suggests such deviations are not sustainable.
With the current market capitalization to GDP ratio data point outside the historical range as economic growth slows, you can understand Berkshire’s dilemma of deploying cash.
The risk of overpaying for assets comes down to sustaining current profitability.
Price-To-Profits Sends A Warning
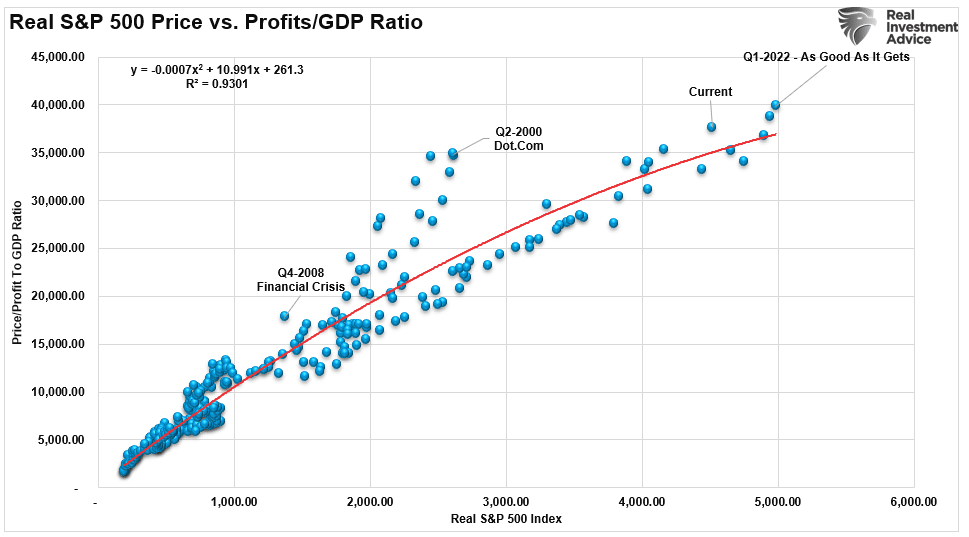
Berkshire’s issue of finding “reasonably priced” acquisitions is not just one of being overly picky about opportunities. The reality is that after more than a decade of monetary infusions and zero interest rates, most companies are priced well beyond what economic dynamics can support. Besides Berkshire’s measure of market capitalization relative to GDP, we can also look at corporate profits as they relate to economic growth. Again, this analysis is unsurprising, given that economic growth generates the revenue to provide corporate profits.
The chart below measures the cumulative change in the S&P 500 index compared to corporate profits. Again, when investors pay more than $1 for $1 worth of profits, those excesses are eventually reversed. The current deviation of the market from underlying profitability suggests that eventual reversion will be pretty unkind to investors.

The correlation is more evident in the market versus the price-to-corporate profits ratio. Again, since corporate profits are ultimately a function of economic growth, the correlation is not unexpected. Hence, neither should the impending reversion in both series. Currently, that ratio is approaching levels that preceded more significant market reversions to realign the markets to profitability.

The high correlation, as noted, is unsurprising. Investors should expect an eventual reversal, with the market on the more extreme end of the valuation spectrum. However, those reversals can take much longer to occur than logic would assume.
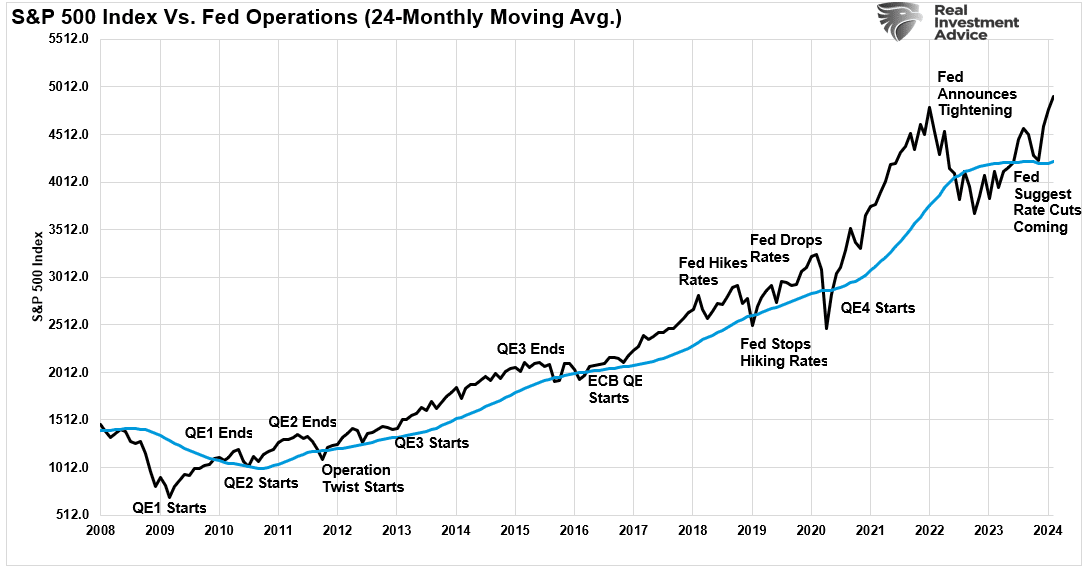
To this point, it has seemed to be a simple formula: as long as the Fed remains active in supporting asset prices, the deviation between fundamentals and fantasy doesn’t matter. It remains a hard point to argue.
However, the historical “mean reversion” process has yet to be completed, which has always followed bull markets. This should not surprise anyone, as asset prices eventually reflect the underlying reality of corporate profitability and economic growth.
Interestingly, this is a point Warren Buffett specifically noted in his letter.
“Occasionally, markets and/or the economy will cause stocks and bonds of some large and fundamentally good businesses to be strikingly mispriced. Indeed, markets can – and will – unpredictably seize up or even vanish as they did for four months in 1914 and for a few days in 2001. If you believe that American investors are now more stable than in the past, think back to September 2008. Speed of communication and the wonders of technology facilitate instant worldwide paralysis, and we have come a long way since smoke signals. Such instant panics won’t happen often – but they will happen.”
It’s just something to consider.
How We Are Trading It
There is a risk of a correction over the next month. With the markets being excessively optimistic, overbought, and deviating above long-term means, we suggest that investors continue to hold some excess cash and wait for a better opportunity to deploy that capital.
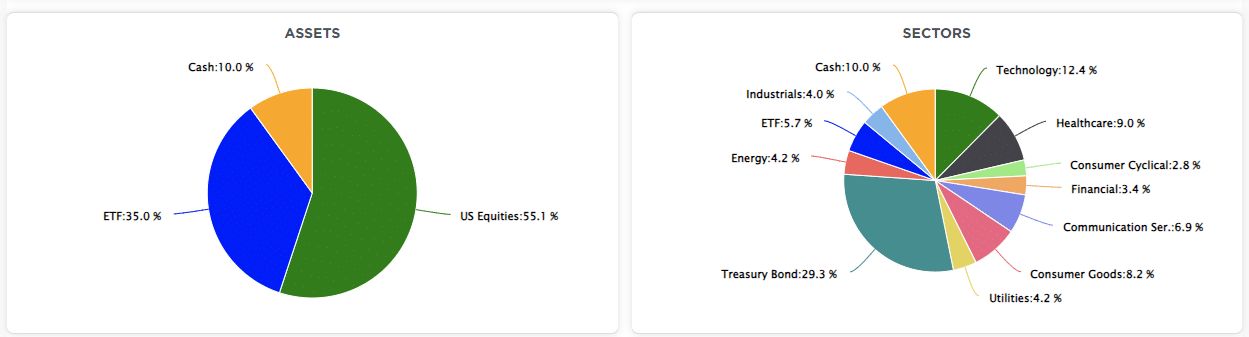
With the bulk of earnings for the S&P 500 behind us by the end of this coming week, we should start to see where markets are stabilizing. As discussed previously, we have yet to see a meaningful rotation into value from growth, leaving this market confined to a smaller number of winners versus losers. We suspect that will change at some point, and our portfolio seems well positioned with some value balanced against growth for such a rotation.
Given we suspect a further correction is forthcoming, we suggest reverting to basic portfolio management rules to reduce portfolio risks for now.
- Trim Winning Positions back to their original portfolio weightings. (ie. Take profits)
- Sell Those Positions That Aren’t Working. If they don’t rally with the market during a bounce, they will decline when it sells off again.
- Move Trailing Stop Losses Up to new levels.
- Review Your Portfolio Allocation Relative To Your Risk Tolerance. If you have an aggressive allocation to equities, consider raising cash levels and increasing fixed income accordingly to reduce relative market exposure.
The market remains quite bullish, but that is also when the risk of a reversal is the greatest.
Have a great week.
Research Report

Subscribe To “Before The Bell” For Daily Trading Updates
We have set up a separate channel JUST for our short daily market updates. Please subscribe to THIS CHANNEL to receive daily notifications before the market opens.
Click Here And Then Click The SUBSCRIBE Button
Subscribe To Our YouTube Channel To Get Notified Of All Our Videos
Bull Bear Report Market Statistics & Screens

SimpleVisor Top & Bottom Performers By Sector

S&P 500 Weekly Tear Sheet

Relative Performance Analysis
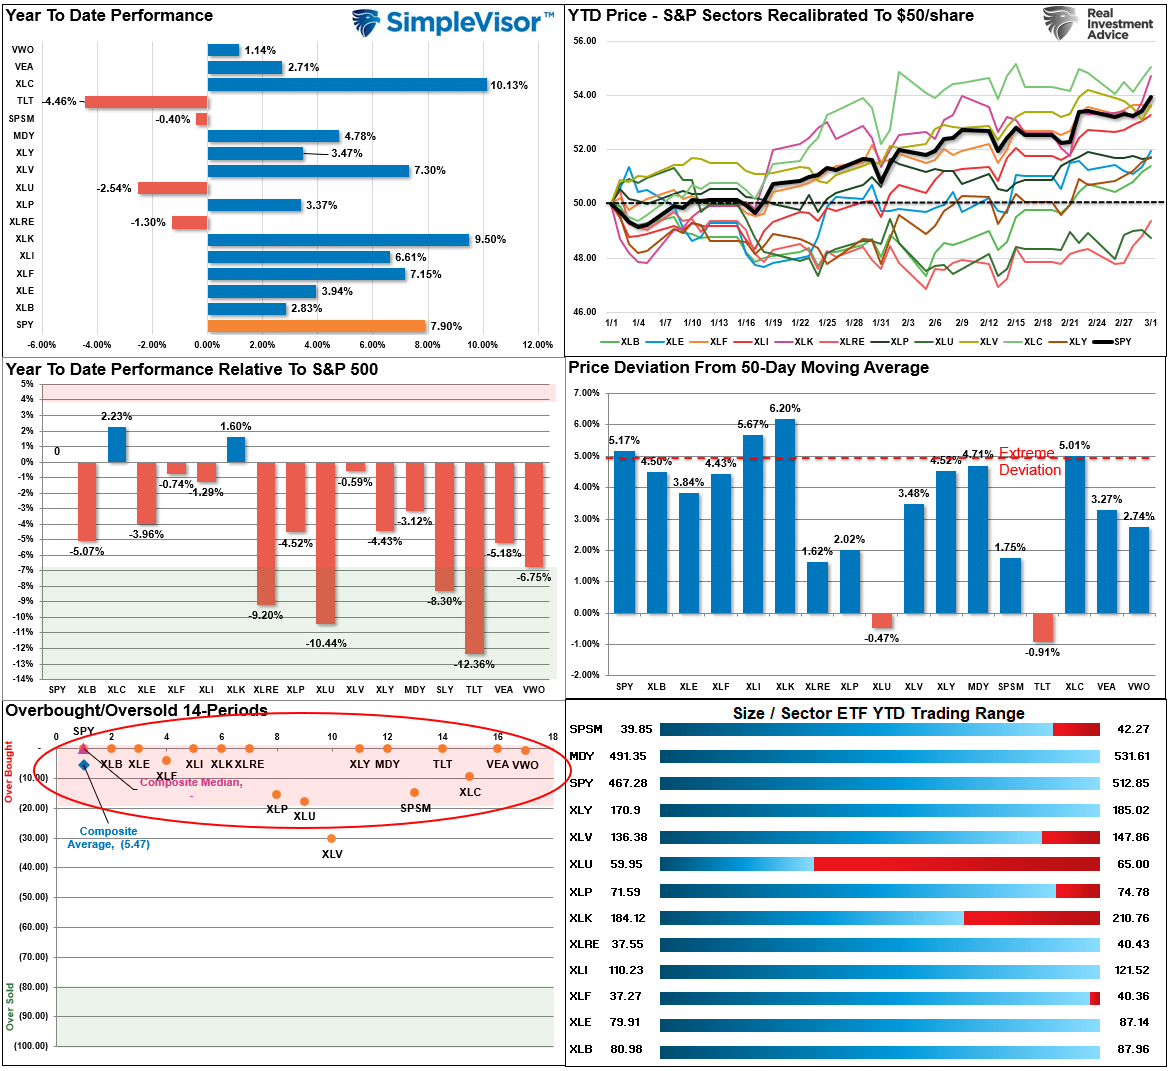
The bull trend in stocks remained uninterrupted this past week, with the S&P 500 hitting all-time highs after weakness early in the week. However, the push higher put most sectors and markets back to extreme short-term overbought conditions, which will likely limit further upside over the next week as the market continues trading in a tight range since the November lows. The bullish backdrop remains very strong, and there is little reason for an abundance of caution. However, profit-taking and risk management remain prudent, with most markets and sectors overbought and deviating from their 50-DMA.
Technical Composite
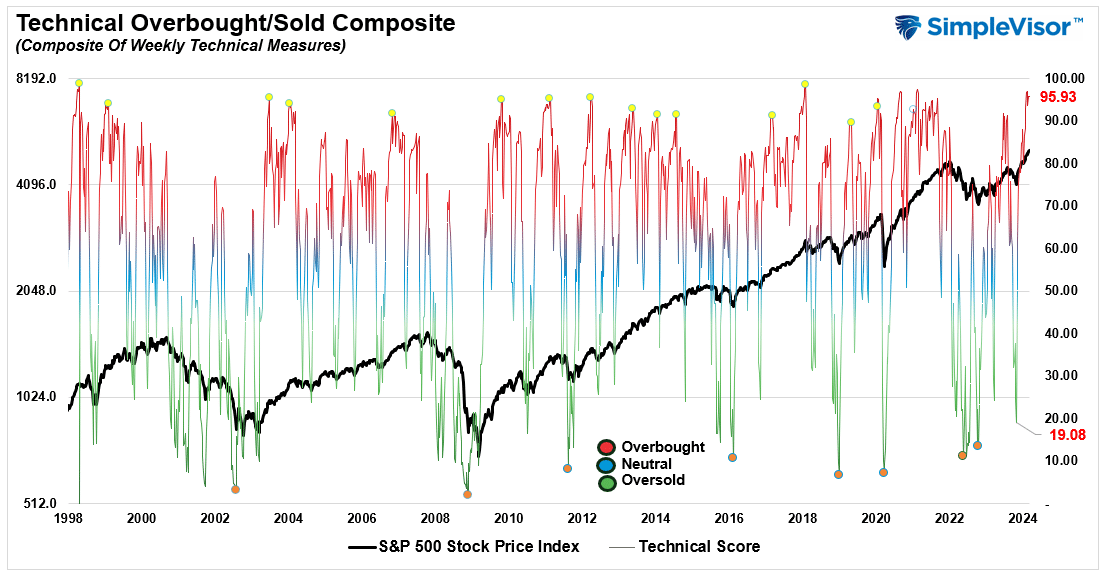
The technical overbought/sold gauge comprises several price indicators (R.S.I., Williams %R, etc.), measured using “weekly” closing price data. Readings above “80” are considered overbought, and below “20” are oversold. The market peaks when those readings are 80 or above, suggesting prudent profit-taking and risk management. The best buying opportunities exist when those readings are 20 or below.
The current reading is 95.93 out of a possible 100.
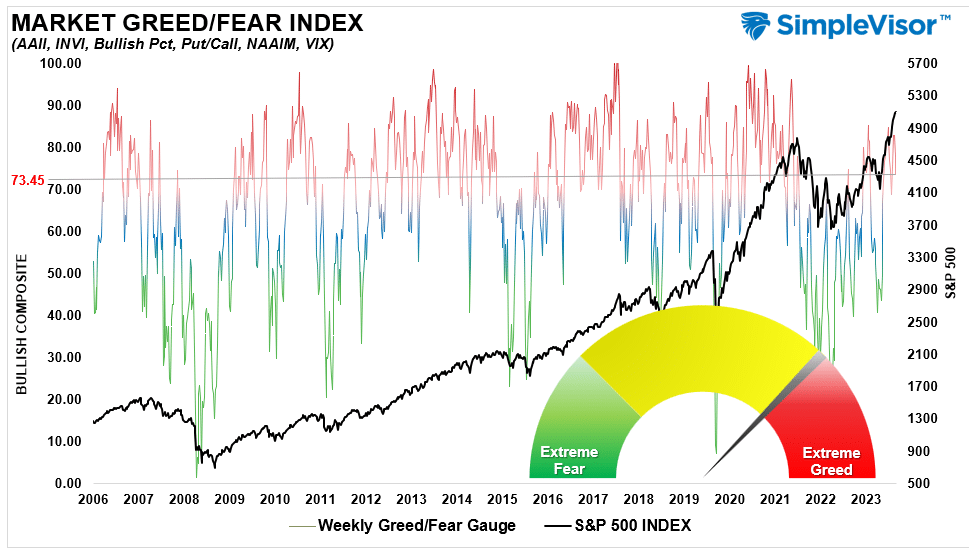
Portfolio Positioning “Fear / Greed” Gauge
The “Fear/Greed” gauge is how individual and professional investors are “positioning” themselves in the market based on their equity exposure. From a contrarian position, the higher the allocation to equities, the more likely the market is closer to a correction than not. The gauge uses weekly closing data.
NOTE: The Fear/Greed Index measures risk from 0 to 100. It is a rarity that it reaches levels above 90. The current reading is 73.45 out of a possible 100.
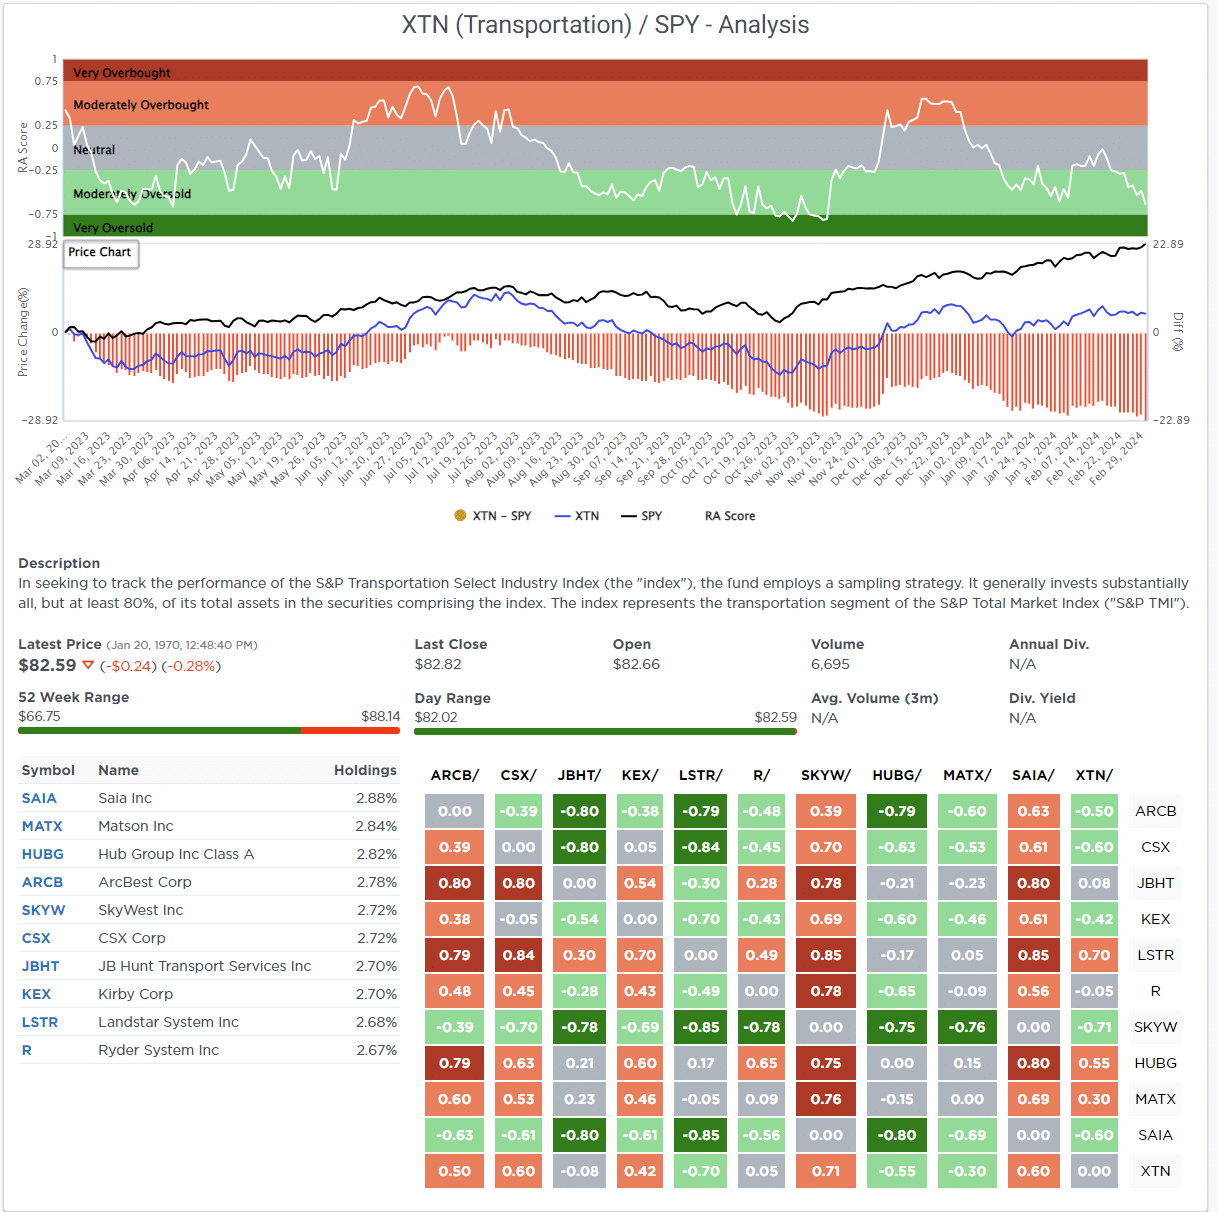
Relative Sector Analysis
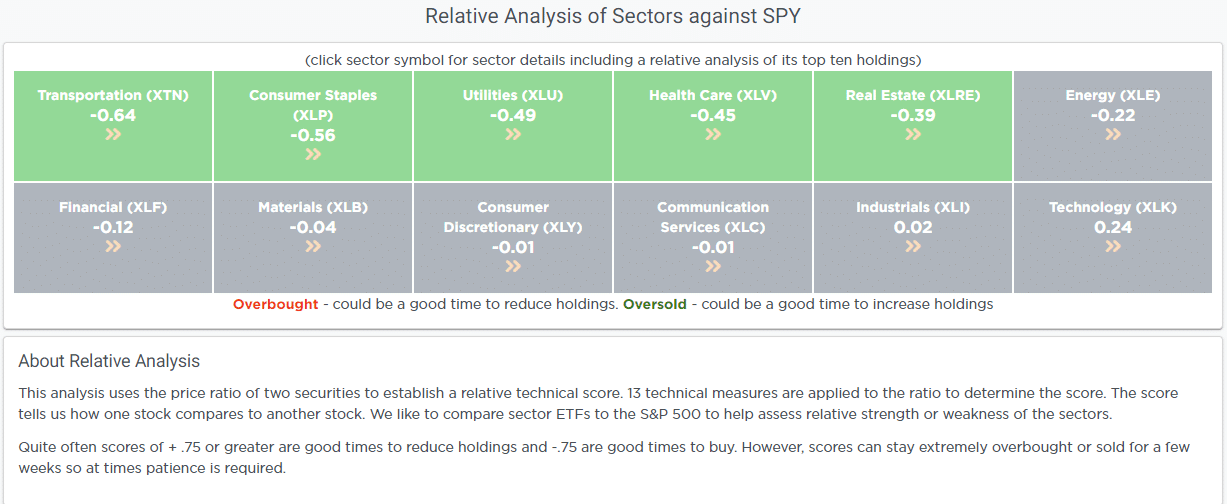
Most Oversold Sector Analysis
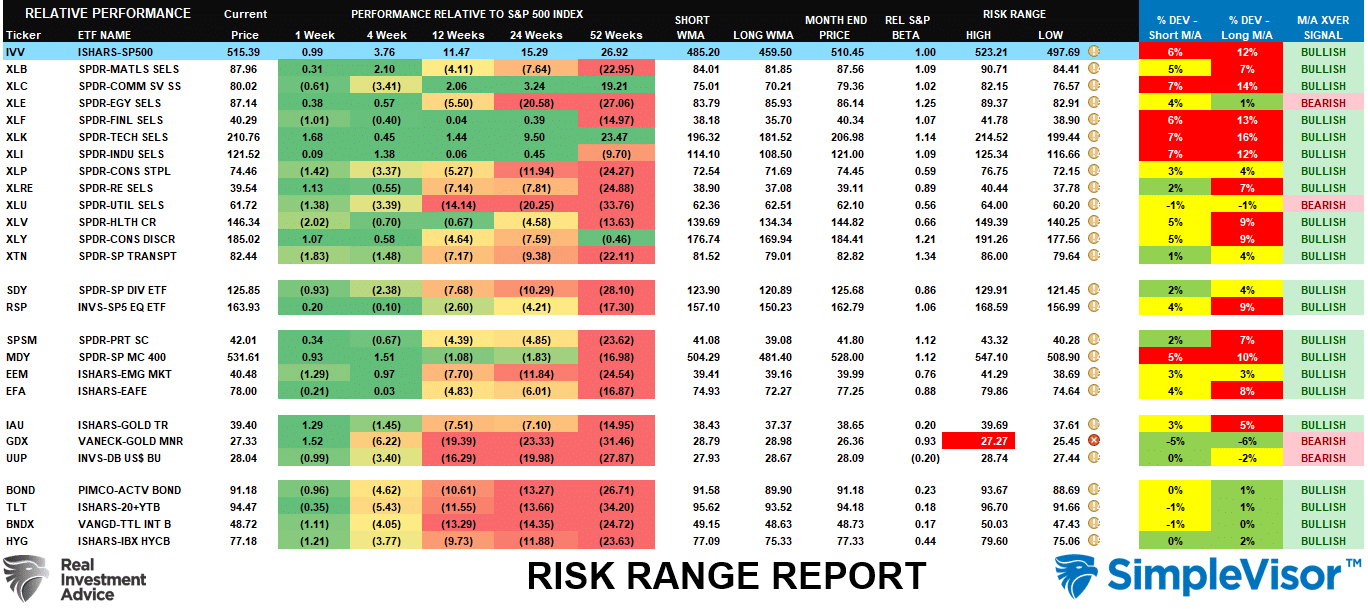
Sector Model Analysis & Risk Ranges
How To Read This Table
- The table compares the relative performance of each sector and market to the S&P 500 index.
- “MA XVER” (Moving Average Crossover) is determined by the short-term weekly moving average crossing positively or negatively with the long-term weekly moving average.
- The risk range is a function of the month-end closing price and the “beta” of the sector or market. (Ranges reset on the 1st of each month)
- The table shows the price deviation above and below the weekly moving averages.
The monthly Risk / Reward ranges for the month reset on Friday as we began the month of March. However, such does not mean the previous more extreme overbought conditions don’t remain. As noted last week:
“The broad market, Materials, Communications, Financials, Technology, Industrials, Healthcare, Discretionary, and Transports are all trading well outside their normal risk ranges. Furthermore, the broad market, Communications, Technology, Financials, Industrials, and Discretionary, are trading at extreme deviations from their long-term moving averages. These deviations are not sustainable long-term and argue for a more significant correction sometime this year.”
That analysis remains correct this week as well.
Weekly SimpleVisor Stock Screens
We provide three stock screens each week from SimpleVisor.
This week, we are searching for the Top 20:
- Relative Strength Stocks
- Momentum Stocks
- Fundamental & Technical Strength W/ Dividends
(Click Images To Enlarge)
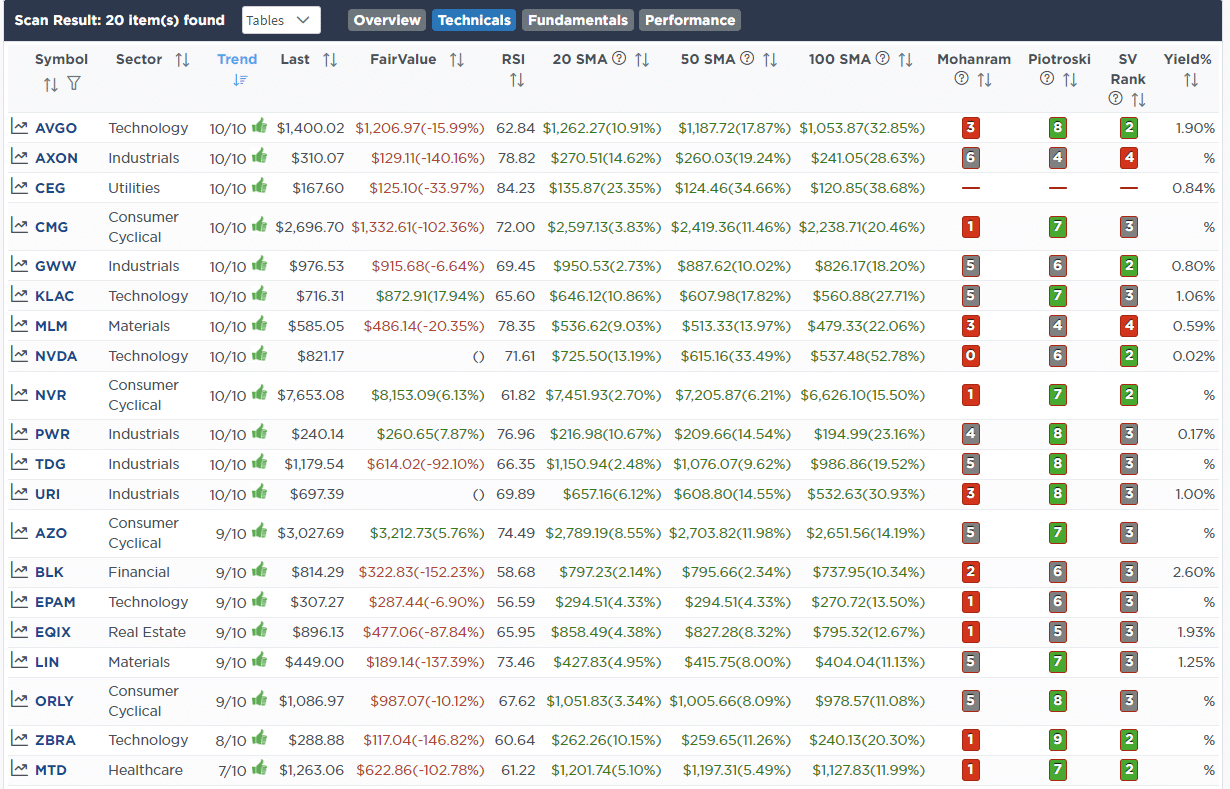
R.S.I. Screen

Momentum Screen
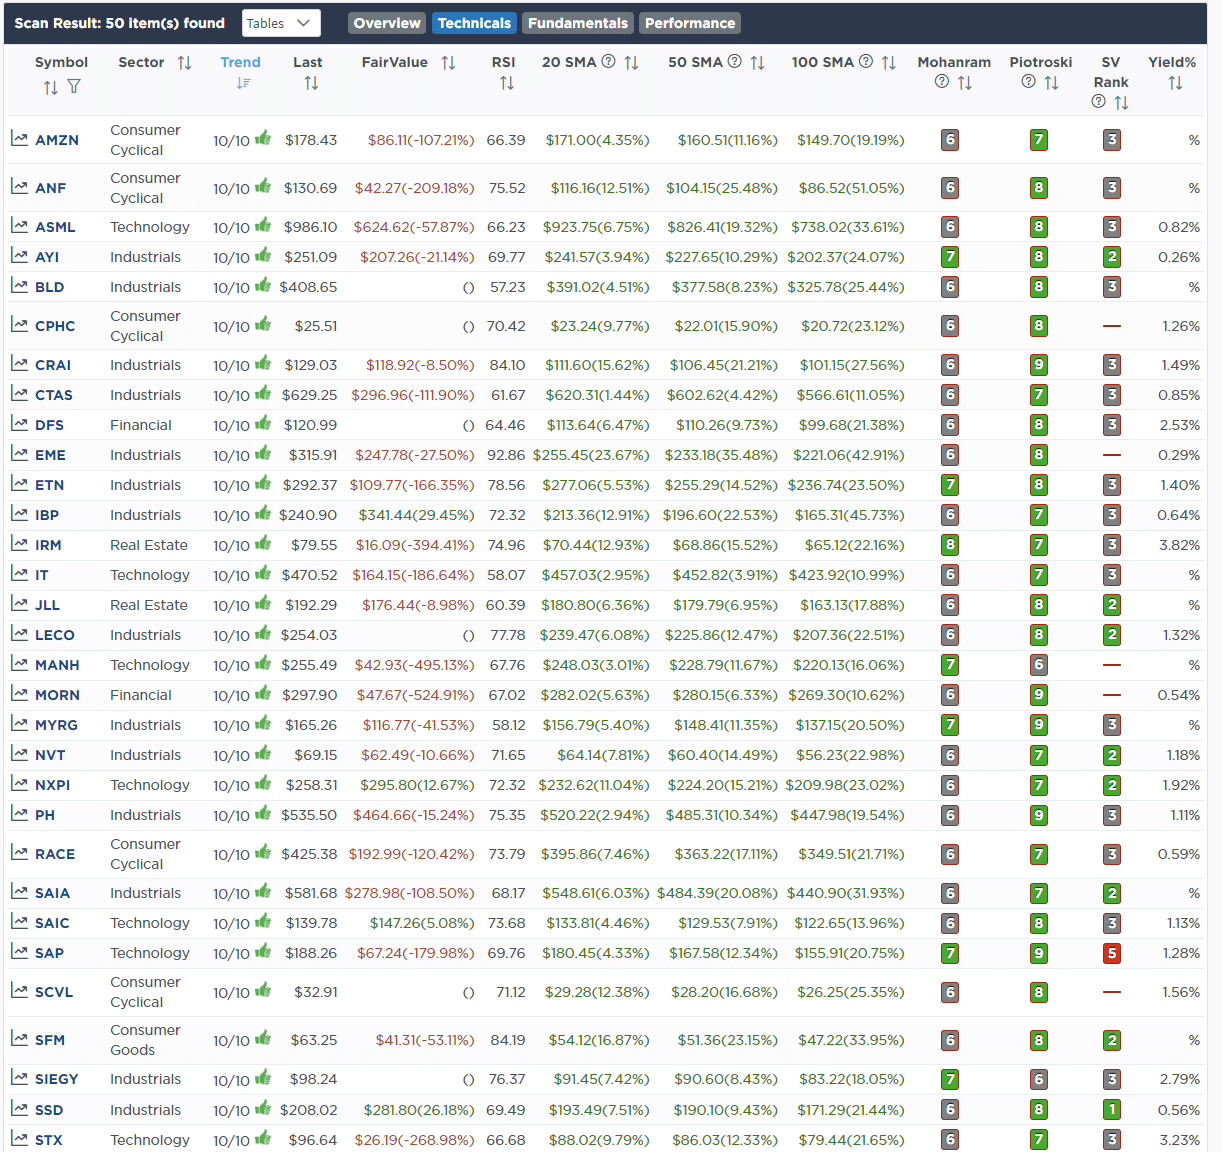
Fundamental & Technical Strength
SimpleVisor Portfolio Changes
We post all of our portfolio changes as they occur at SimpleVisor:
No Trades This Week

Lance Roberts, C.I.O.
Have a great week!

