Stocks Vs. Rates – Which One Is Most Likely Right? 04-24-21


In this 04-24-21 issue of “Stocks vs. Rates – Which One Is Most Likely Right?“
- Market Review And Update
- Market Pricing In Huge Recovery
- Interest Rates Are Not Convinced
- Portfolio Positioning
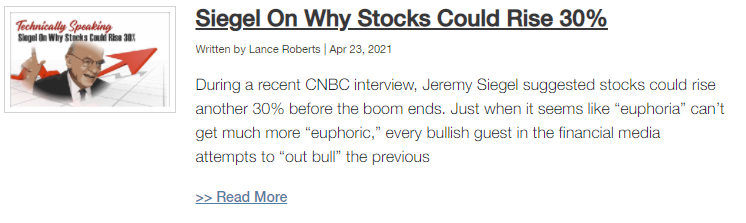
- #MacroView: Siegel On Why Stocks Could Rise 30%
- Sector & Market Analysis
- 401k Plan Manager
Follow Us On: Twitter, Facebook, Linked-In, Sound Cloud, Seeking Alpha

Catch Up On What You Missed Last Week

Market Review & Update
Last week, we said:
“With ‘money flows’ turning lower on Thursday and Friday, we will likely get a ‘sell signal’ next week.” Such is what occurred.
Specifically, I stated:
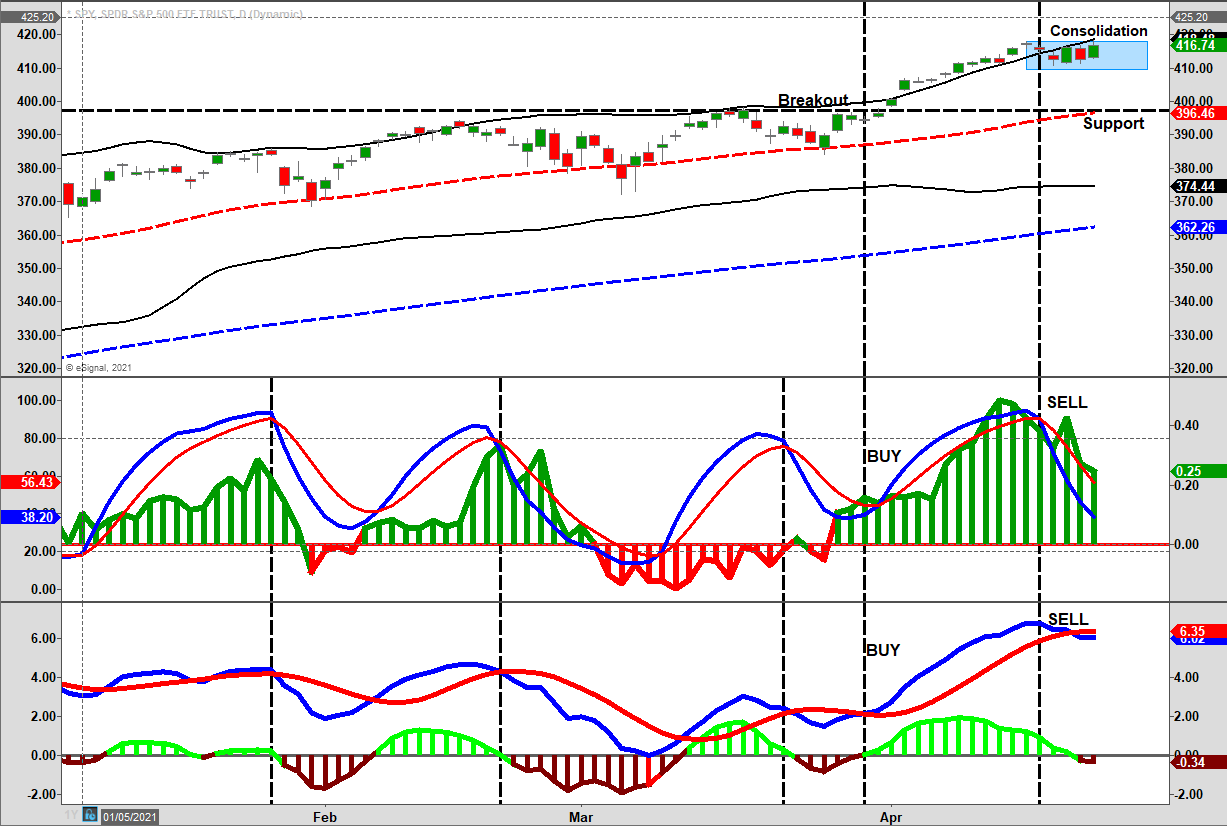
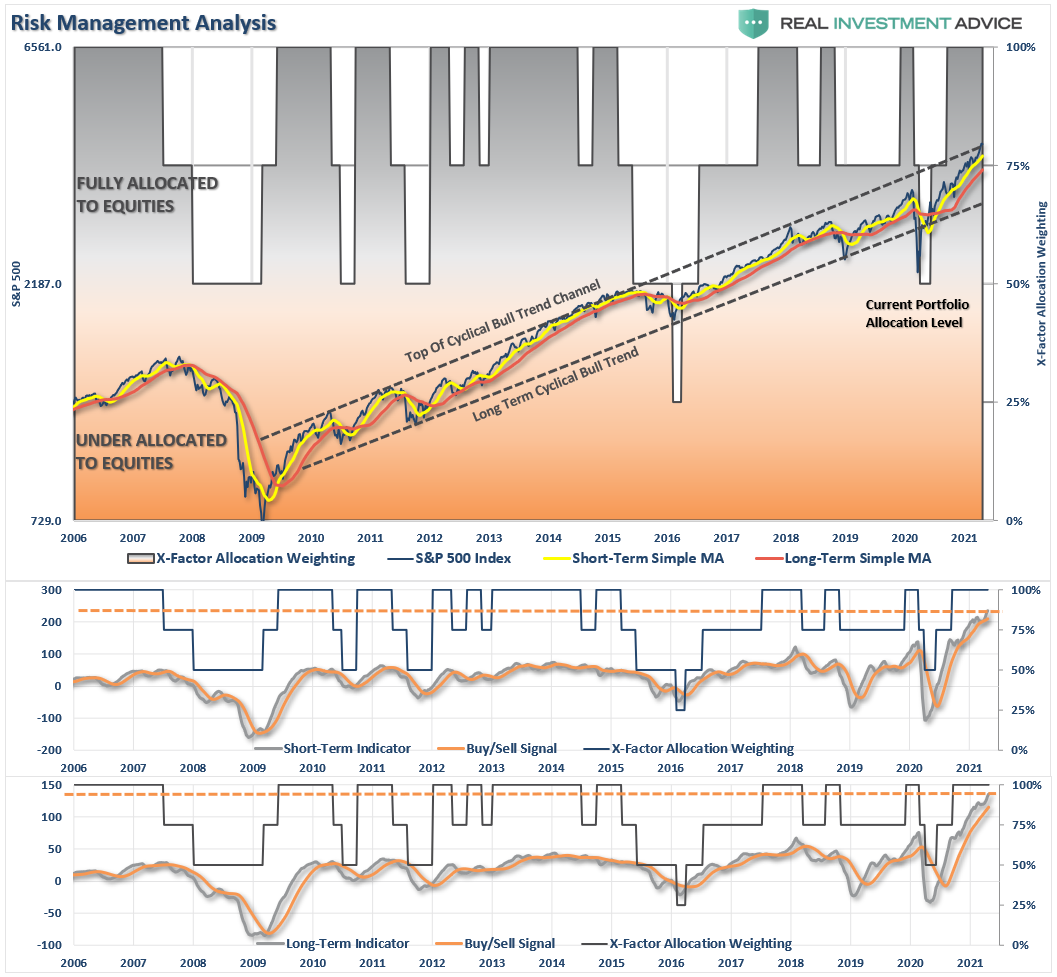
“The market is trading well into 3-standard deviations above the 50-dma, and is overbought by just about every measure. Such suggests a short-term “cooling-off” period is likely. With the weekly “buy signals” intact, the markets should hold above key support levels during the next consolidation phase.”
As shown above, that is what is currently occurring. While the market remains in a very tight range, the “money flow” sell signal (middle panel) is reversing quickly. Importantly, note that the money flows (histogram) are rapidly declining on rallies which is a concern.
While it is confusing to have contradicting “buy” and “sell” signals, such suggests a consolidation of the recent advance rather than a more significant correction. Such is what seems to be in process during this past week. More sizable declines occur when the short and long-term “sell signals” are in confirmation and a point made in Thursday’s 3-minutes video (Click the link to subscribe). We also explain why growth stocks may be a better place to be this summer.
For now, the market trend remains bullish and doesn’t suggest a sharp decrease of risk exposures is required. However, we did take profits out of our index trading positions last Monday. Risk management is always a prudent exercise as markets can, and regularly do, the unexpected.

Markets Are Pricing In A Huge Recovery
The stock market is currently pricing in a “huge” economic recovery. As noted by Goldman Sachs in a recent report, they now expect economic growth in 2021 to hit levels not seen since the early ’90s.
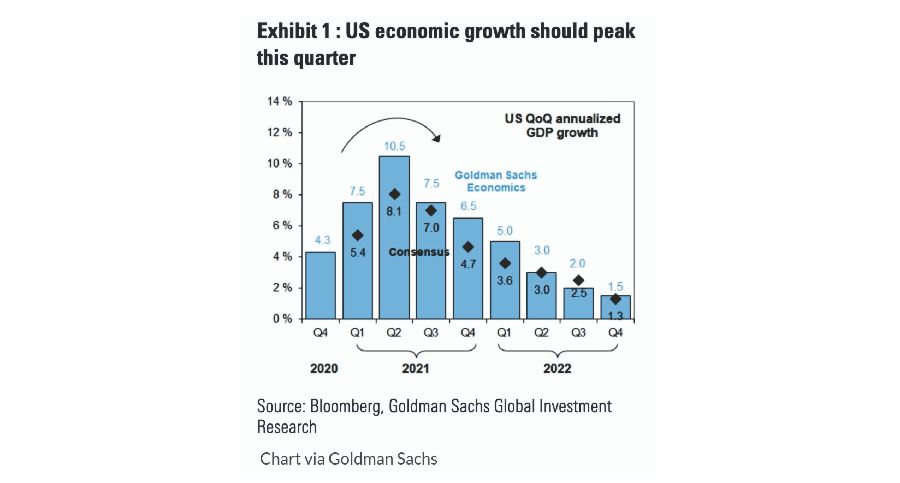
That explosion of economic growth supports the surge in earnings expectations and the surge higher in year-end price targets. Such was a point I discussed in our recent Earnings Analysis Report.
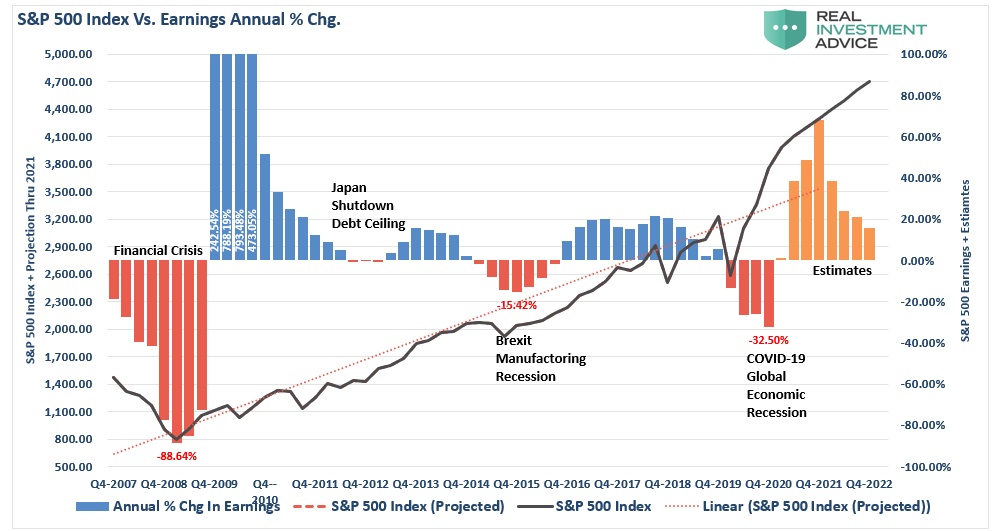
There is, however, an essential takeaway in both charts above. After the initial surge of reopening, activity and earnings growth quickly return to historical norms, while expectations for market prices continue higher. In other words, with valuations already elevated, the “hope” was that earnings would catch up with prices. However, given expectations for price growth are increasing faster than earnings, such suggest valuations will continue to increase.
Of course, we know that “valuations” have nothing to do with market prices in the short term. They do, however, have everything to do with long-term returns. Such was a point made by Michael Lebowitz in “Playing Roulette:”
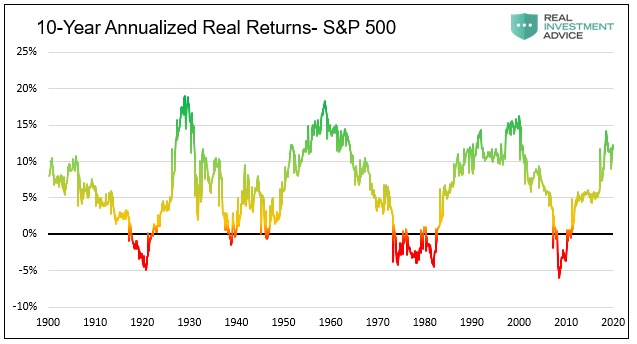
“No one can tell you with any certainty what stocks will do tomorrow or next month. However, looking further into the future, market returns become easier to forecast. The graph below shows stock returns become increasingly dependent on valuations as the investment horizon increases.”
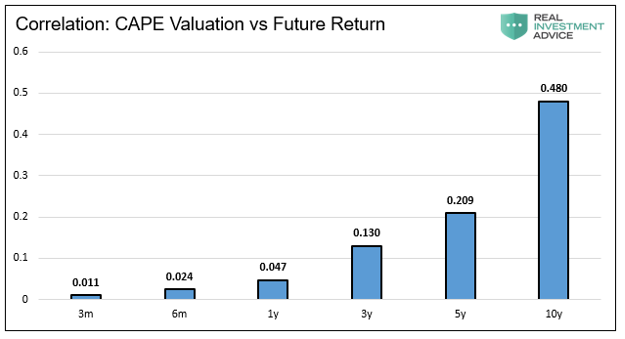
“Periods in which equities are overpriced with high valuations are followed by periods with lower returns. Conversely, periods when stocks are cheap, are often followed by periods of strong returns.”
The media often quips the stock market looks ahead 6-9 months, but there are plenty of historical examples where that vision wasn’t quite 20/20.

Interest Rates Aren’t Convinced.
Given the historic fallibility of the stock market, do interest rates fare better at predicting economic growth rates? As we discussed previously, there is a high correlation between interest rates and economic growth.
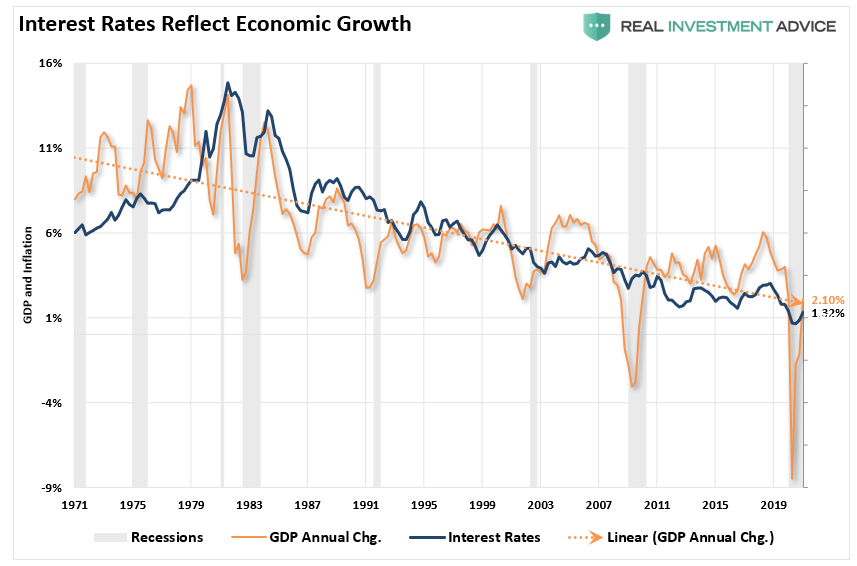
That correlation is essential.
At the peak of nominal economic growth over the last decade, interest rates rose to 3% as GDP temporarily hit 6%. However, what rates predicted is that economic growth would return to its long-term downtrend line. In other words, while the stock market was rising, predicting more robust growth, the bond market was sending out a strong warning.
Economists are currently predicting 6% or better economic growth, yet interest rates are roughly 50% lower than they were previously. In other words, the bond market is suggesting that economic growth will average between 1.75% and 2% over the next few years.
As we discussed, “Debt Doesn’t Create Growth.”
“More debt doesn’t lead to more robust economic growth rates or prosperity. Since 1980, the overall increase in debt has surged to levels that currently usurp the entirety of economic growth. With economic growth rates now at the lowest levels on record, the change in debt continues to divert more tax dollars away from productive investments into the service of debt and social welfare.”

From 1947 to 2008, the U.S. economy had real, inflation-adjusted economic growth than had a linear growth trend of 3.2%. However, following the 2008 recession, the growth rate dropped to the exponential growth trend of roughly 2.2%. Unfortunately, instead of reducing outstanding debt problems, the policies instituted fostered even greater unproductive debt levels. Therefore, economic growth will return to a new lower growth trend in the future.
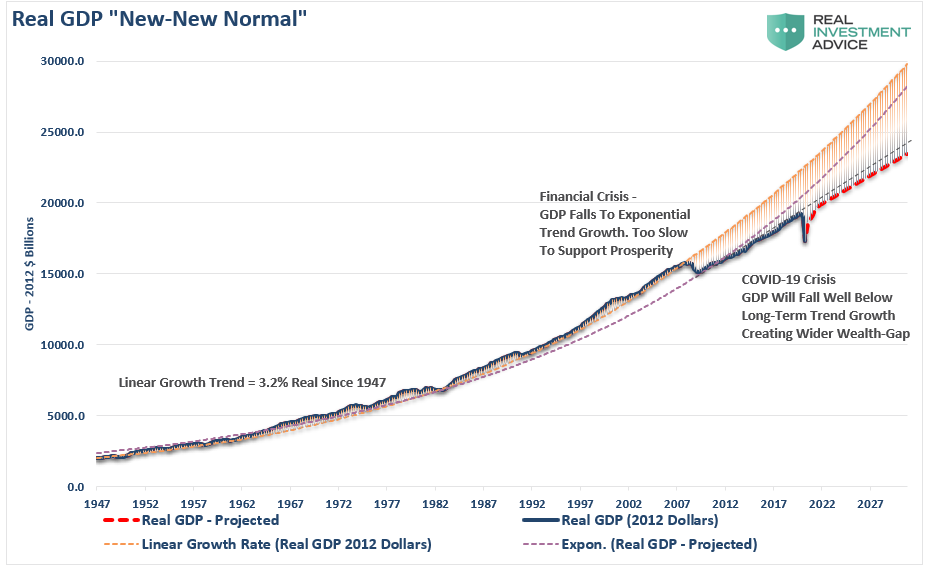
Such is what the bond market is already telling us.
Who Will Be Right?
So, will stocks get it right this time?
The chart of the bond prices versus the stock market suggests such will not be the case.
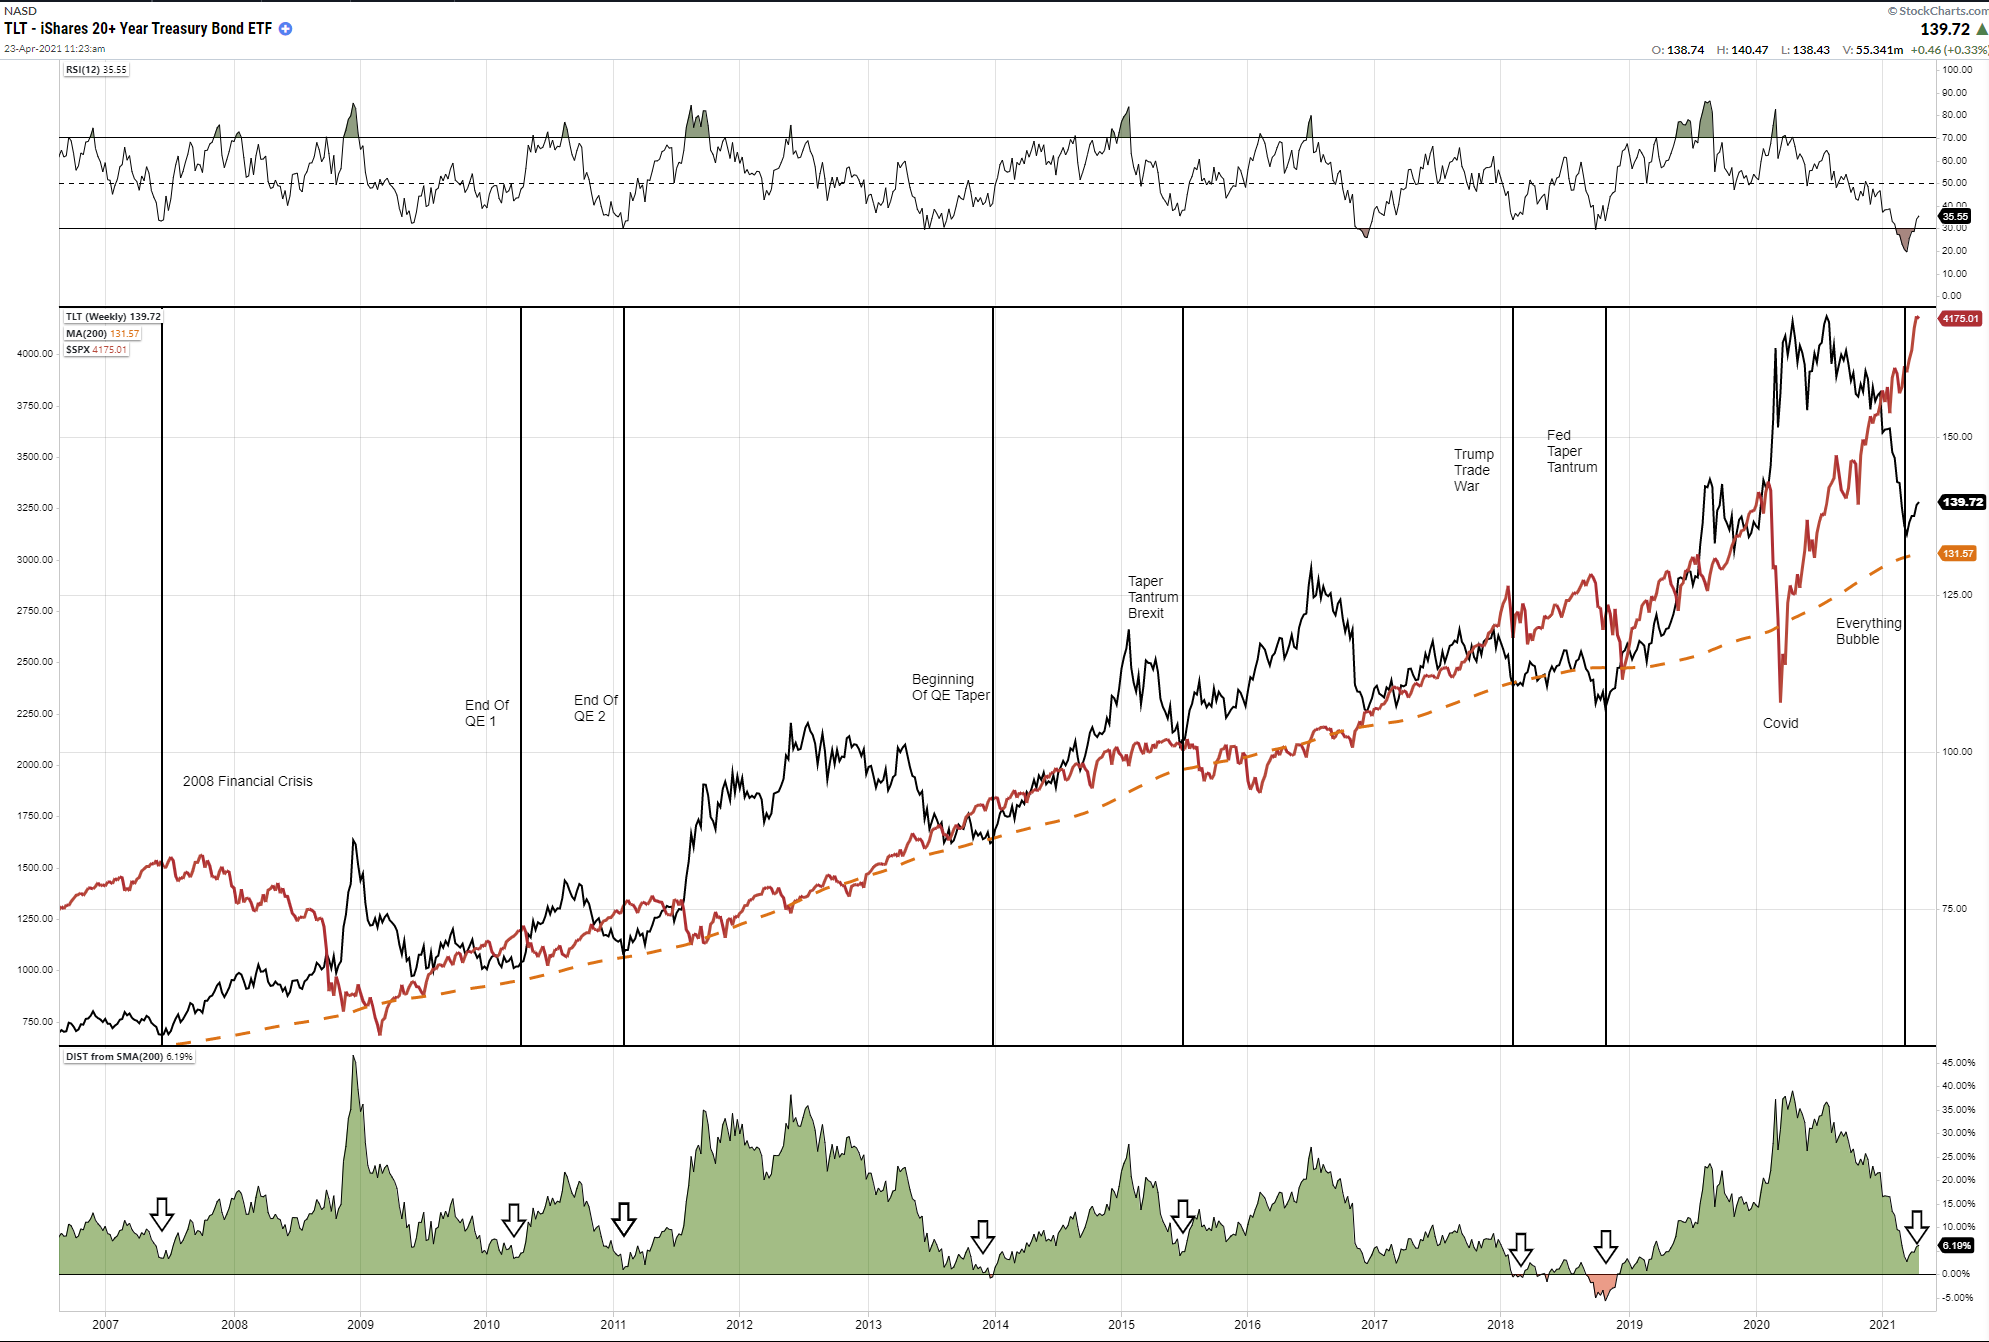
The chart shows the 200-Week (4-year) moving average of bond prices. The vertical lines show the retracement of bond prices to that long-term moving average. Each time, that event has coincided with a peak in asset prices, weaker economic growth trends, and generally some financial event.
But it is not just over the last 14-years this has occurred. As Michael Lebowitz noted in “What Interest Rate Will Matter,” rate increases have a history of financial events. To wit:
“Looking back over the last 40 years reveals a troubling problem. Every time interest rates reach the upper end of its downward trend, a financial crisis of sorts occurred. The graph below charts the steady decline in rates and GDP along with the various crisis occurring when rates temporarily rose.”
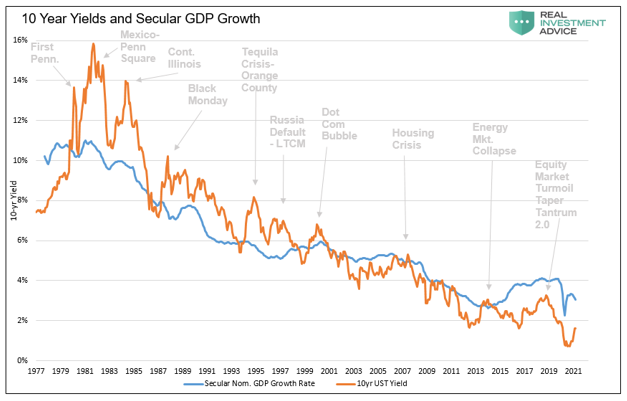
“Given crises frequently occur when rates rise sharply, we should contemplate how high rates can rise before the next crisis. Notice, as time goes on it takes less and less of a rate increase to generate a problem. The reason, as highlighted earlier, is the growth of debt outpaces the ability to pay for it.”
From our view, rates matter. Given their close tie to economic activity and inflation, we think they will matter a lot.
Investors Are All In As Insiders Get Out
Sentiment Trader had a great report out last week that touched on a topic I have discussed recently. Investors are currently “all in” the equity risk pool. Since the March 2020 lows, investors continue to increase “risk appetites” despite an economic shutdown, a recession, surging unemployment, and a collapse in earnings,
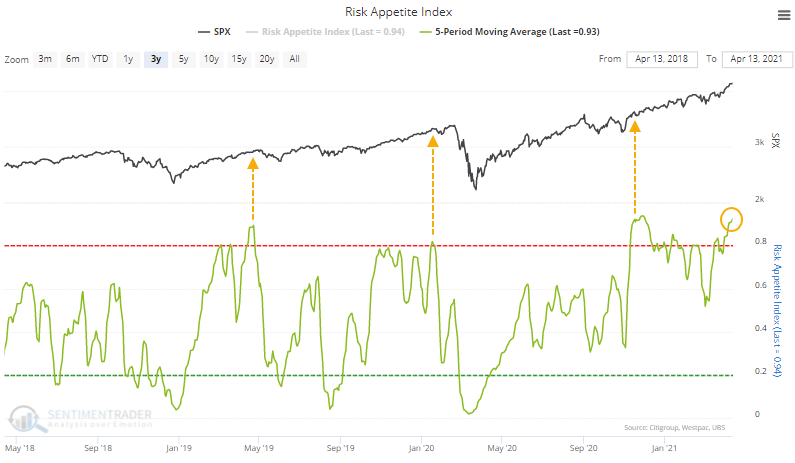
However, not only did they increase exposure to equities, they leveraged their portfolios to take on even more risk. Historically, these episodes have not ended well for investors.
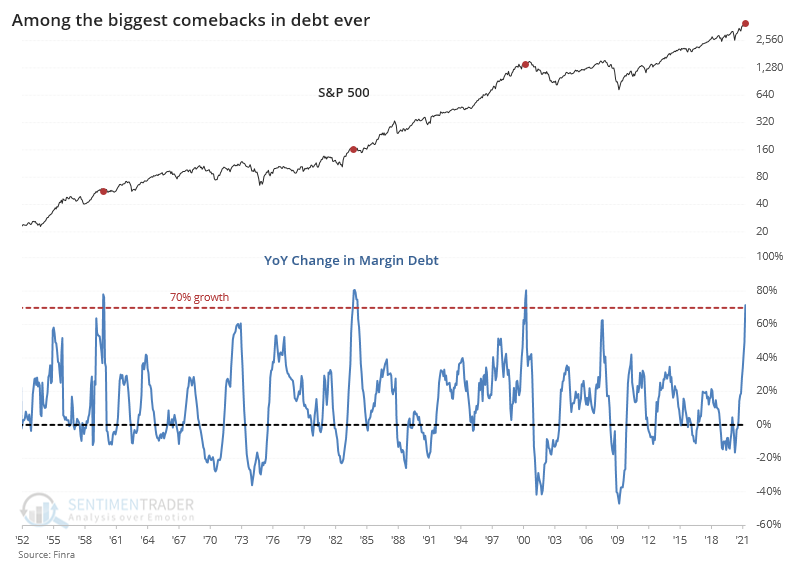
Interestingly, while retail investors bet surging economic growth will lift earnings to justify high valuations, companies’ insiders are cashing out at an unprecedented pace.
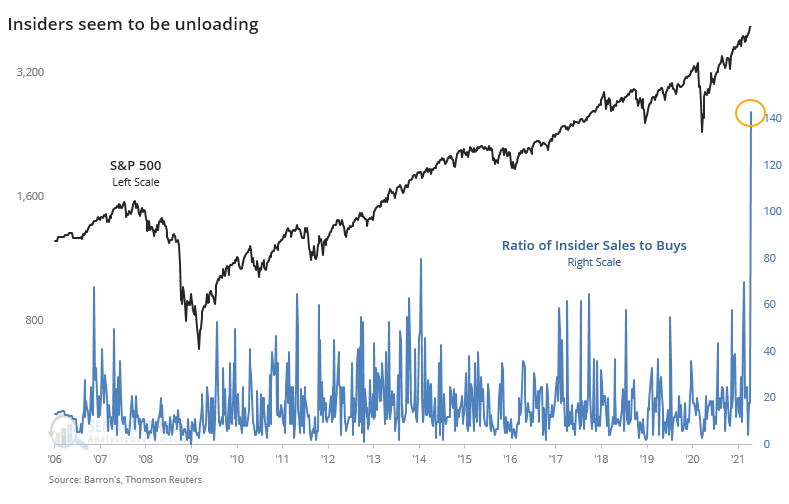
While such gets ignored in the short-term, it likely confirms the same message the bond market is sending. If economic growth fails to achieve “peak” expectations, the reversion could be pretty extreme.

Portfolio Update
Last Monday, as our indicators started to flip over, we sold off our equity index “trading positions” to raise cash levels in portfolios. We remain primarily allocated to the market in our holdings but are willing to reduce exposure further if markets show increasing weakness.
Just as a reminder from last week, we highly recommend, if you have not done so already, to take some action to rebalance portfolio risk accordingly.
- Trim Winning Positions back to their original portfolio weightings. (ie. Take profits)
- Sell Those Positions That Aren’t Working. If they don’t rally with the market during this recent rally, they will decline more when the market sells off again.
- Move Trailing Stop Losses Up to new levels.
- Review Your Portfolio Allocation Relative To Your Risk Tolerance. If you have an aggressive allocation to equities at this point of the market cycle, you may want to try and recall how you felt during 2008. Raise cash levels and increase fixed income accordingly to reduce relative market exposure.
Such is the same process we follow consistently with our client portfolios and our asset models. It isn’t glamorous, but it is a simple routine we can replicate when signals occur.
The key to successful portfolio management over time is having a systematic, repeatable process to follow. Much like baking a cake, as long as you follow the recipe, it is hard to mess things up.
With weekly “buy” signals intact and money flows still positive, there is no need to get heavily defensive. We think that time is coming, but likely sometime this summer.
The MacroView
If you need help or have questions, we are always glad to help. Just email me.
See You Next Week
By Lance Roberts, CIO
Market & Sector Analysis
Analysis & Stock Screens Exclusively For RIAPro Members
Discover All You Are Missing At RIAPRO.NET
This is what our RIAPRO.NET subscribers are reading right now! Risk-Free For 30-Day Trial.
- Sector & Market Analysis
- Technical Gauge
- Fear/Greed Positioning Gauge
- Sector Rotation Analysis (Risk/Reward Ranges)
- Stock Screens (Growth, Value, Technical)
- Client Portfolio Updates
- Live 401k Plan Manager

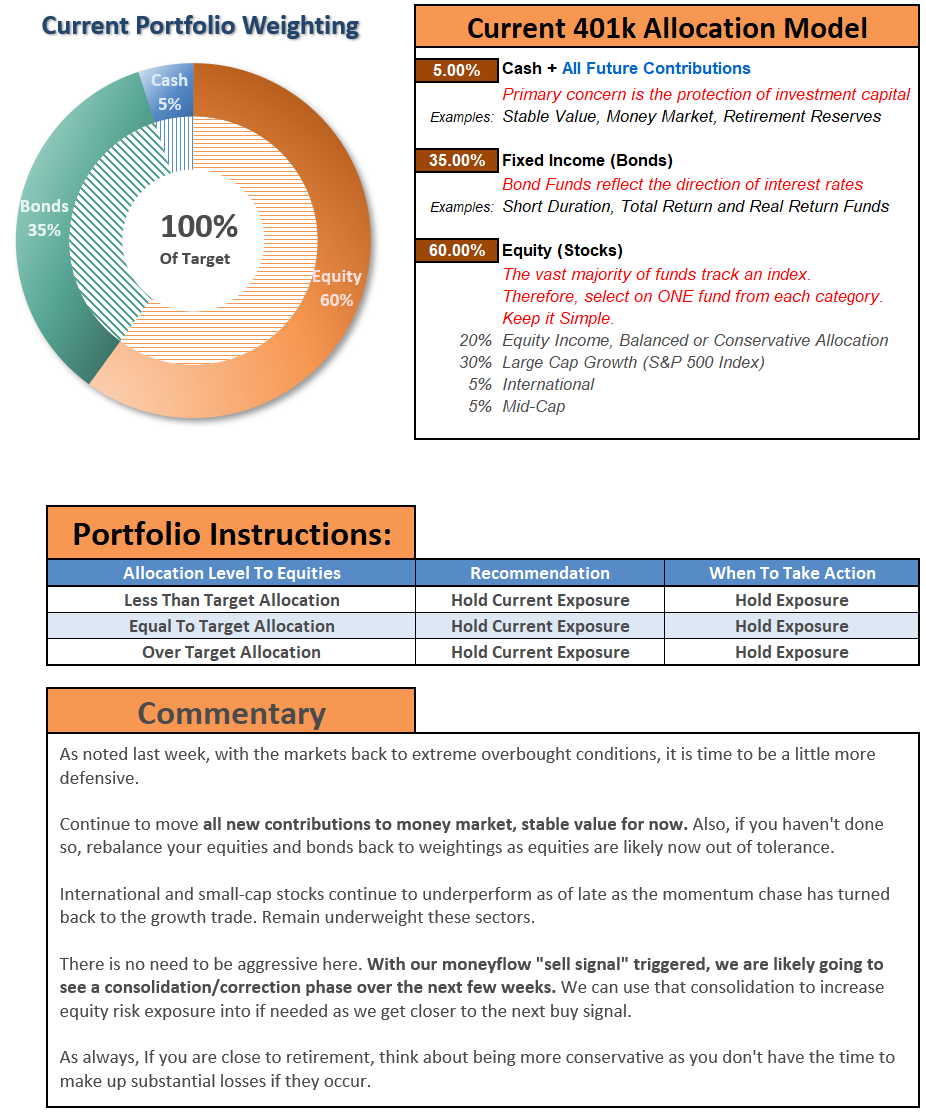
THE REAL 401k PLAN MANAGER
A Conservative Strategy For Long-Term Investors
If you need help after reading the alert, do not hesitate to contact me.

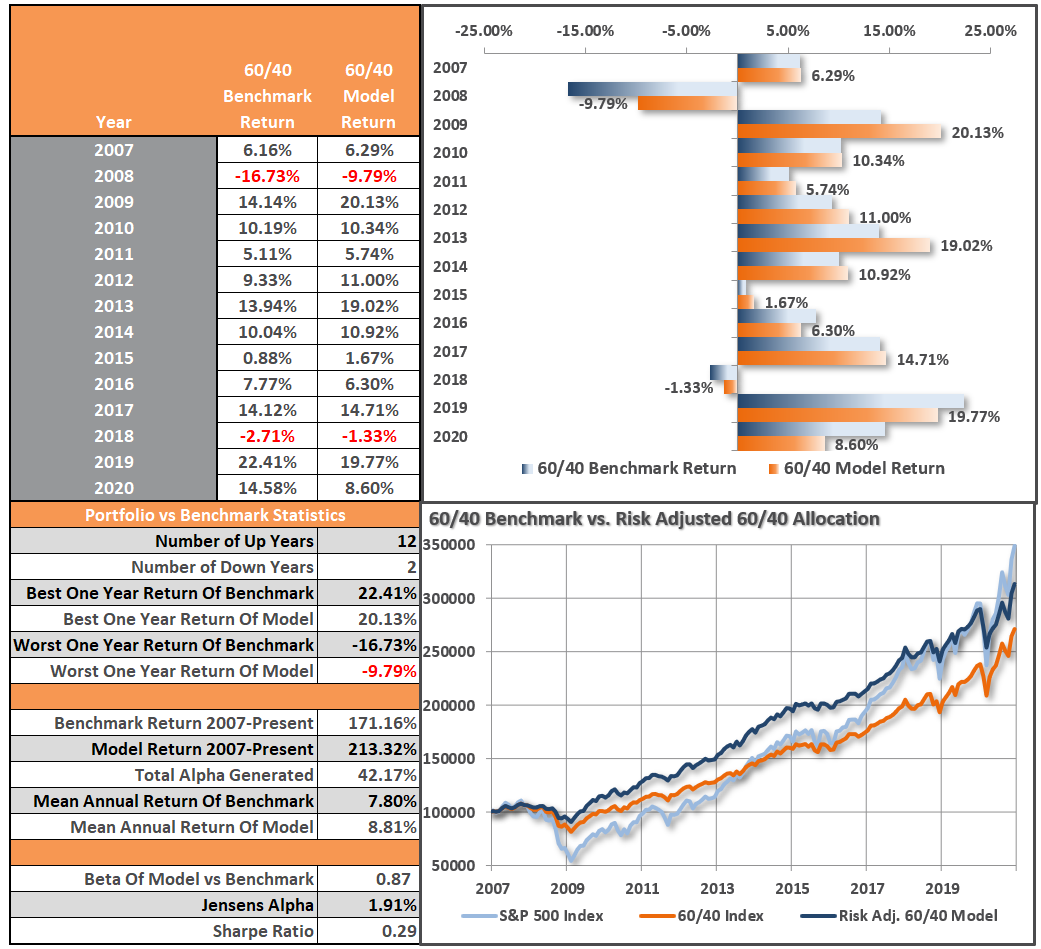
Model performance is a two-asset model of stocks and bonds relative to the weighting changes made each week in the newsletter. Such is strictly for informational and educational purposes only, and one should not rely on it for any reason. Past performance is not a guarantee of future results. Use at your own risk and peril.
Have a great week!


