
Inside This Week’s Bull Bear Report
- Investor Sentiment Is So Bullish It’s Bearish
- How We Are Trading It
- Research Report – Housing Is Unaffordable
- Youtube – Before The Bell
- Market Statistics
- Stock Screens
- Portfolio Trades This Week
Market Review And Update
Last week’s newsletter discussed the ongoing bullish trend of the market. To wit:
“The current bullish stampede is very similar to what we saw from March to July last year. At that time, it was the chase for “A.I.” that was driving the market while the majority of stocks dragged. The market remained overbought, trading in a defined trend channel as prices advanced. Then, the markets corrected by 10% into October, which is typical for any given year.”
Today, we again see that same “unstoppable advance” with the same bifurcation in the market. While the “Magnificent 7” stocks again drive the markets, another 5-10% correction over the next several months should be no surprise. Such is particularly the case as we approach the upcoming Presidential election, where market participants may want to reduce exposure to offset potential election risks.“
That unstoppable advance, driven by the mega-capitalization stocks on Friday, topped the psychological 5000 level on the index. With the strong momentum carrying that particular group of stocks, the index will likely try to push higher over the next few days. However, as shown, the market is back to more extreme overbought levels, and bullish sentiment has reached “greed.”

Most notably, the deviation between the index and the 200-DMA is getting rather extreme, which has typically preceded short-term corrections. As discussed in this week’s newsletter, those extensions and deteriorating internals suggest we should begin rebalancing portfolio risk.
While we are highly confident that a correction is coming, the timing of that event is uncertain. As such, we must maintain exposure to garner performance while we can. However, once signals are triggered, we will become more aggressive in the risk reduction process.
Let’s take a look at the market internals.
Need Help With Your Investing Strategy?
Are you looking for complete financial, insurance, and estate planning? Need a risk-managed portfolio management strategy to grow and protect your savings? Whatever your needs are, we are here to help.

Investor’s Sentiment Is So Bullish It’s Getting Bearish
Bullish sentiment has surged as the “Fear Of Missing Out,” or FOMO, kicked in in recent weeks. It is somewhat interesting to write this post, given that we discussed the exact opposite last October.
“Notably, those ‘high [earnings] beat rates’ get support from the more negative short-term sentiment and reduced equity allocations by professional managers during the summer.”
At that time, investors’ sentiment was negative, and technical conditions were extremely oversold. Such provided the perfect cocktail for a substantial rally into year-end.
Since November, however, the surge in asset prices has swiftly turned that negative investor sentiment into bullish sentiment. This presents a problem for investors as rising asset prices create a need to chase returns. Such is the basis of the “Fear of Missing Out” or F.O.M.O. However, such is also the point where investors, given the need to avoid “buying high and selling low,” should reevaluate the risks of being overly exposed to equity risk.
One of the most challenging things to do is go “against” the prevailing bias regarding investing. Such is known as contrarian investing. One of the most famous contrarian investors is Howard Marks, who once stated:
“Resisting – and thereby achieving success as a contrarian – isn’t easy. Things combine to make it difficult; including natural herd tendencies and the pain imposed by being out of step, particularly when momentum invariably makes pro-cyclical actions look correct for a while.
Given the uncertain nature of the future, and thus the difficulty of being confident your position is the right one – especially as price moves against you – it’s challenging to be a lonely contrarian.”
The chart below from that post shows the composite investors’ sentiment index. That index combines retail and institutional investor sentiment. Extremely low readings, like last October, are coincident with market bottoms. Conversely, extremely high readings, as we see currently, have corresponded to previous market peaks and corrections.
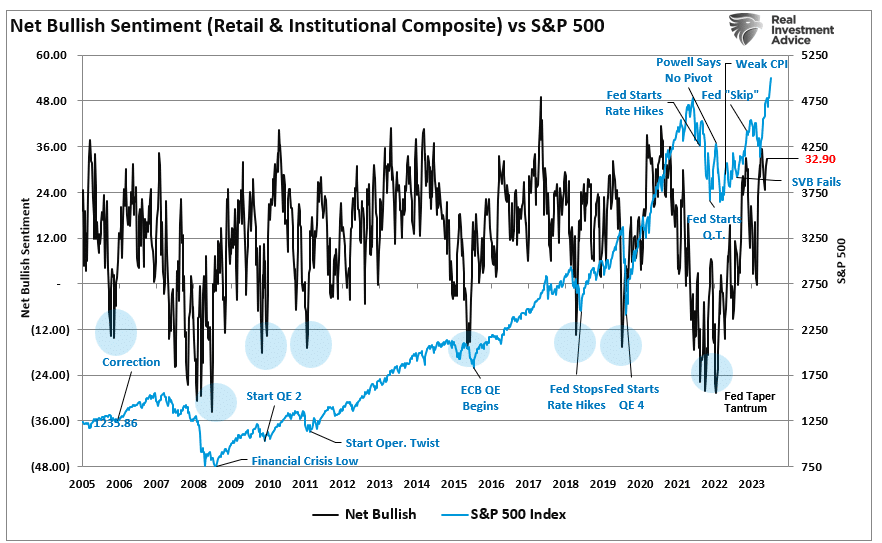
Also, professional managers are aggressive adding to risk exposures. The current angle of ascent in the market since November is incredibly sharp. While such parabolic moves are not uncommon, they are ultimately unsustainable.

The conclusion is that there is a high possibility of the market doing something no one expects. Other indicators suggest the risk of a reversal has risen.
Technical Warnings Are Increasing
We noted in “S&P Set To Hit 5000“ that technical indicators were reaching more extreme levels.
“Furthermore, our composite gauge of weekly technical indicators has already reached more extreme levels. Historically, we are close to a peak when this gauge exceeds 90 (scale is 0 to 100). As is always the case, the resolution of more extreme bullish sentiment and technical price extensions is through a short-term reversal. However, such does not mean that the market won’t hit 5000 first, as we suspect it will.”

This more extreme increase in technical overbought conditions is also evident across other measures. Sentimentrader.com recently made the same observations in their research.
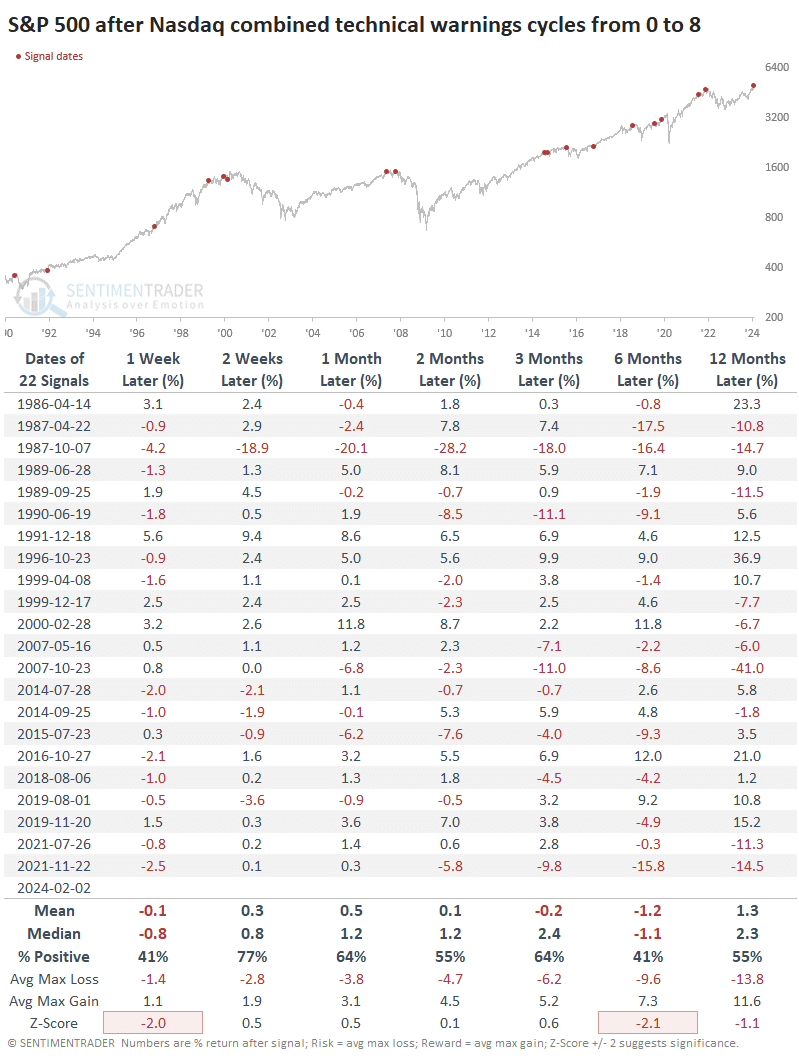
“Recently, we saw that there have been some technical warning signs on the Nasdaq. Among those are the Hindenburg Omen and Titanic Syndrome, which have been stacking up lately. If you can get past the hyperbolic names, they provide helpful insight into what’s happening below the surface of the major stock market indexes. When these signals trigger, they highlight conditions when not everything is in gear. And they’ve both been triggering consistently on the Nasdaq over the past few weeks.
During the past three weeks, the two indicators have triggered a combined eight signals. That’s the most since December 2021. We can see from the chart below that when eight or more signals were triggered, the Nasdaq Composite’s annualized return was a horrid -29.3%.“

Given the high degree of similar holdings in both the Nasdaq and the S&P 500, it is unsurprising that returns in the S&P 500 were similarly weak after combined technical signals were triggered.
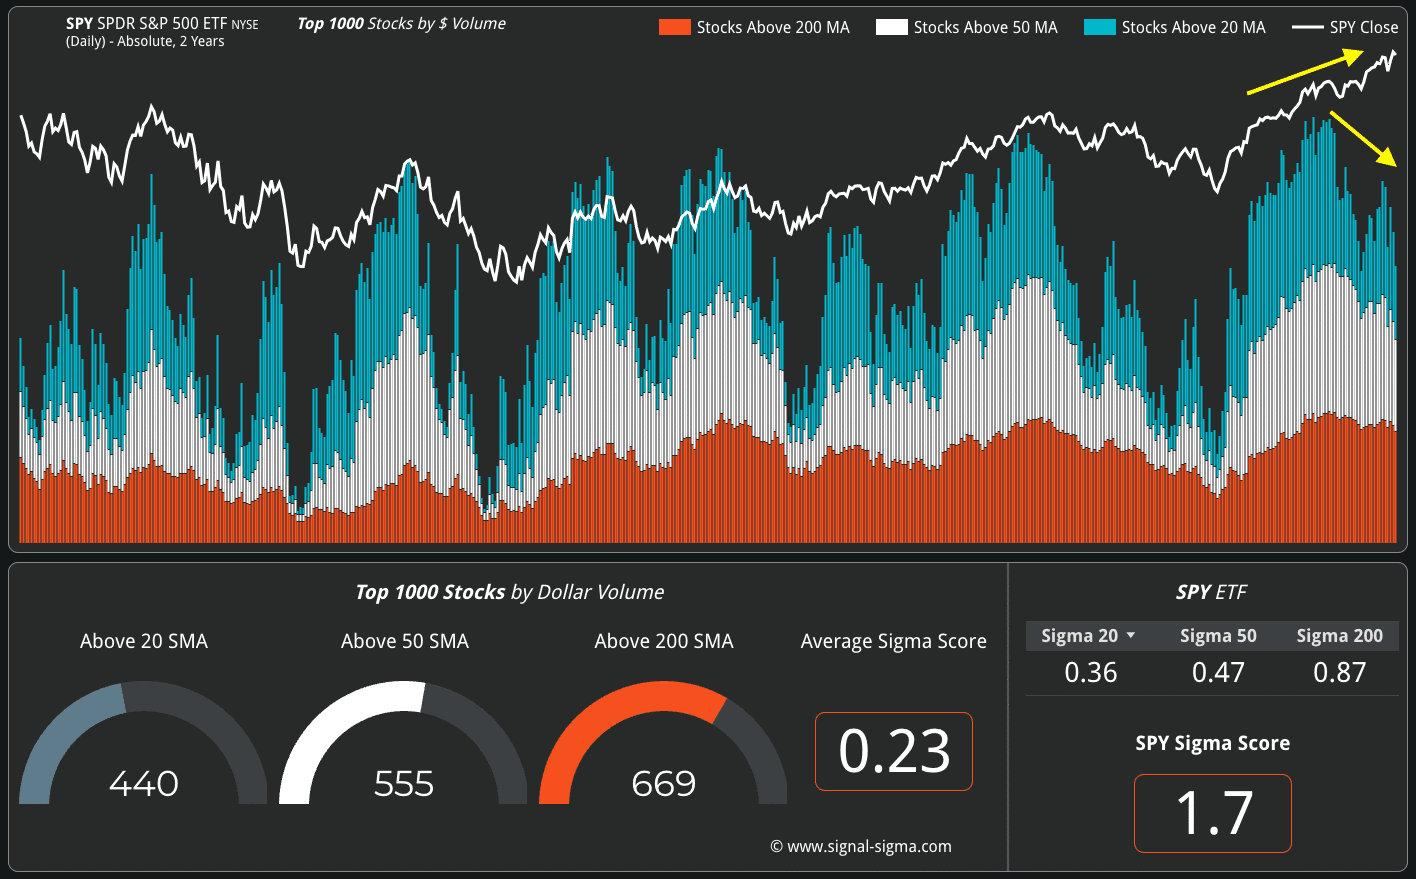
While investors’ sentiment remains bullish, it continues to be driven by a narrower participation in the market overall. Within the S&P 500, fewer and fewer stocks have been participating in its most recent gains. The percentage of stocks within the index holding above their 20-day, 50-day, and 200-day moving averages has decreased for weeks. Such declines or negative divergences usually precede corrective events in the market.
As Sentimentrader.com concludes:
“The results were not encouraging for bulls. Across almost all time frames, the S&P’s returns were woeful, consistently negative, and with a terrible ratio of risk to reward. Buyers shrugged off the warnings in 1963 and 2017, but other than that, it was trouble.”
The outlook for a continued bullish advance is not good between investor sentiment readings, technical extensions, and participation. The market needs a breather to reduce the speculative behavior and rebalance buyers and sellers. However, when that will occur and what triggers it remains anyone’s guess.
The obvious question is if we see the troubling signs in the market, “Why not sell and go to cash and wait for the correction?“
It is a valid question. Timing is always the issue. Therefore, when the bulls are running, it is not wise to stand before the stampede. Remember, “Markets can remain irrational longer than you can remain solvent.”
Identifying The Turn
As portfolio managers, we have a responsibility to our clients to protect capital and generate returns for their financial futures. However, if we go to cash too soon, we negatively impact our client’s future and suffer career risk. So, how can we do both?
Currently, market trends are bullish with “buy signals” in place, suggesting that allocations should remain equity-biased for now.

However, the chart below is the most important. While daily indicators are excellent for short-term outlooks, weekly indicators, while slower to register signals, provide the needed data to evaluate the risk of a more meaningful corrective event. Here are the crucial points.
- The markets remain confined to a relatively narrow trading range since the Financial Crisis lows. Previous breakouts above this trend eventually reverted to the lower bounds of that channel. The exception was the massive surge in the market following the pandemic-related stimulus payments, which led to an extreme deviation above that channel. The eventual reversion was the 2022 market correction.
- The two lower panes are Moving Average Convergence Divergence (MACD) indicators. The top pane is a short-term average series, and the bottom is intermediate-term. The two indicators are because the longer-term series confirms the shorter-term to reduce false signals. Critically, when both indicators trigger a sell signal, such aligns with short- and intermediate-term corrective market actions as denoted by the red vertical lines.
- Those two MACD indicators are currently at the highest levels outside the pandemic-stimulus-induced run-up in 2020 and 2021. Such suggests that the eventual reversion will likely be more significant than just normal pullback when it occurs.
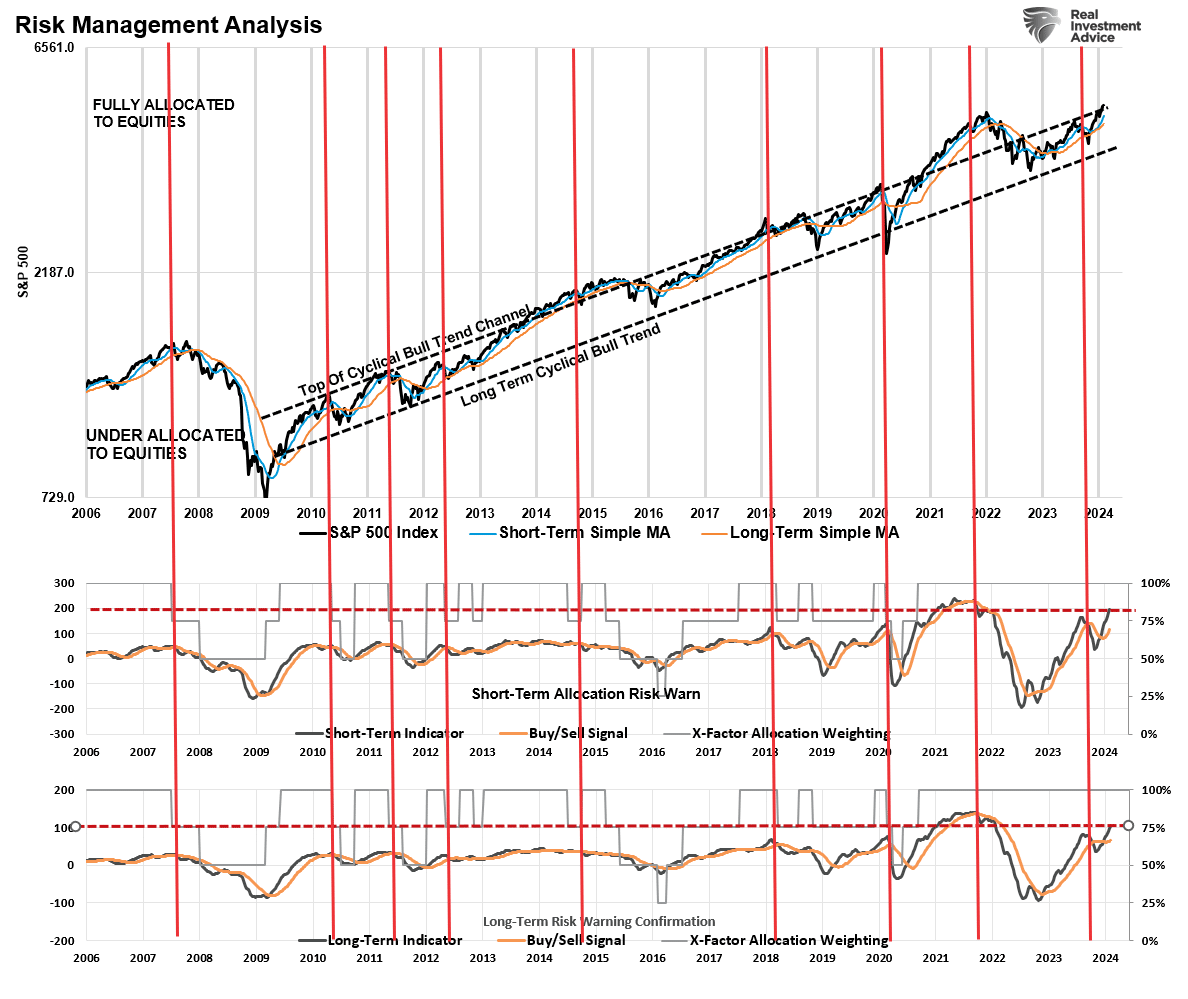
While this analysis will NOT get us to significantly cut equity risk at precisely the peak of the market, it will provide a risk reduction signal early enough to avoid the bulk of the downturn. (It also works in reverse to increase equity risk.)
How We Are Trading It
As noted above, what causes the market to break its bullish trajectory is entirely unknown. The 10% correction last year didn’t have an overwhelming catalyst other than just disappointment the Federal Reserve might keep rates “higher for longer” than Wall Street wanted. That disappointment could be the Fed not cutting rates fast enough this year.
Whatever trigger causes a reversal in the bullish signals, we will act accordingly to reduce risk and rebalance exposures. But one thing is certain: investor sentiment is extremely bullish, which has almost always been a good “bearish signal” to be more cautious.
While we have warned of a potential correction over the past couple of weeks, it reminds us much of June and July last year, where similar warnings for a 10% correction went unheeded. As such, we will rebalance exposures next week by taking profits in some positions with significant gains for the year and adding to current positions where we are underweight. We suspect the current environment is much the same as 2022, and the bullish rally will go further to suck the last of the holdouts in. However, we want to make adjustments before the correction comes.
While it is not time to be overly bearish, we suggest reverting to basic portfolio management rules to reduce risks.
- Trim Winning Positions back to their original portfolio weightings. (ie. Take profits)
- Sell Those Positions That Aren’t Working. If they don’t rally with the market during a bounce, they will decline when it sells off again.
- Move Trailing Stop Losses Up to new levels.
- Review Your Portfolio Allocation Relative To Your Risk Tolerance. If you have an aggressive allocation to equities, consider raising cash levels and increasing fixed income accordingly to reduce relative market exposure.
Have a great week.
Research Report

Subscribe To “Before The Bell” For Daily Trading Updates
We have set up a separate channel JUST for our short daily market updates. Please subscribe to THIS CHANNEL to receive daily notifications before the market opens.
Click Here And Then Click The SUBSCRIBE Button
Subscribe To Our YouTube Channel To Get Notified Of All Our Videos
Bull Bear Report Market Statistics & Screens

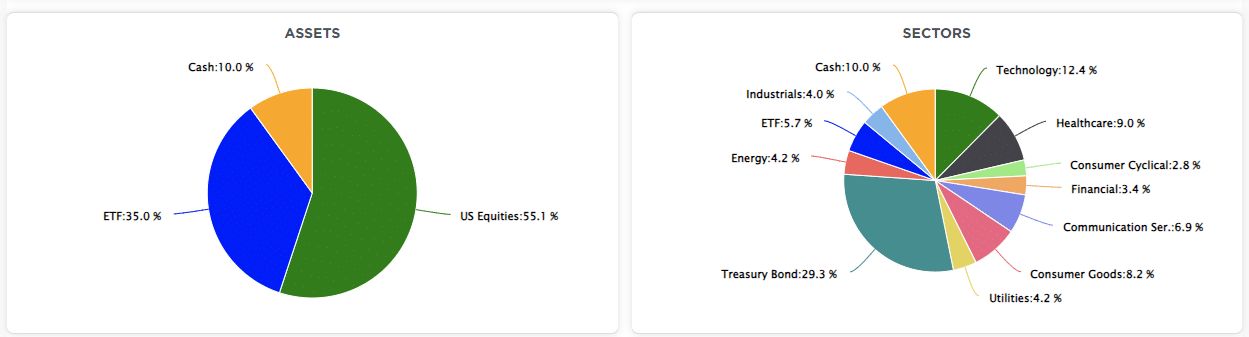
SimpleVisor Top & Bottom Performers By Sector

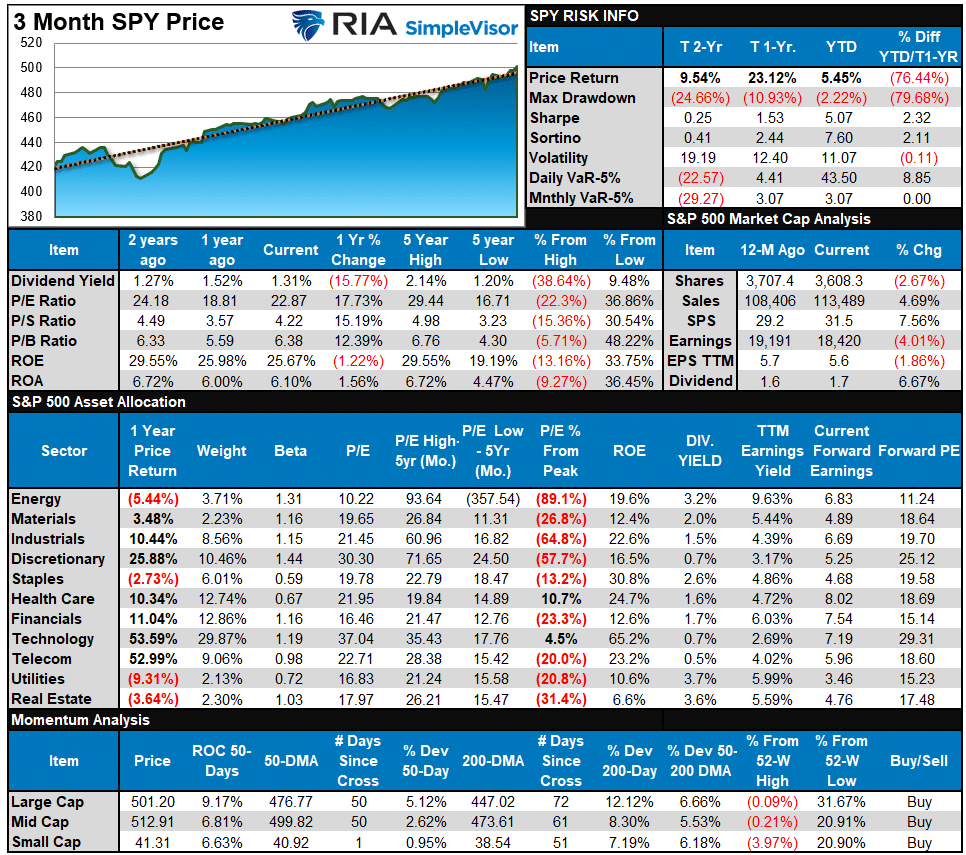
S&P 500 Weekly Tear Sheet
Relative Performance Analysis
As noted last week, the “capitalization-weighted index” is overbought, but the composite index average and median are not. However, this week’s higher surge is now bringing most sectors and markets toward overbought. With the market breaking above 5000, the psychological momentum could well push markets higher next week. However, the market advance remains narrow, with a broad swath of sectors and markets underperforming the benchmark index. As shown in the Risk-Range Report below, the market is well outside of its normal bands, suggesting some corrective relief is coming. It is advisable to rebalance risks in portfolios.

Technical Composite
The technical overbought/sold gauge comprises several price indicators (R.S.I., Williams %R, etc.), measured using “weekly” closing price data. Readings above “80” are considered overbought, and below “20” are oversold. The market peaks when those readings are 80 or above, suggesting prudent profit-taking and risk management. The best buying opportunities exist when those readings are 20 or below.
The current reading is 97.04 out of a possible 100.
Portfolio Positioning “Fear / Greed” Gauge
The “Fear/Greed” gauge is how individual and professional investors are “positioning” themselves in the market based on their equity exposure. From a contrarian position, the higher the allocation to equities, the more likely the market is closer to a correction than not. The gauge uses weekly closing data.
NOTE: The Fear/Greed Index measures risk from 0 to 100. It is a rarity that it reaches levels above 90. The current reading is 82.53 out of a possible 100.

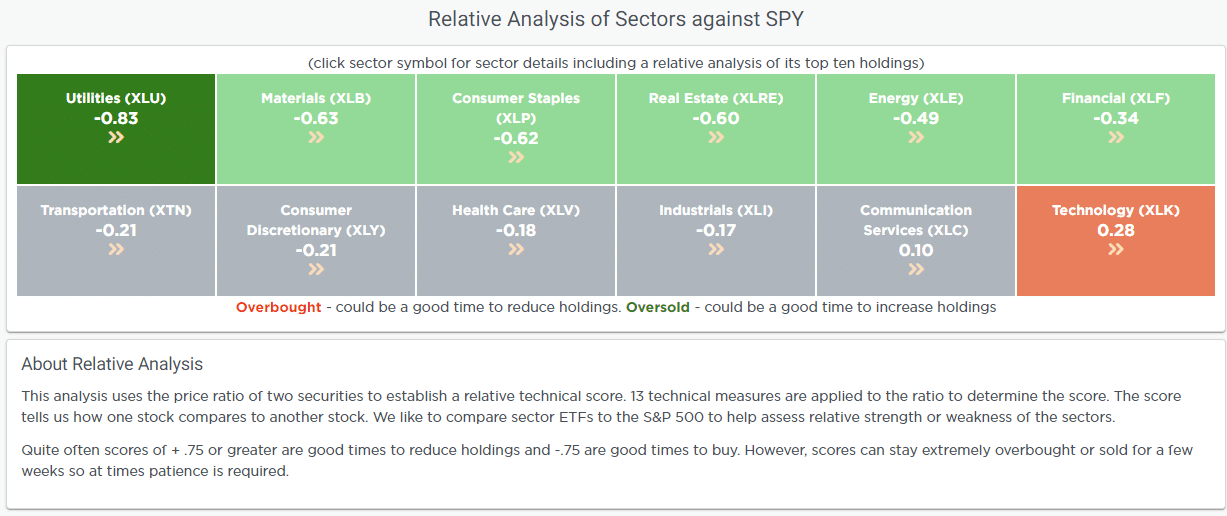
Relative Sector Analysis
Most Oversold Sector Analysis

Sector Model Analysis & Risk Ranges
How To Read This Table
- The table compares the relative performance of each sector and market to the S&P 500 index.
- “MA XVER” (Moving Average Crossover) is determined by the short-term weekly moving average crossing positively or negatively with the long-term weekly moving average.
- The risk range is a function of the month-end closing price and the “beta” of the sector or market. (Ranges reset on the 1st of each month)
- The table shows the price deviation above and below the weekly moving averages.
As noted last week:
“The deviations of those leading sectors are becoming significantly deviated from their long-term moving averages. The last time we saw double-digit deviations like this was heading into 2022. However, most sectors and markets have bullish trends with moving-average crossovers. Such suggests higher prices for now, but realize that eventually this will reverse.”
The market’s bullish momentum continued this past week, pushing the broad market above 5000 and well outside its normal risk range. Such was again a function of the mega-capitalization stocks, which are well outside their ranges and deviated above long-term moving averages. Some profit-taking is advised to rebalance risk exposures as a corrective process is coming. It is only a matter of timing.

Weekly SimpleVisor Stock Screens
We provide three stock screens each week from SimpleVisor.
This week, we are searching for the Top 20:
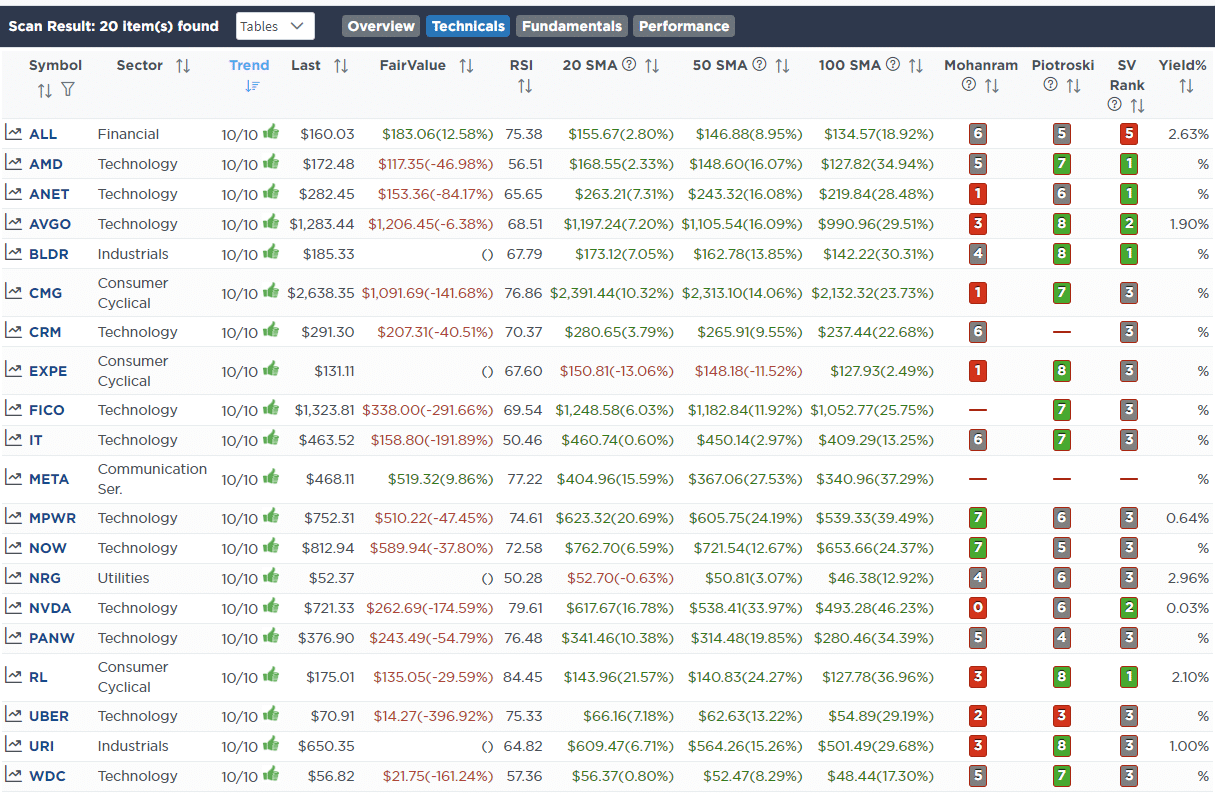
- Relative Strength Stocks
- Momentum Stocks
- Fundamental & Technical Strength W/ Dividends
(Click Images To Enlarge)
R.S.I. Screen
Momentum Screen

Fundamental & Technical Strength

SimpleVisor Portfolio Changes
We post all of our portfolio changes as they occur at SimpleVisor:
No Trades This Week

Lance Roberts, C.I.O.
Have a great week!

