Fed Minutes Spook Markets Into Selloff


In this 01-08-22 issue of “Fed Minutes Spook Markets Into Selloff.”
- Market Stumbles Into January
- Fed Minutes Spook Markets
- Portfolio Positioning
- Sector & Market Analysis
Follow Us On: Twitter, Facebook, Linked-In, Sound Cloud, Seeking Alpha
Is It Time To Get Help With Your Investing Strategy?
Are you looking for complete financial, insurance, and estate planning? Need a risk-managed portfolio management strategy to grow and protect your savings? Whatever your needs are, we are here to help.
Schedule your “FREE” portfolio review today.

Market Stumbles Into January
Last week, we discussed the Santa Rally came as expected, but the market was back overbought levels. To wit:
“However, as shown, the market is overbought, pushing into heavy bull-trend resistance, and is nearly 10% above its 200-dma. Notably, the upper trend line repeatedly provided resistance against the advance, while the lower trend line provided that support. In September, that changed with the lower support giving way, and is now providing another resistance level to the advance.”
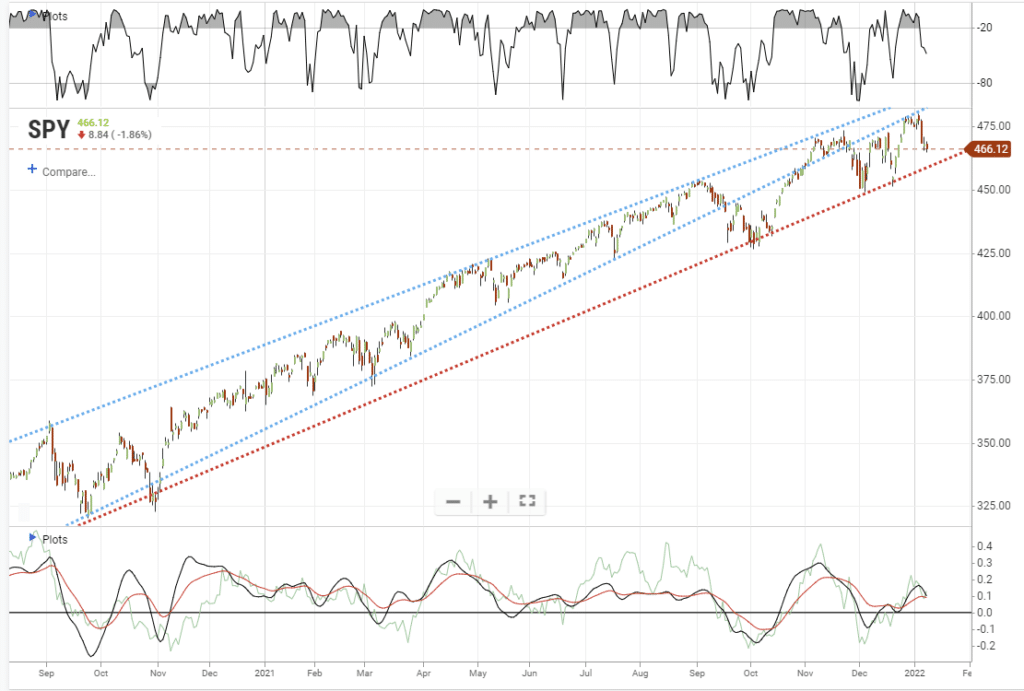
With the market overbought, we began reducing our equity exposure early this week. But, not surprisingly, the market failed at that resistance due to more hawkish Fed comments, which we will discuss, and weaker than expected employment. As RIA Analyst Nick Lane noted:
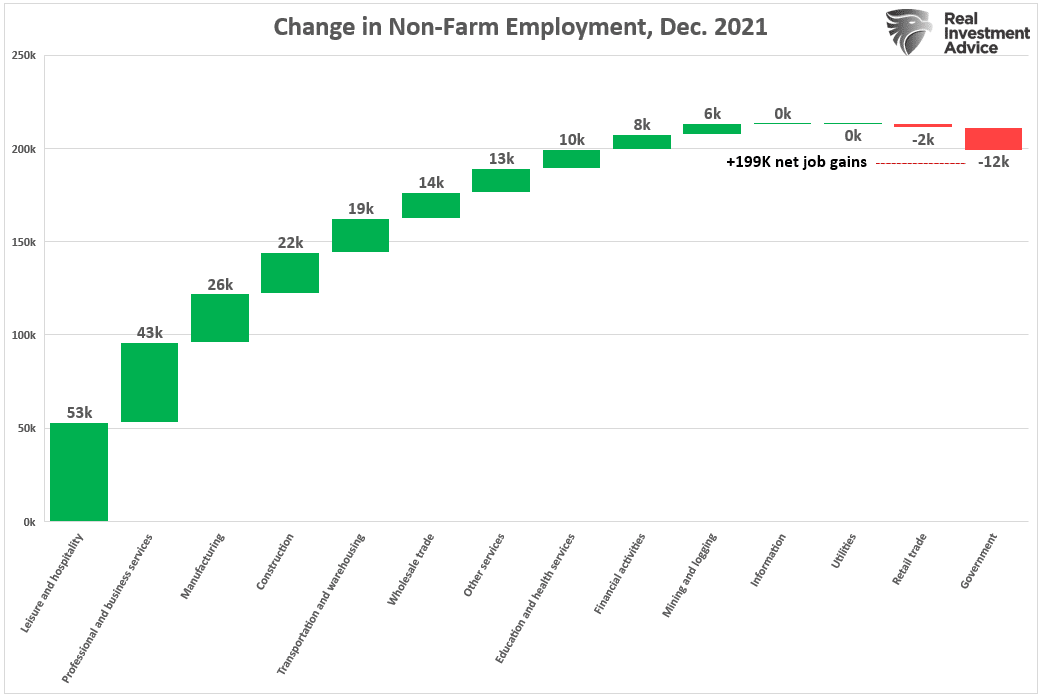
“The BLS jobs report fell short of the ADP report for the second month in a row. 199k jobs were added in December, half of the expected amount. The BLS revised October and November up by 141k. Despite the weaker number, the unemployment rate fell appreciably from 4.2% to 3.9%.”
However, the following comment was most important when it comes to the Fed.
“Of concern for the Fed, monthly hourly earnings doubled to .6% from .3% last month. The current monthly rate indicates wage growth of 7.2%, which is more or less in line with inflation. That said, the year-over-year rate is 4.7%, down .1% from last month and below the inflation rate. While the monthly boost in earnings is welcome news for workers, the Fed must grapple with whether companies raise prices to offset higher wages. The potential for wage-price spiral inflation is undoubtedly on their minds. The graph below shows how various sectors contributed to the BLS jobs number.”
As I discussed with Charles Payne on Fox Business, the market will remain a slave to the Fed for now.
The Nasdaq Bear Market
One of the more interesting points about the current market is it “looks like a bull market” when viewing the major indices. However, below the surface is a very different story.
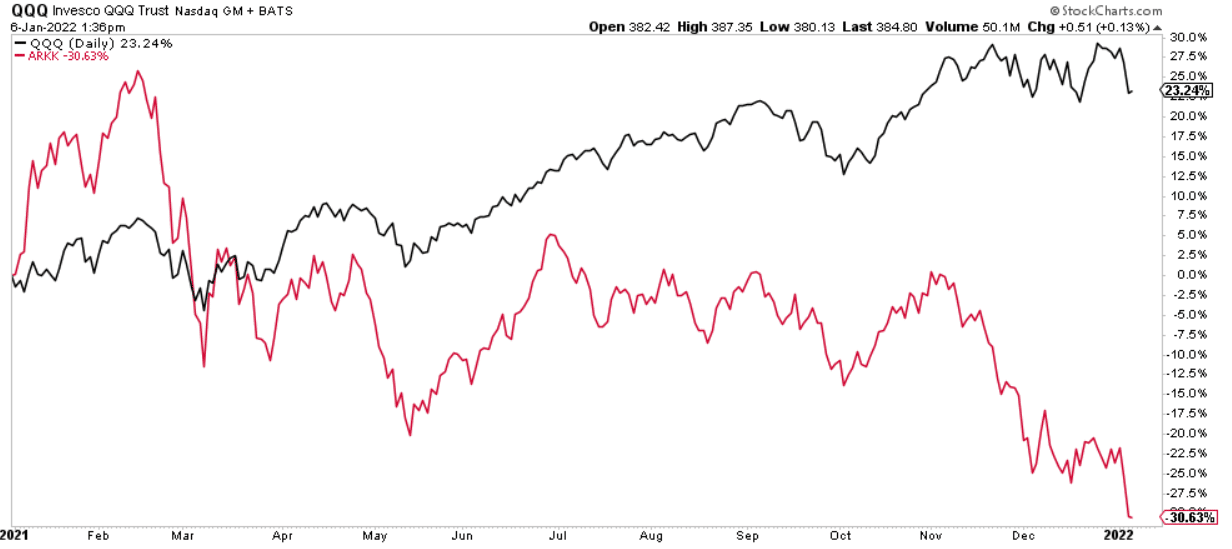
An easy way to see this dichotomy is by looking at the Nasdaq index versus the Ark Innovation ETF (ARKK). Ark Innovation comprises many popular “disruptor” stocks chased by retail investors. However, it also doesn’t own the major “FANG” stocks.

Without the support of the top 10-stocks of the Nasdaq, which comprise roughly 30% of the entire index, the performance differential between the two funds is quite clear.
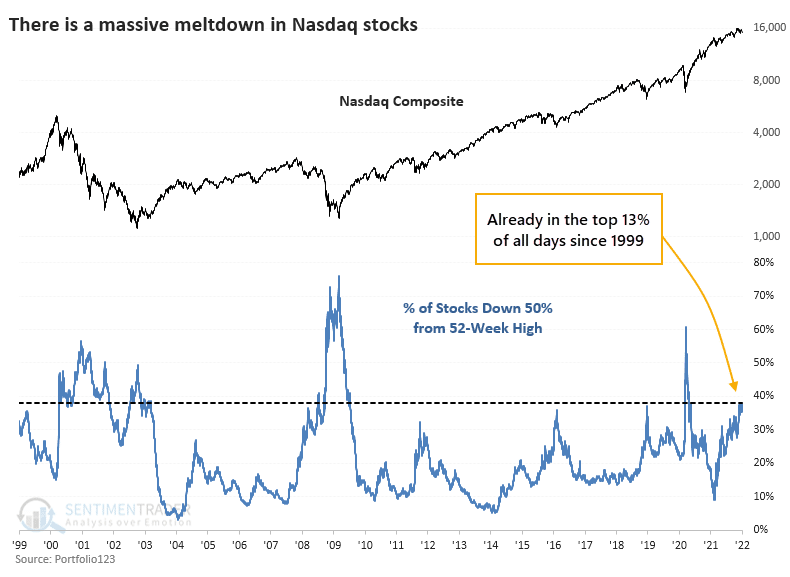
However, it is not just a few holdings in the Ark Innovation ETF lagging the Nasdaq. According to SentimenTrader, nearly 40% of the Nasdaq index have lost 50% of their value from respective 52-week highs. To wit:
“Valuations are at historical highs, companies are raising billions based on fairy dust, and the Fed is signaling a tightening cycle. All of these are scaring investors that we’re on the cusp of a repeat of 1999-2000.
After Wednesday’s post-FOMC selloff, more than 38% of stocks trading on the Nasdaq are now down 50% from their 52-week highs. Only 13% of days since 1999 have seen more stocks cut in half.
At no other point since at least 1999 have so many stocks been cut in half while the Nasdaq Composite index was so close to its peak. When at least 35% of stocks are down by half, the Composite has been down by an average of 47% (!).
The last sentence is critical. There is no precedent for when so many stocks were in a bear market, and the index wasn’t.
What happens next is anyone’s guess, but the Fed’s more hawkish stance certainly isn’t helping.
This Week’s MacroView

Fed Minutes Spooks Market
On Wednesday, the Federal Reserve spooked the equity and bond markets with the release of the December meeting minutes. Several statements were decidedly more “hawkish” than market participants expected.
For example, on the inflation front, the Fed has shifted away from inflation being “transient.”
“Participants remarked that inflation readings had been higher and were more persistent and widespread than previously anticipated.“
With the Fed now focused on more persistent inflation, as the minutes confirmed, they are taking a more aggressive stance on tapering monetary accommodation. Such would include moving up the pace of rate hikes and a faster balance sheet runoff.
“Participants generally noted that, given their individual outlooks for the economy, the labor market, and inflation, it may become warranted to increase the federal funds rate sooner or at a faster pace than participants had earlier anticipated.”
“Almost all participants agreed that it would likely be appropriate to initiate balance sheet runoff at some point after the first increase in the target range for the federal funds rate.“
“Some participants also noted that it could be appropriate to begin to reduce the size of the Federal Reserve’s balance sheet relatively soon after beginning to raise the federal funds rate.“
“Many participants judged that the appropriate pace of balance sheet runoff would likely be faster than it was during the previous normalization episode.“
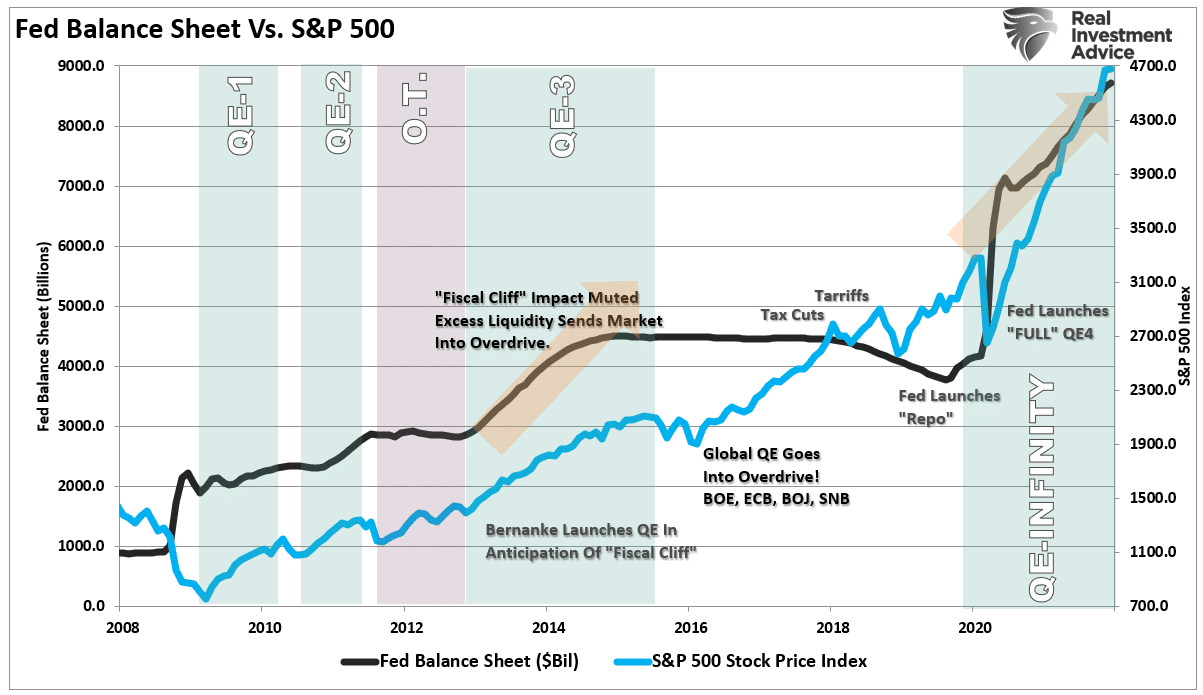
Why does reducing the balance sheet and hiking rates to combat inflation present a problem for stocks? Because, as noted previously:
The critical component of the “bullish thesis” has been the psychology of the “Fed put.” Regardless of valuation levels, deteriorating fundamentals, or simple logic, the excuse for continuing to take on increasing levels of risk was “Don’t fight the Fed.”
In other words, you can’t have it both ways.
Are Bonds Becoming A Buy?
If you shouldn’t be “fighting the Fed,” another key takeaway from the Wednesday Fed minutes should not get dismissed. As would be expected, interest rates are rising in response to Fed’s commitment to lift overnight lending rates in the short term.
However, as Michael Lebowitz recently noted:
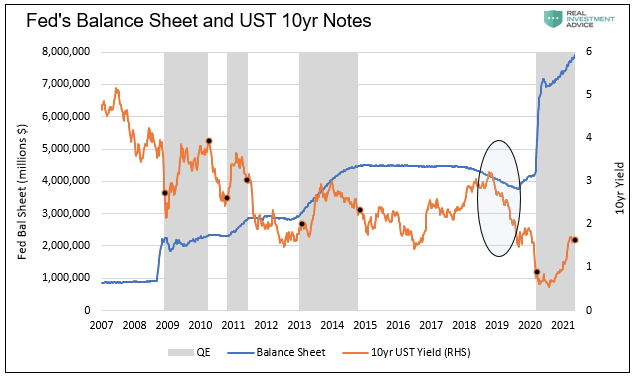
“The graph below shows that bond yields tend to fall when QE ends. The circled area shows the one instance when the Fed reduced the size of their balance sheet. At that time in late 2018 and 2019, yields initially rose slightly and then fell precipitously. Are we again at the precipice of another steep decline in yields?
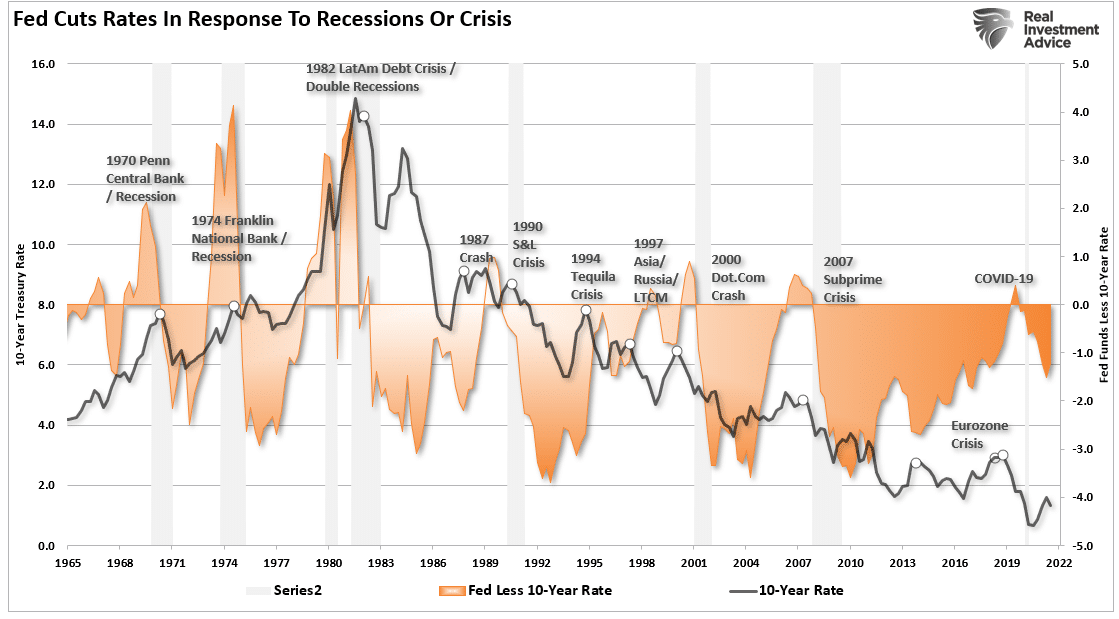
The point here is that when the Fed removes monetary accommodation, the market reprices risk. Simply, the Fed’s monetary stimulus supports the “risk-on” trade. As a result, market psychology will inevitably shift to “risk-off,” which favors owning bonds over equities when that support gets removed.
In particular, since 2000, the rise and fall of equities and yields have become highly correlated. The only change that explains the immediate switch from non-correlation to correlation is the Federal Reserve interventions.
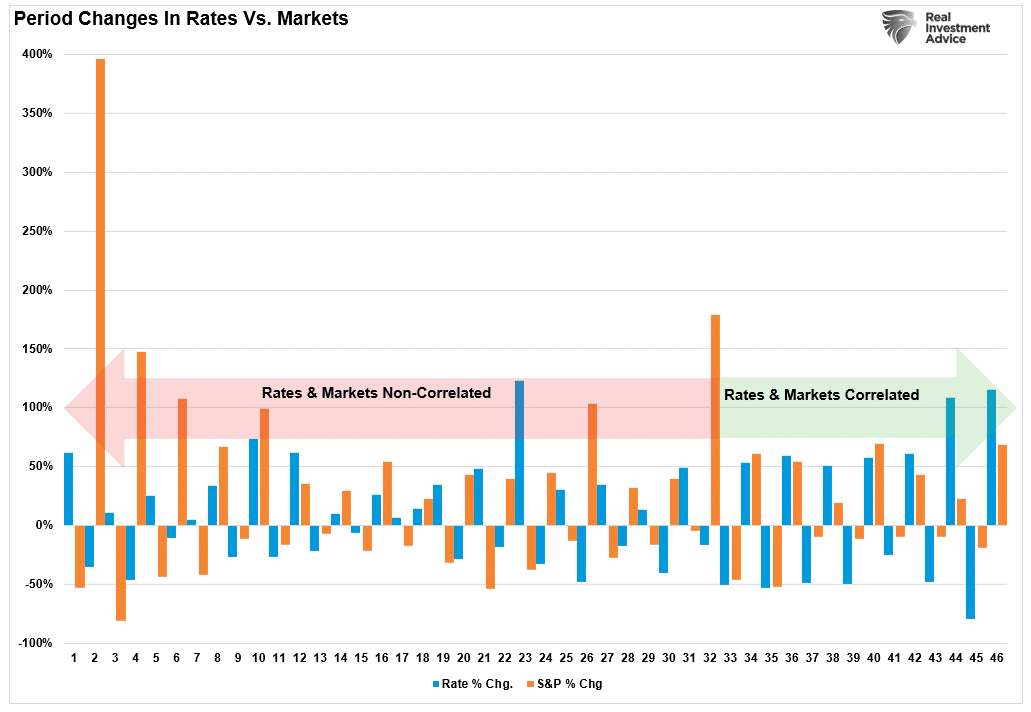
In EVERY period where rates and stocks both rose, most of those gains got forfeited as interest rates slowed economic growth, reduced earnings, or created some crisis.
As Mohammed El-Erian stated in a recent interview:
“Investors should keep an eye on the risk of an abrupt shift from a relative valuation market mindset to an absolute valuation one. If that happens, you should stop worrying about the return on your capital and start worrying about the return of your capital.”
It may be time to start considering owning some bonds.

Portfolio Update
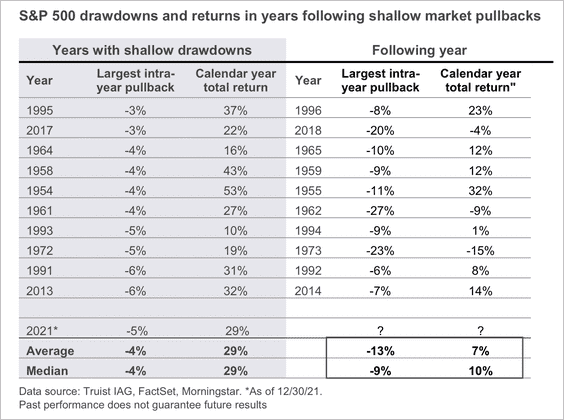
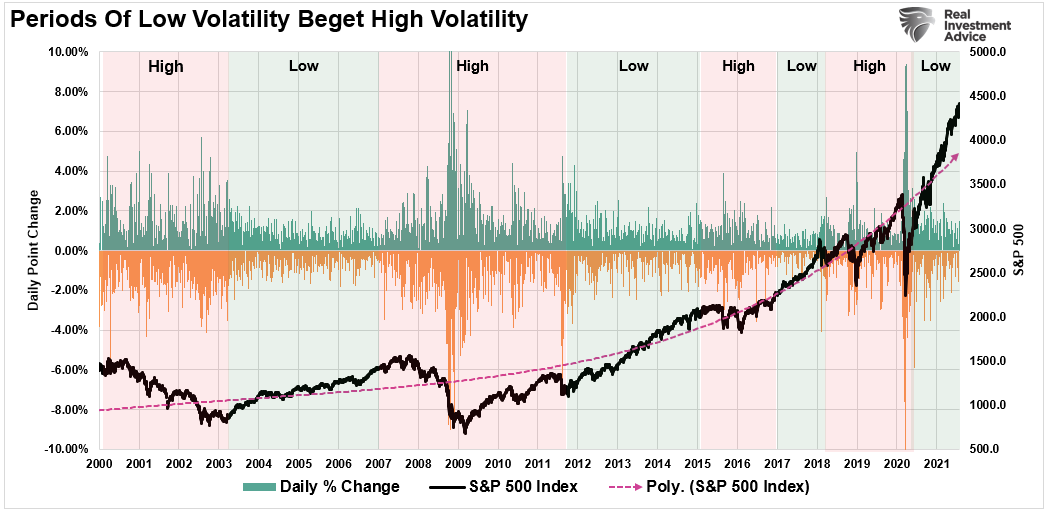
As noted last week, 2021 was a period of very low volatility. But, notably, periods of low volatility beget periods of high volatility.
Hyman Minsky argued there is an inherent instability in financial markets. Such is particularly the case following an abnormally long bullish cycle that spurs an asymmetric rise in market speculation. That speculation eventually results in market instability and collapse. We can view these alternating periods of “stability/instability” by the daily price changes of the index itself.
Importantly, we should be mindful of the risk in our portfolios. If volatility rises due to the reduction of monetary accommodation, then high-beta, over-valued, fundamentally weak companies will suffer the brunt of the selling. As noted above, many of those stocks have already suffered.
With the Fed hiking rates, tapering asset purchases, and global liquidity slowing, a pick-up in volatility would not be a surprise. We are not ready to commit to value in portfolios yet, but we see early evidence of a rotation.
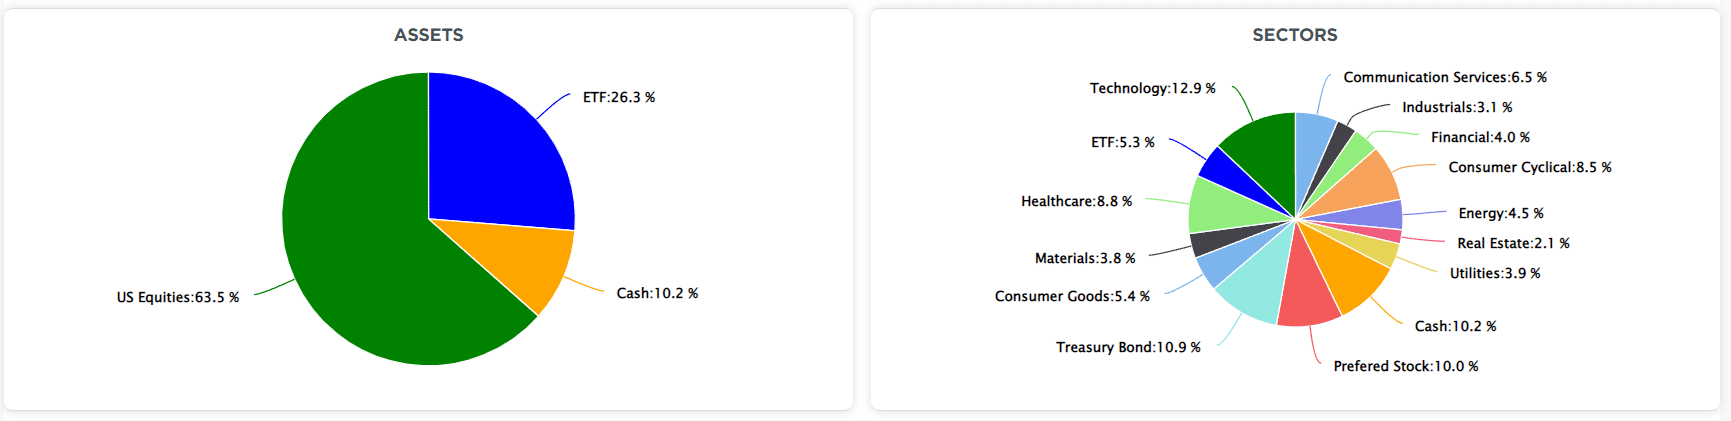
Early this past week, we sold our S&P index trading position, which has started reducing our portfolio from overweight to target weight equities. We have also made minor changes to our bond portfolio to extend our duration as yields rise and are now extremely overbought. (Target Model Weights: 60% stocks / 40% bonds and cash.)
Over the next couple of weeks, we will continue to utilize rallies to reduce high beta stocks in our portfolio and increase exposure to our value-based holdings. These changes will be gradual until volatility declines and the market establishes a new base.
As noted in Friday’s “Investor Resolutions,” pay attention to what the market tells you. Importantly, focus on buying “damaged opportunities,” not “damaged stocks.”
There is a difference.
Market & Sector Analysis
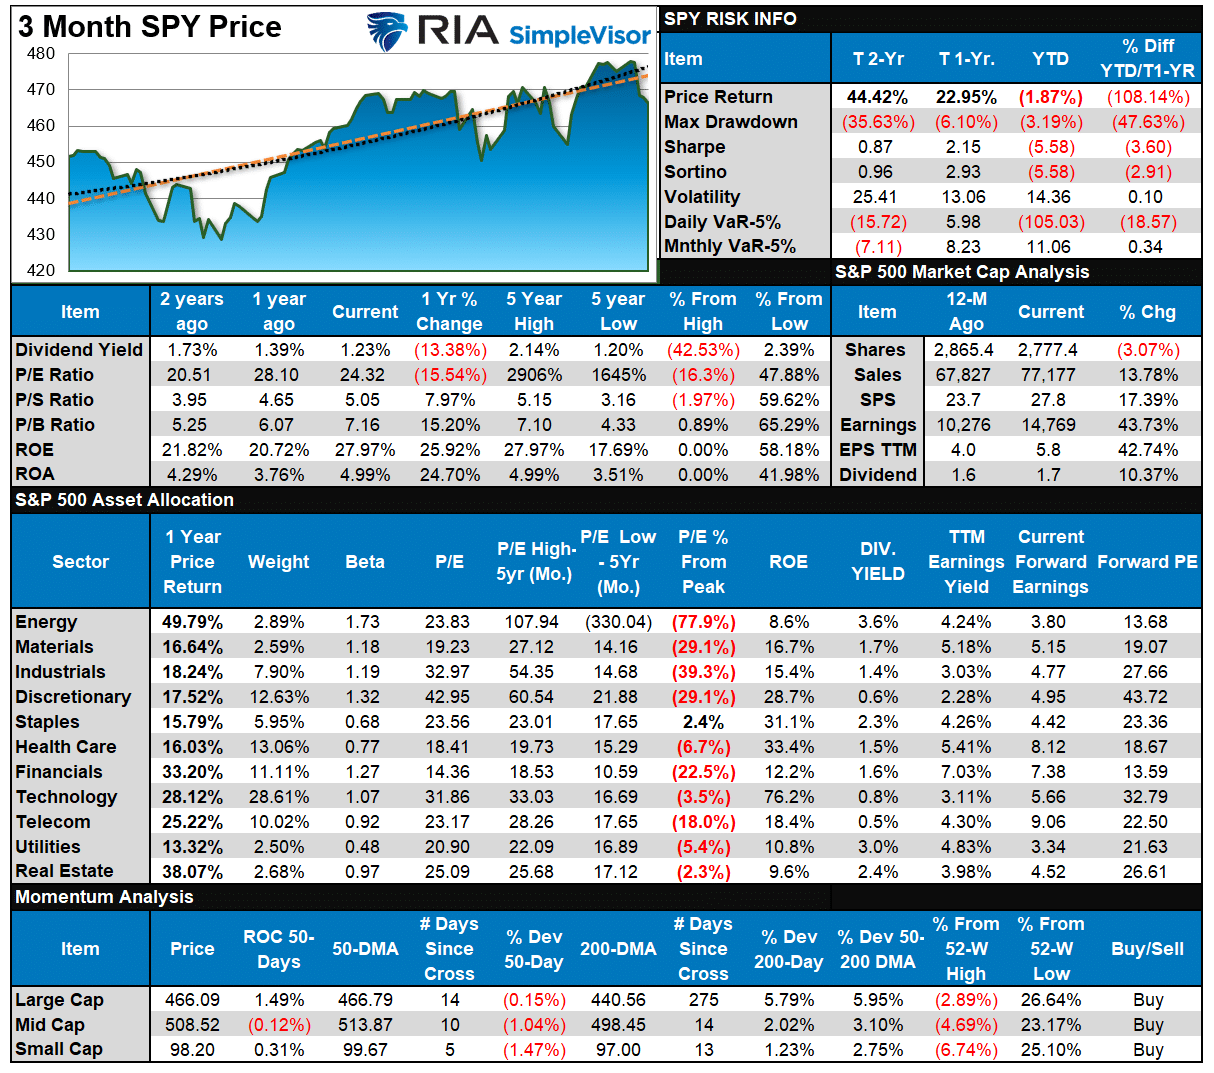
S&P 500 Tear Sheet
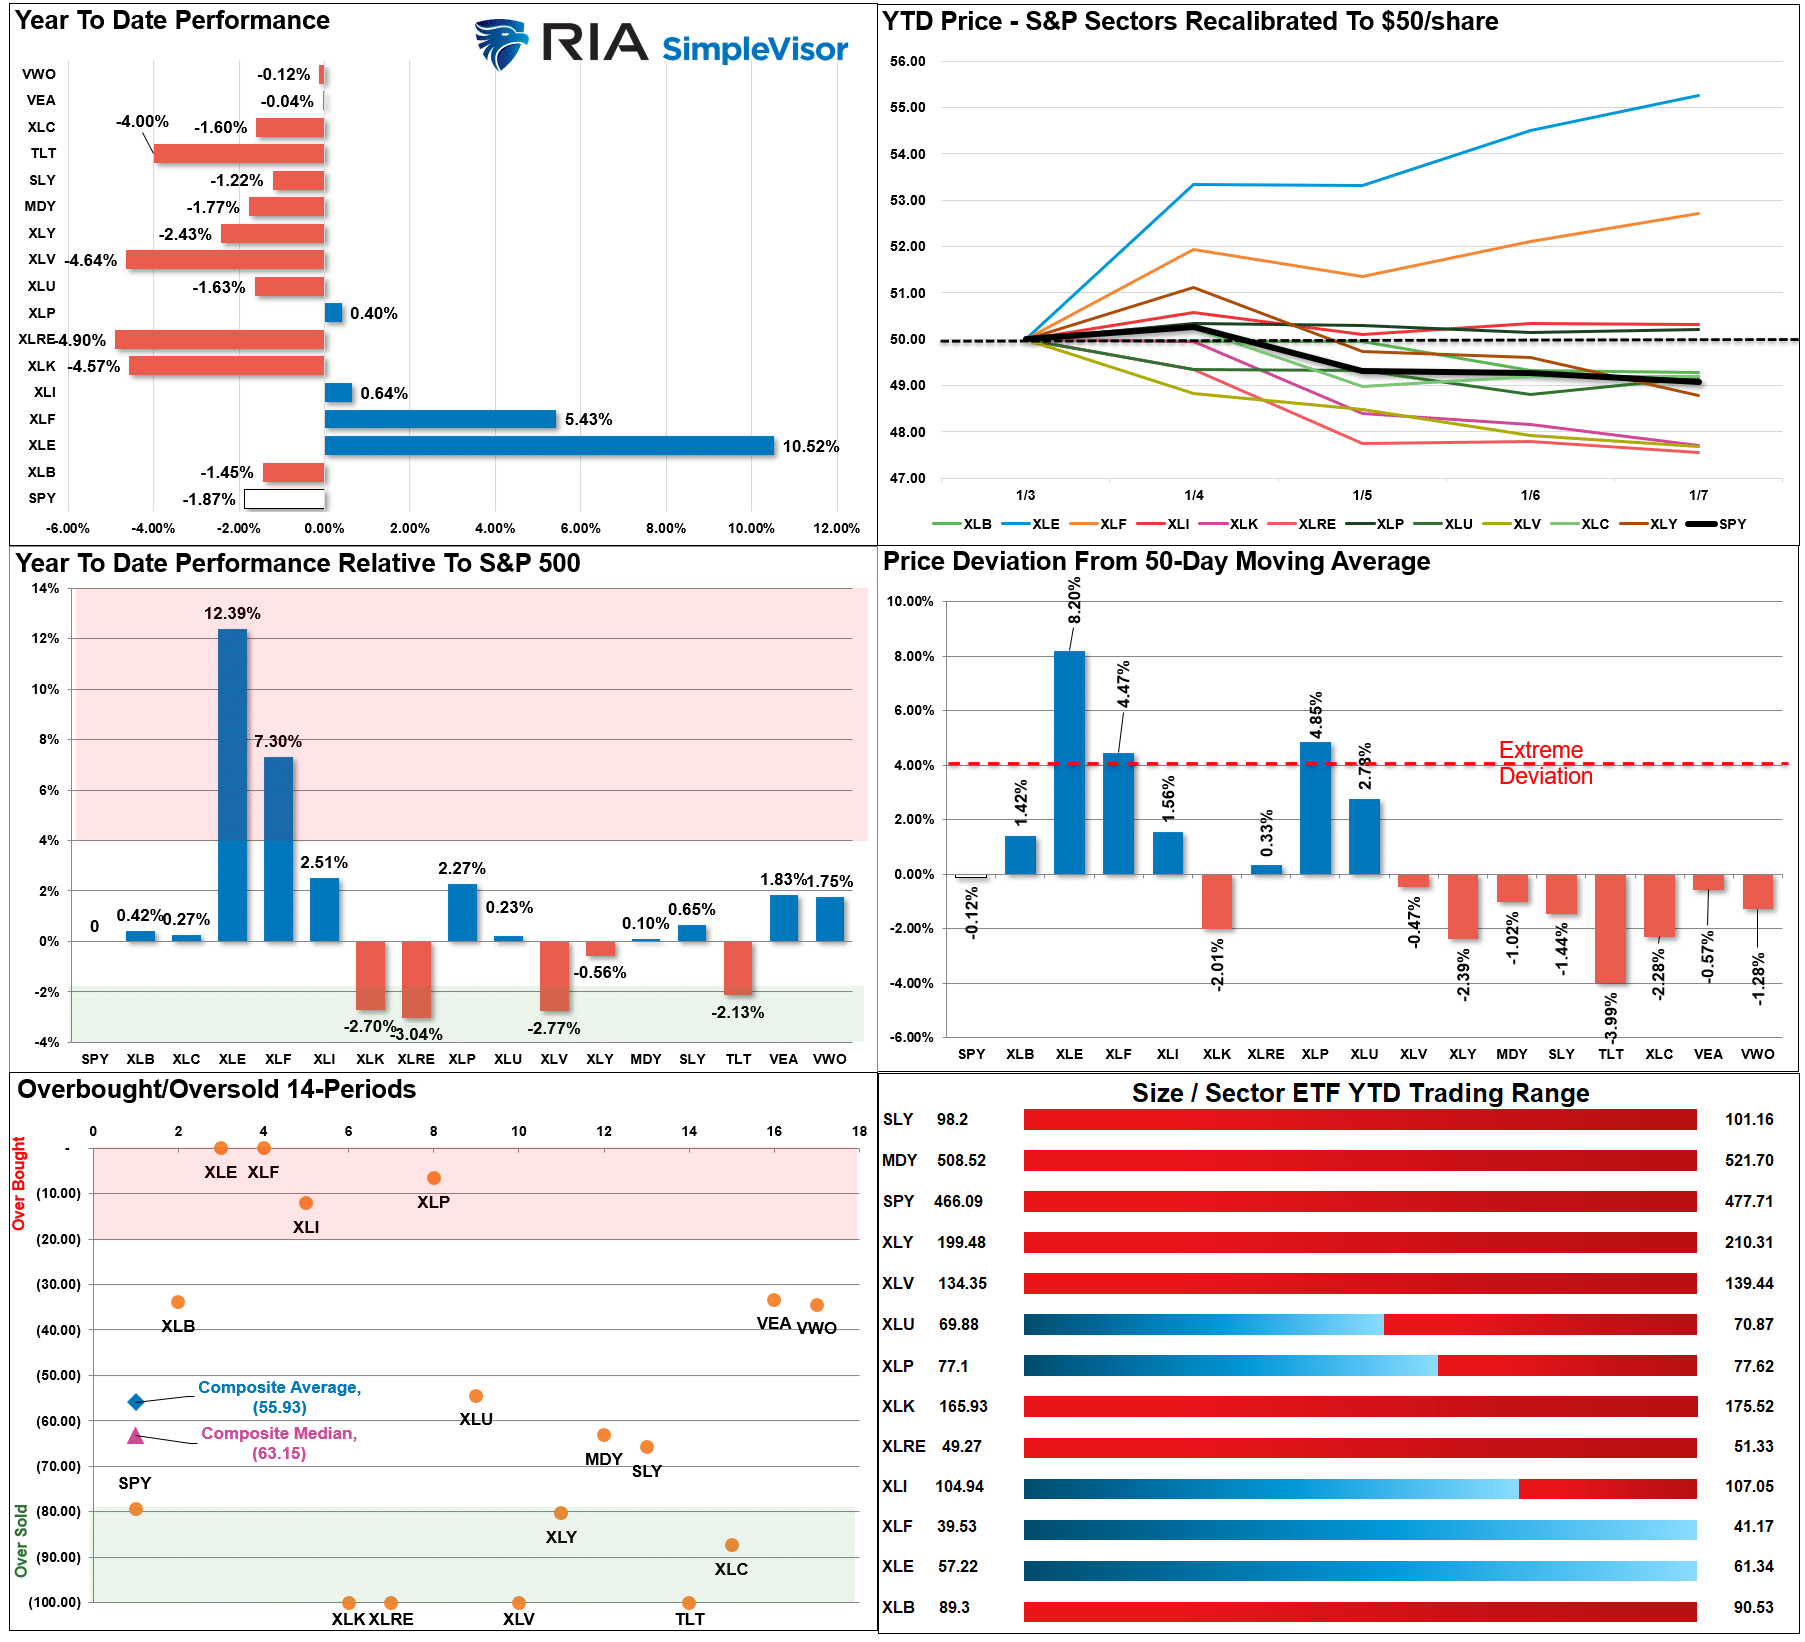
Relative Performance Analysis
Technical Composite
The technical overbought/sold gauge comprises several price indicators (RSI, Williams %R, etc.), measured using “weekly” closing price data. Readings above “80” are considered overbought, and below “20” are oversold. The current reading is 72.97 out of a possible 100.

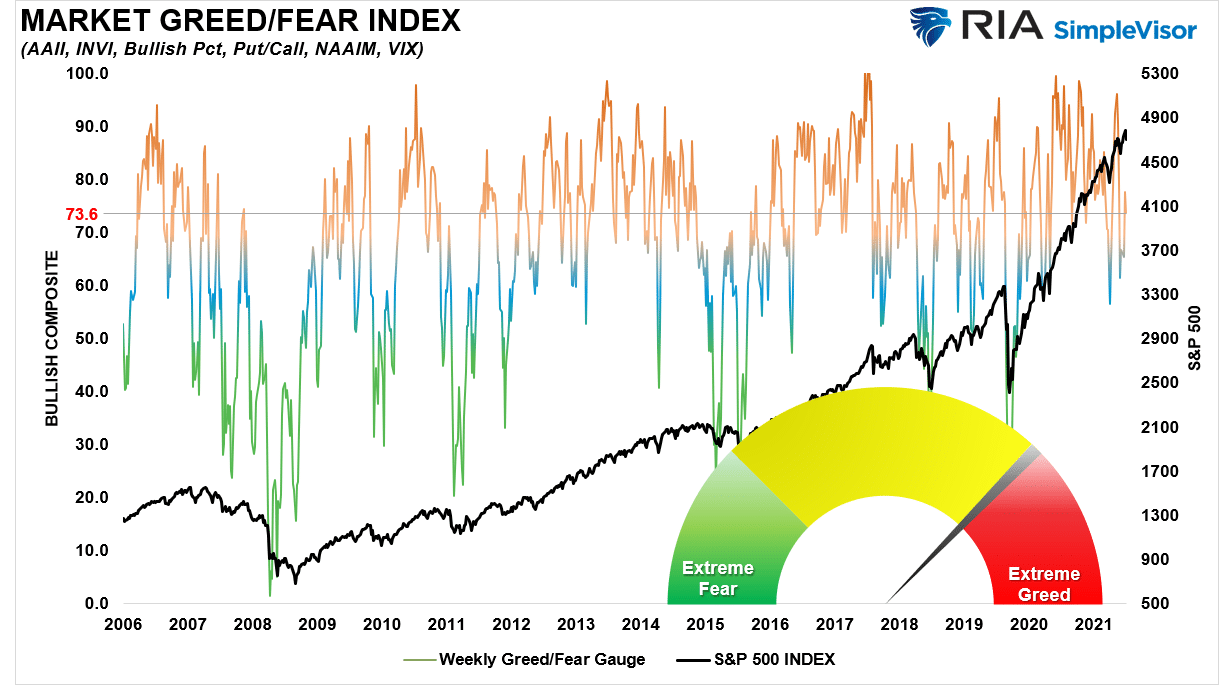
Portfolio Positioning “Fear / Greed” Gauge
Our “Fear/Greed” gauge is how individual and professional investors are “positioning” themselves in the market based on their equity exposure. From a contrarian position, the higher the allocation to equities, to more likely the market is closer to a correction than not. The gauge uses weekly closing data.
NOTE: The Fear/Greed Index measures risk from 0-100. It is a rarity that it reaches levels above 90. The current reading is 67 out of a possible 100.
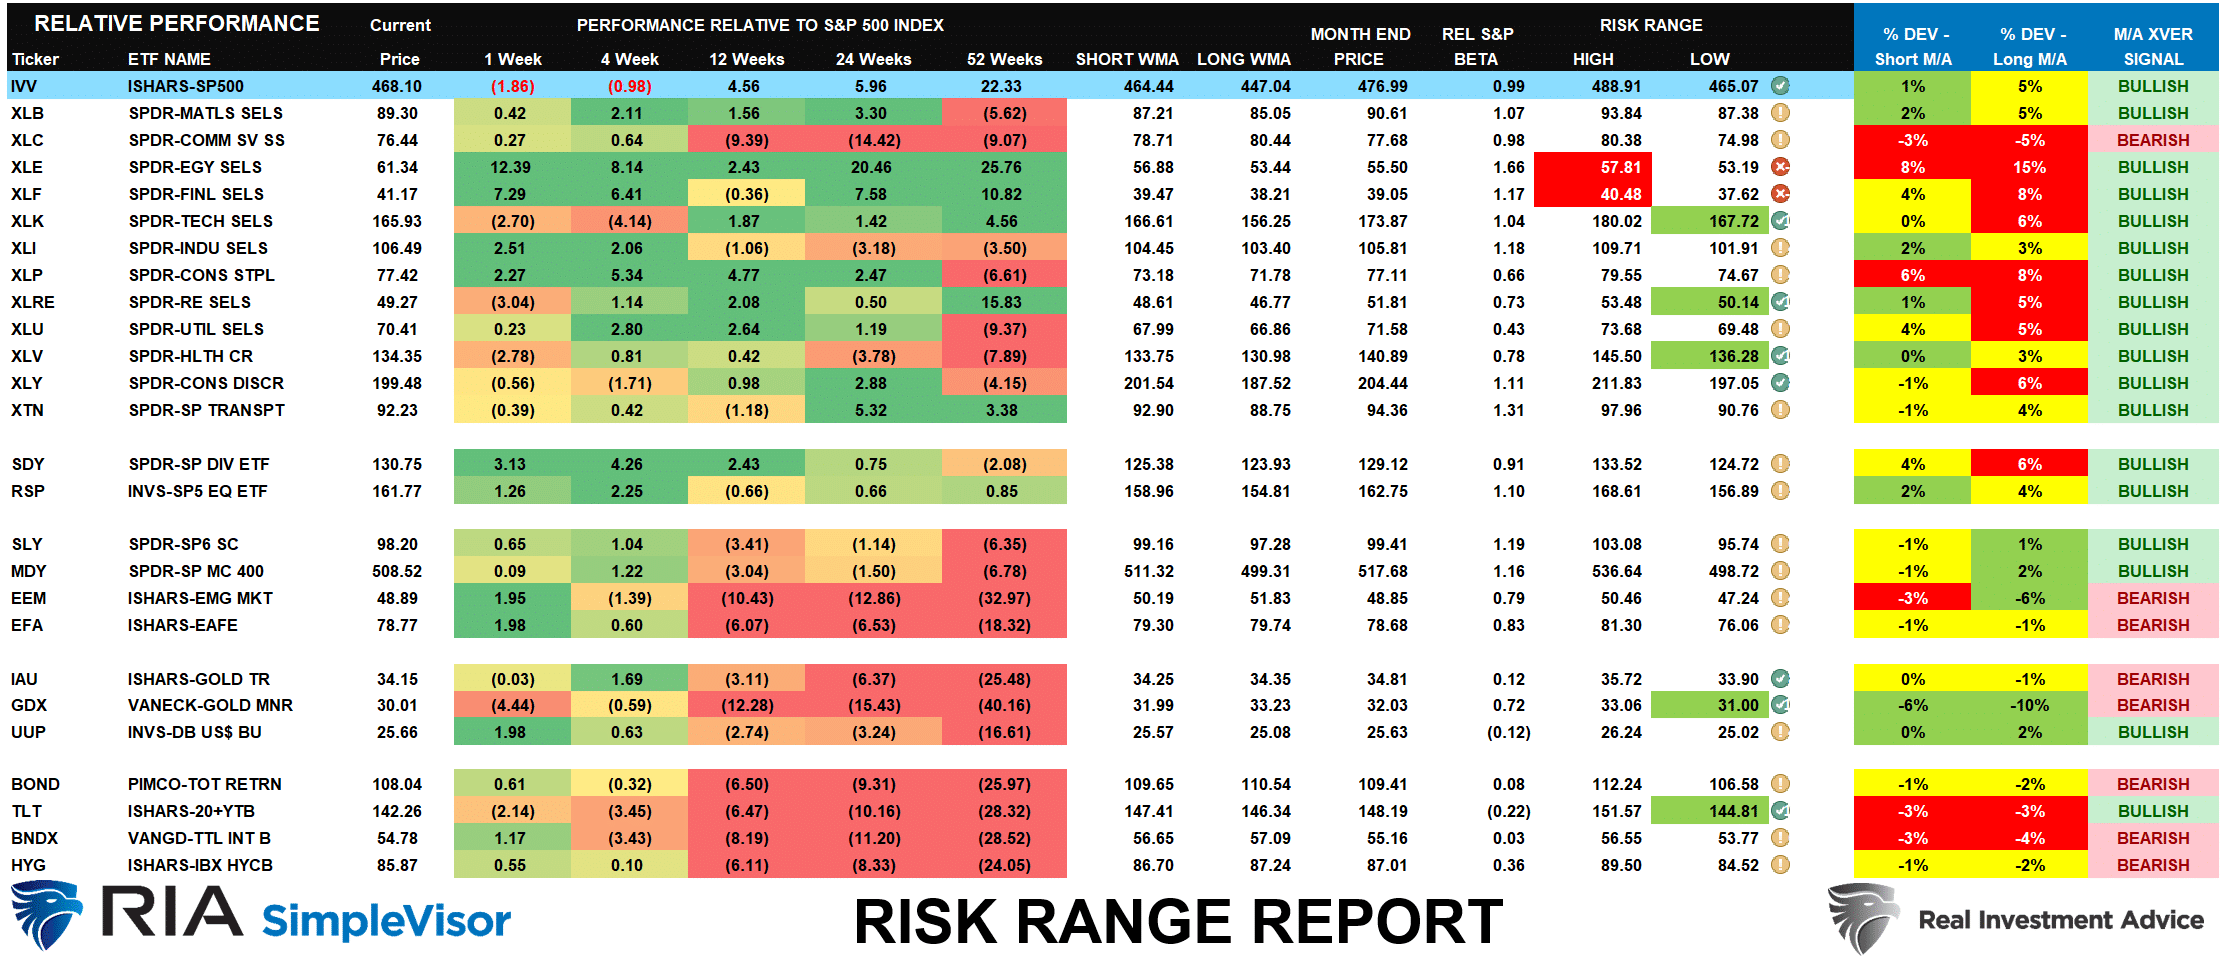
Sector Model Analysis & Risk Ranges
How To Read This Table
- The table compares each sector and market to the S&P 500 index on relative performance.
- “MA XVER” is determined by whether the short-term weekly moving average crosses positively or negatively with the long-term weekly moving average.
- The risk range is a function of the month-end closing price and the “beta” of the sector or market. (Ranges reset on the 1st of each month)
- Table shows the price deviation above and below the weekly moving averages.
Weekly Stock Screens
Each week we will provide three different stock screens generated from SimpleVisor: (RIAPro.net subscribers use your current credentials to log in.)
This week we are scanning for the Top 20:
- Relative Strength Stocks
- Momentum Stocks
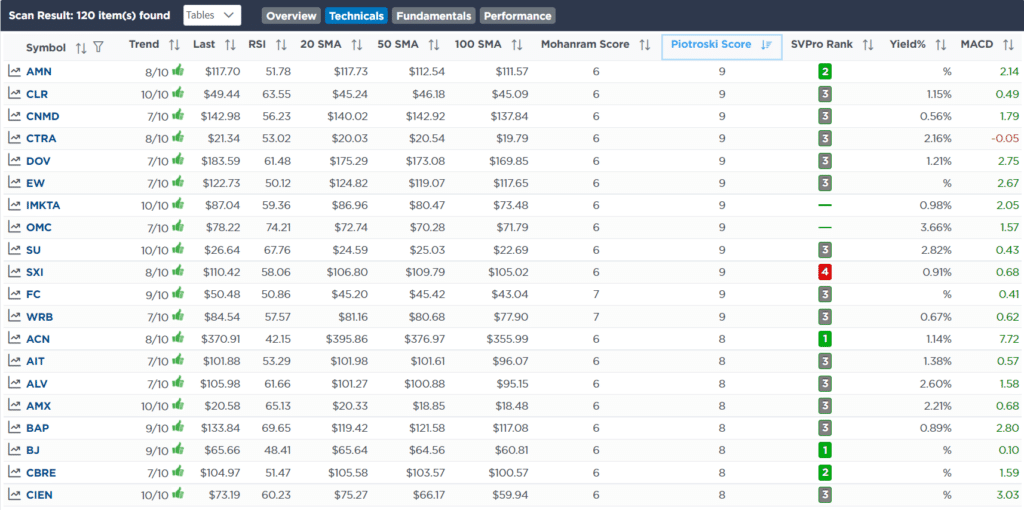
- Technically Strong With Strong Fundamentals
These screens generate portfolio ideas and serve as the starting point for further research.
(Click Images To Enlarge)
RSI Screen

Momentum Screen
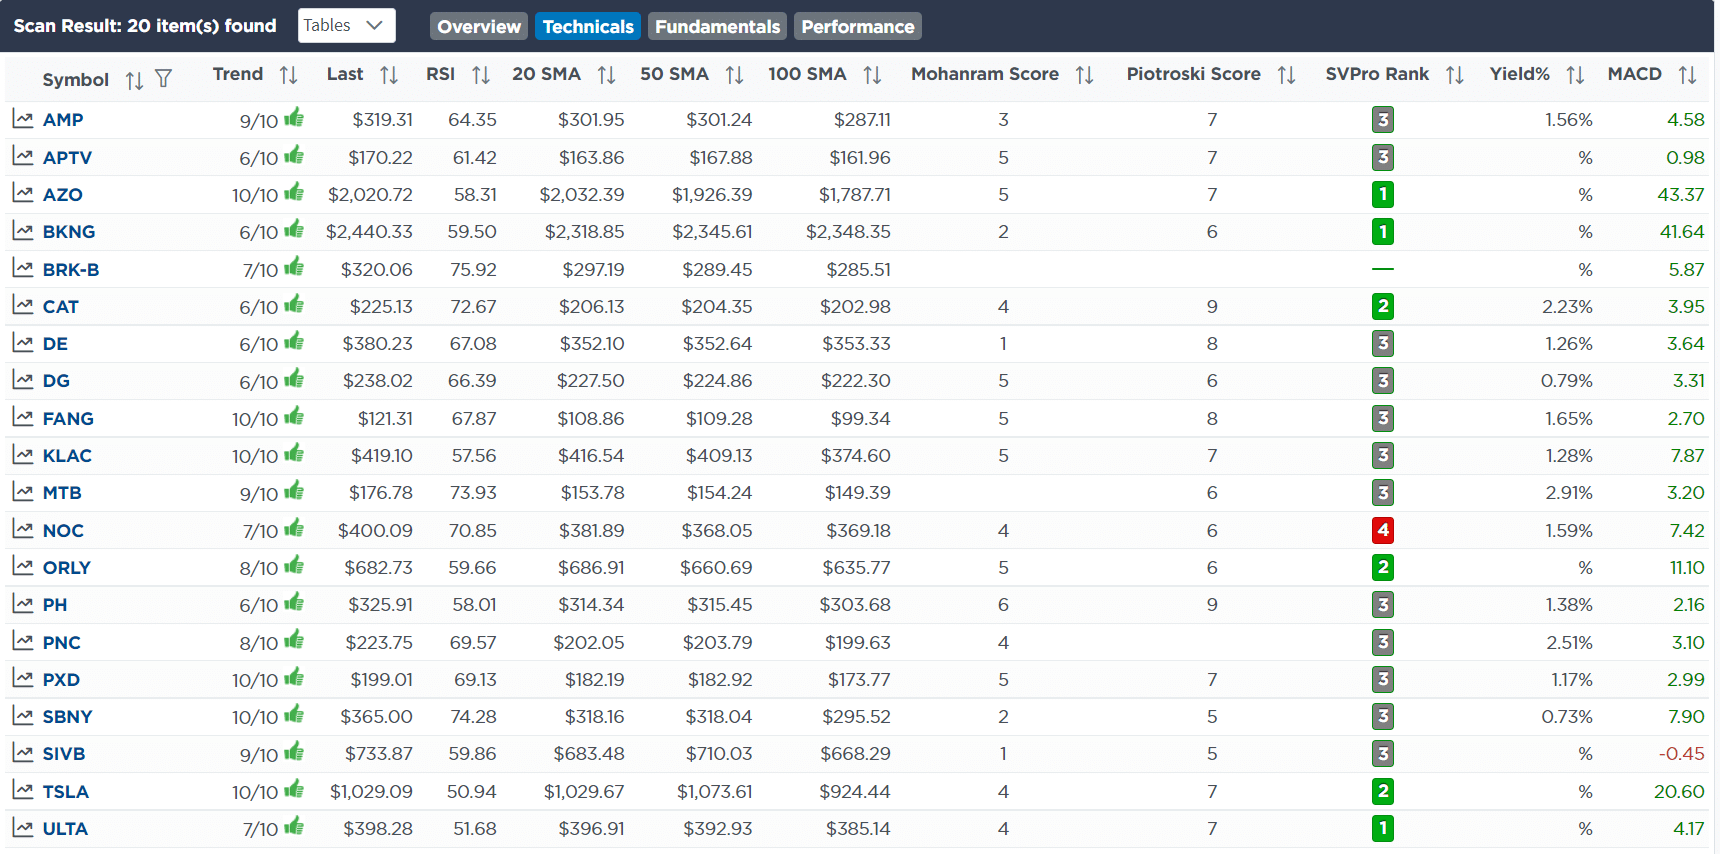
Technical & Fundamental Strength Screen
SimpleVisor Portfolio Changes
We post all of our portfolio changes as they occur at SimpleVisor:
As noted in this morning’s 3-Minutes video, the market is returning to its familiar pattern of a correction to the 50-dma and then a rally to all-time highs, a sideways consolidation, and decline back to support. That correction back to support, as discussed, has previously occurred right around options expiration week.
With that consideration, we sold the remainder of our SPY trading positions. – 01-05-22
Equity & ETF Models
- Sell 100% of the remaining SPY position.
As noted in this morning’s 3-Minutes video, and in our Daily Commentary, bond yields have risen back to more overbought levels. After we previously reduced our duration in our bond portfolios by selling TLT and adding TFLO (floating rate), we are now starting to reverse that trade to increase duration. We are also starting to reduce our SPY trading position on this rally.
As such, this morning we added 1% of TLT and sold 2% of SPY and sold 2% of FLOT to make room for TLT. We are nibbling on TLT as it is now oversold, at key support, and turning on a buy signal. We will likely continue to remove SPY over the coming days and get back to equal weight with the benchmark. – 01-04-22
Equity & ETF Models
- Add 1% of the portfolio to TLT
- Sell 2% of the portfolio in TFLO
- Reduce the SPY trading position by 2% of the portfolio.

Lance Roberts, CIO
Have a great week!


