
Inside This Week’s Bull Bear Report
- Bumpy Start To New Year
- FOMC Minutes Say No Pivot Is Coming
- How We Are Trading It
- Research Report – The Fed’s 7% Solution
- Youtube – Weekly Market Review With Adam Taggart
- Stock Of The Week
- Daily Commentary Bits
- Market Statistics
- Stock Screens
- Portfolio Trades This Week
A Bumpy Start To The New Year
The recent release of the FOMC minutes and stronger-than-expected ADP employment data led to a sell-off early in the week. However, Friday’s more robust employment report led to a massive surge in stocks as wages showed some initial weakness. Once again, and having failed to learn their lesson, the bulls piled into stocks hoping for a “Fed pivot.”
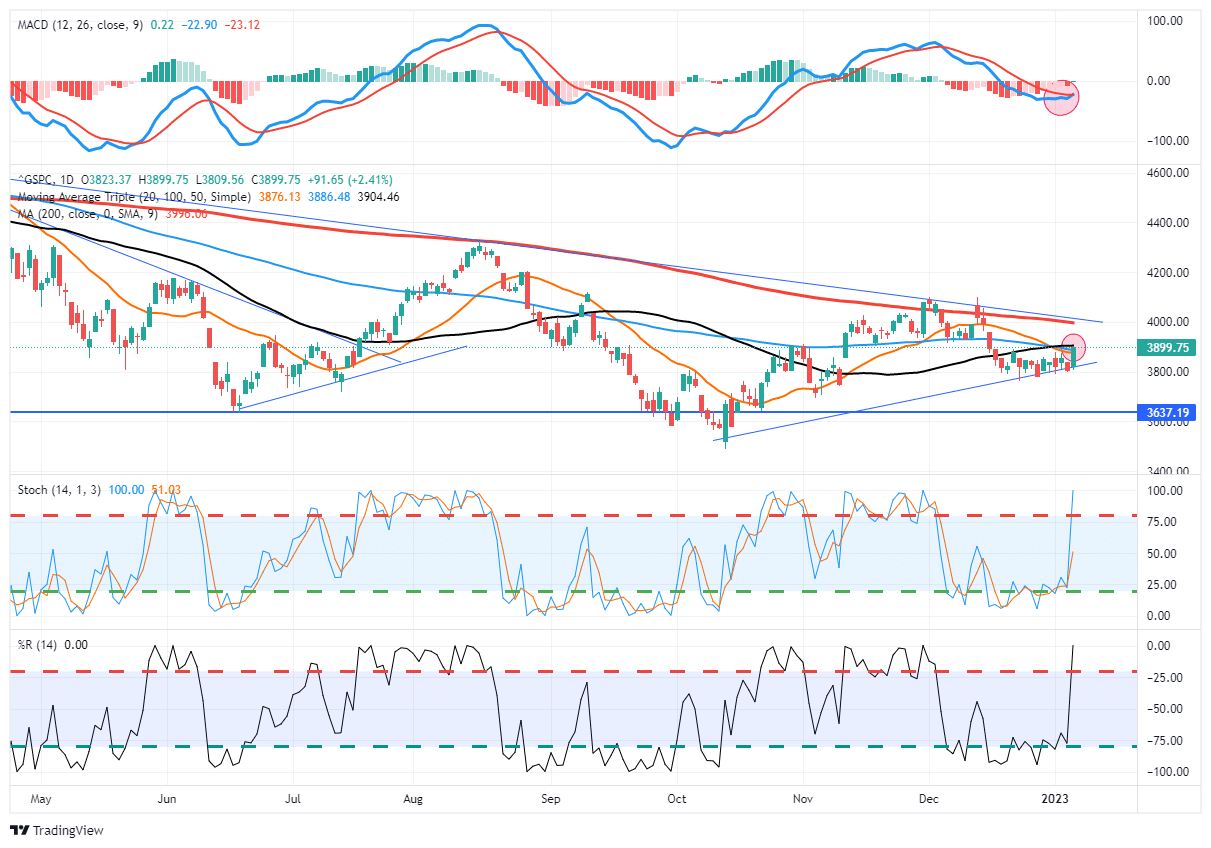
The good news is that the rally broke the market out of the recent consolidation range from the last half of December and pushed prices into the cluster of resistance around 3900. Notably, the market held support at the rising trend line from the October lows. While the market has surged into short-term overbought territory, a rally toward the 200-DMA is possible as the MACD “buy signal” crosses higher.
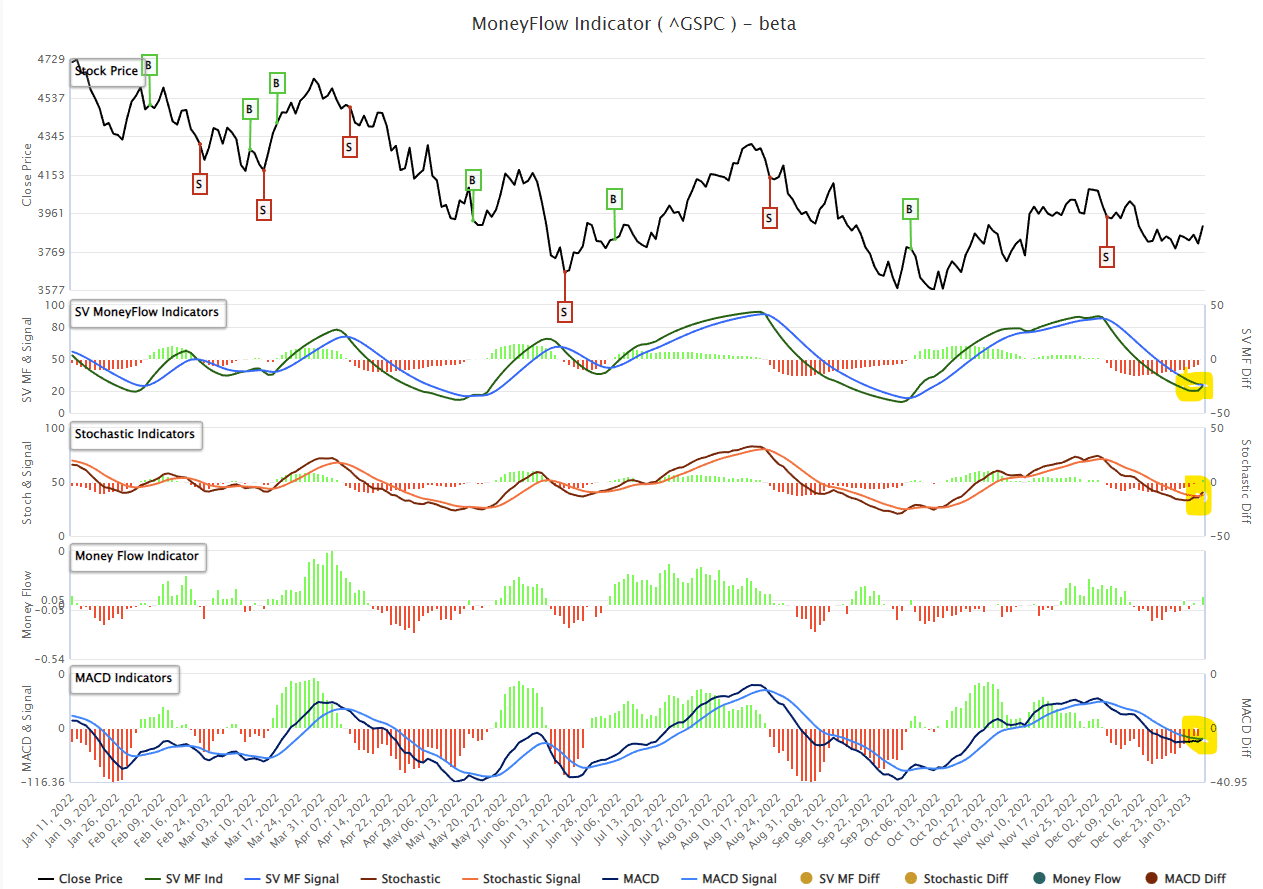
On SimpleVisor.com, we provide a proprietary indicator that tracks money flows into and out of the market. That signal also confirms the MACD “buy signal” as well, adding further support to a short-term rally.
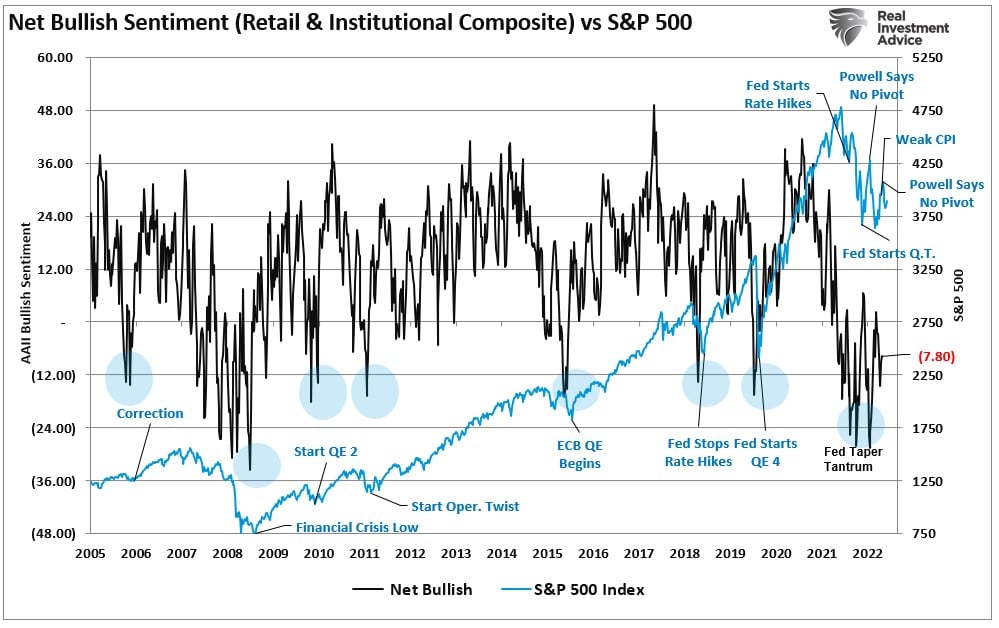
Furthermore, sentiment remains negative enough to support a short-term rally.
However, as we will discuss this week, the FOMC has not changed its tone about tightening monetary policy. We have previously seen these “pivot hope” rallies that Jerome Powell and the Fed repeatedly swat down. While we will likely have a tradeable rally, it remains worth selling into and trading accordingly. The headwinds of higher rates, quantitative tightening, and a drain of “stimulus” from the economy have not changed. If it wasn’t a good idea to “fight the Fed” during QE, it probably remains a good idea not to do so during QT.
For now, trade accordingly as we drift from one “pivot hope” report to the next, even though the Fed remains clear that no “pivot” is coming.
Need Help With Your Investing Strategy?
Are you looking for complete financial, insurance, and estate planning? Need a risk-managed portfolio management strategy to grow and protect your savings? Whatever your needs are, we are here to help.

FOMC Says No Pivot Is Coming
On Wednesday, the market got the release of the minutes from the latest FOMC meeting in December. The minutes were unsurprising, at least to us, as they reiterated the same message the FOMC delivered in all of 2022. To wit:
“No participants anticipated that it would be appropriate to begin reducing the federal funds rate target in 2023. Participants generally observed that a restrictive policy stance would need to be maintained until the incoming data provided confidence that inflation was on a sustained downward path to 2 percent, which was likely to take some time. In view of the persistent and unacceptably high level of inflation, several participants commented that historical experience cautioned against prematurely loosening monetary policy.”
There are a couple of important points made in that statement.
- The FOMC isn’t looking to have inflation at 2% before changing its policy stance. They want to see a clear and sustained pathway to 2%.
- The FOMC fears inflation will come down and then reaccelerate, as seen in the 70s. (See chart)
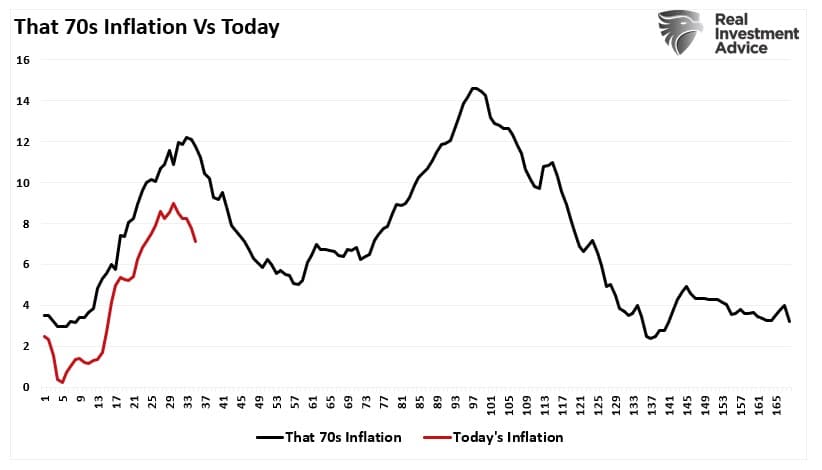
It is worth noting that the floor for inflation in the 70s was 4% versus 2% today. Such is because debt levels were dramatically lower, economic growth was stronger, and there was no Federal deficit. Today, the economy can’t sustain higher interest rates or inflation for very long without more severe economic consequences.
Nonetheless, despite the FOMC reiterating there is “no pivot” coming on monetary policy anytime soon, the market expects rate cuts as soon as July of this year.
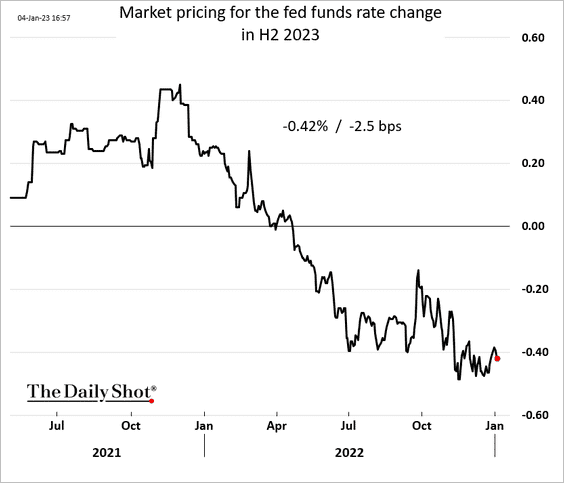
While the markets continue to defy the FOMC, hoping for a pivot, there is no reason outside of a financial event, a deep recession, or both.
Unfortunately, while market participants keep stocks elevated in hopes of a pivot, such is working against them.
Market Continues To Do The Opposite Of What The FOMC Wants
As we discussed, the Fed wants “tighter,” not “looser,” financial conditions.
“Higher asset prices represent looser, not tighter, monetary policy. Rising asset prices boost consumer confidence and act to ease the very financial conditions the Fed is trying to tighten. While financial conditions have tightened recently between higher interest rates and surging inflation, they remain low. Such is hardly the environment desired by the Fed to quell inflation.”
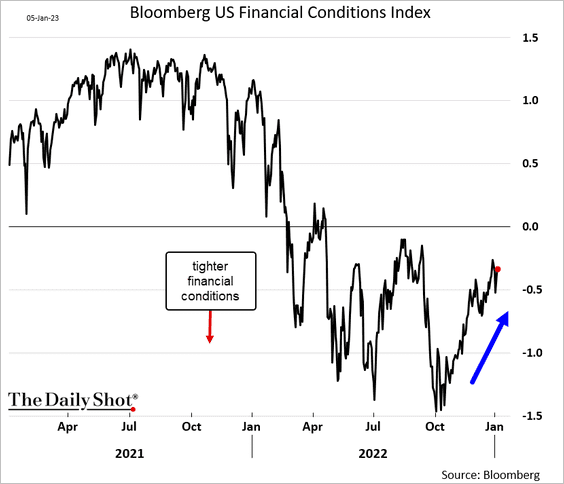
The FOMC needs substantially tighter financial conditions to slow economic demand and increase unemployment, lowering inflation toward target levels. Tighter financial conditions are a function of several items:
- A stronger US dollar relative to other currencies (Check)
- Wider spreads across bond markets (There is no credit stress currently)
- Reduction in liquidity (Quantitative Tightening or QT)
- Lower stock prices.
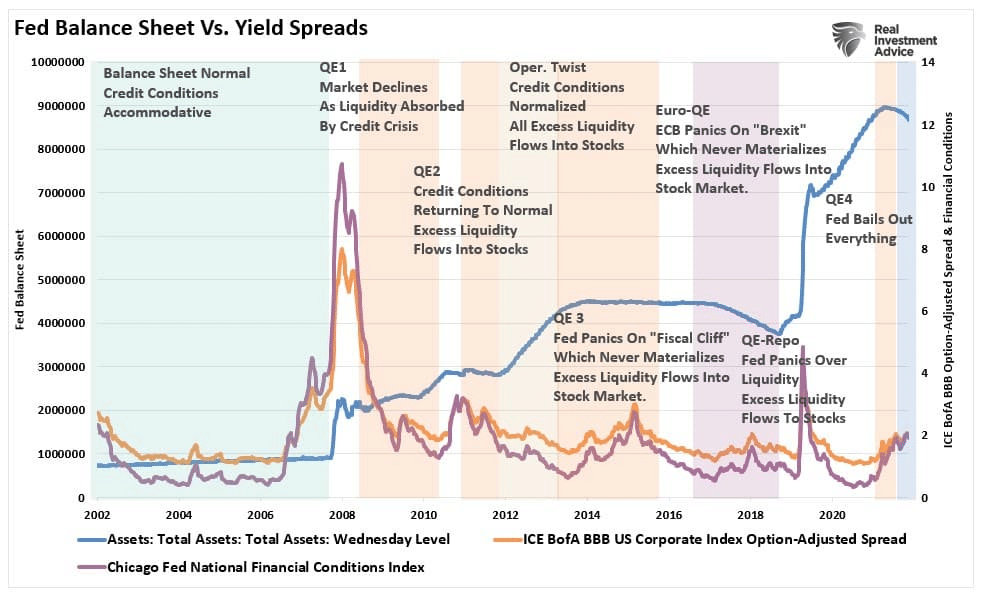
The more bullish market participants should be aware the Fed is ultimately pushing for lower stock prices. The Fed is removing liquidity by reducing its balance sheet twice as fast as in 2018. For those who don’t remember, the last QT ended in a 20% market plunge over three months. Today, even with weaker inflation, QT is not ending anytime soon.

We noted in November that:
It will not be surprising to see Federal Reserve speakers try and swat down asset prices with continued hawkish rhetoric. As far as a ‘pivot’ goes, that still seems quite a long way off.”
That point was repeated in the latest FOMC minutes.
“Participants noted that, because monetary policy worked importantly through financial markets, an unwarranted easing in financial conditions, especially if driven by a misperception by the public of the Committee’s reaction function, would complicate the Committee’s effort to restore price stability. Several participants commented that the medians of participants’ assessments for the appropriate path of the federal funds rate in the Summary of Economic Projections, which tracked notably above market-based measures of policy rate expectations, underscored the Committee’s strong commitment to returning inflation to its 2 percent goal.”
As noted, the FOMC wants a “controlled burn” of asset prices lower, not higher. I would suspect that at some point, market participants will realize that the FOMC is serious about its mission.
However, for now, hope remains.
Risks Of A Recession Are Elevated
Heading into 2023, market participants are starting to coalesce around the idea the economy will avoid a recession. To wit:
“We believe the Fed will stop QT sometime in the Fall before they begin lowering rates. It is hard for us to see a recession of any significance occurring in 2023.” – Brett Ewing, Chief Market Strategist, First Franklin.
Maybe that happens. Anything is certainly a possibility.
However, that is essentially swimming against the stream of what the FOMC is trying to achieve. Again, if the goal is to quell inflation, then economic demand must fall. Even the FOMC is now admitting a recession is plausible.
“Moreover, the sluggish growth in real private domestic spending expected over the next year, a subdued global economic outlook, and persistently tight financial conditions were seen as tilting the risks to the downside around the baseline projection for real economic activity, and the staff still viewed the possibility of a recession sometime over the next year as a plausible alternative to the baseline”
The financial markets have yet to adjust to accommodate for a substantially weaker, if not recessionary, economy.
As discussed previously, earnings estimates remain highly optimistic and deviated from their long-term growth trend despite the recent cuts.
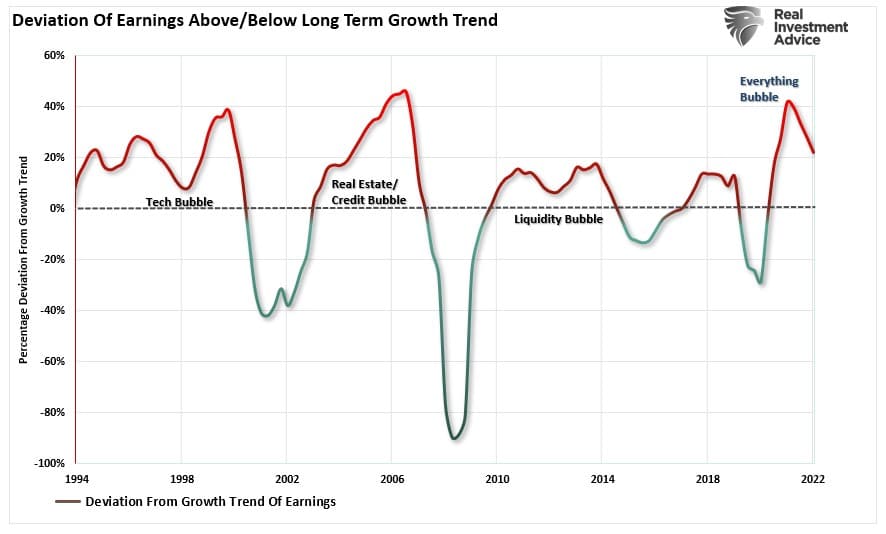
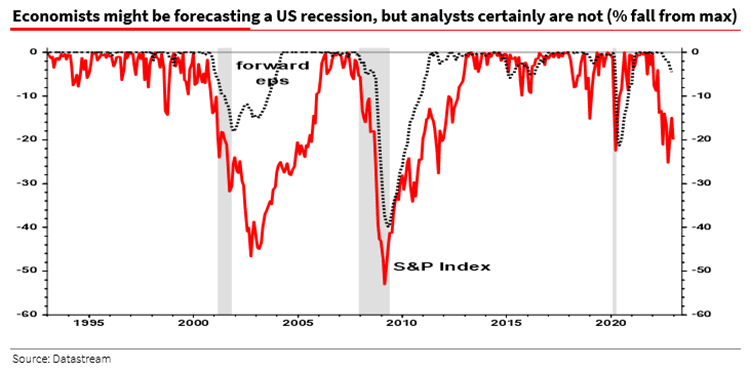
As my friend and colleague Albert Edwards of Societe Generale recently noted:
“I keep being told this is the most widely anticipated recession ever, and it must already be priced in. But the decline in 12-month forward EPS of only 4% (from the peak) doesn’t suggest so.”
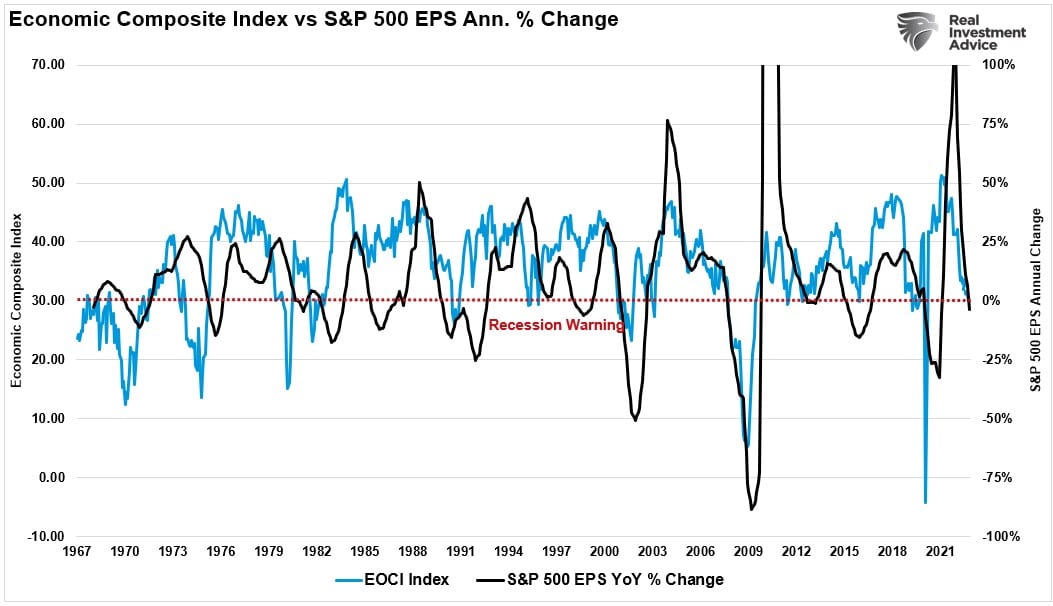
Furthermore, the rash of weak economic data also suggests that the risk of a recession has risen markedly, as noted by our broad economic activity composite index. If that data weakens further, which is the Fed’s goal, such also suggests lower earnings.
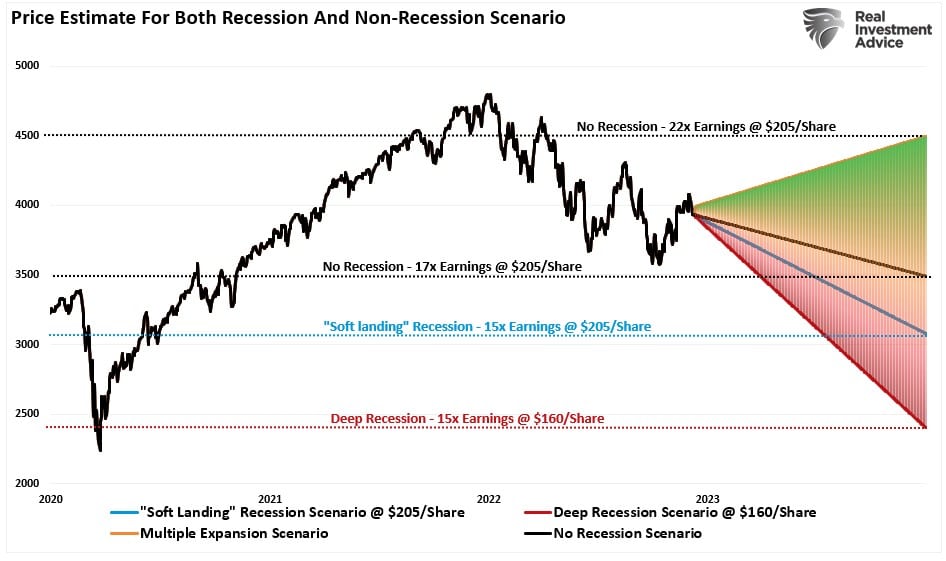
Given current valuations, as discussed in more detail here, the forecast for asset prices later in the year is not extremely bullish.
“Adding the bullish scenario to our projection chart gives us a full range of options for 2023, which run the gamut from 4500 to 2400, depending on the various outcomes.”
Here is our concern with the bullish scenario. It entirely depends on a “no recession” outcome, and the Fed must reverse its monetary tightening. The issue with that view is that IF the economy does indeed have a soft landing, there is no reason for the Federal Reserve to reverse reducing its balance sheet or lower interest rates.
More importantly, the problem with the bullish forecast is the rise in asset prices eases financial conditions, which reduces the Fed’s ability to bring down inflation. Such would also presumably mean employment remains strong along with wage growth, elevating inflationary pressures.
While the bullish scenario is possible, that outcome faces many challenges in 2023, given the market already trades at fairly lofty valuations. Even in a “soft landing” environment, earnings should weaken, which makes current valuations at 22x earnings more challenging to sustain.
The bottom line is 2023 will likely be another challenging year to navigate.
Not Getting The Bull Bear Report Each Week In Your Mailbox? Subscribe Here For Free.
How We Are Trading It
As the New Year begins, we enter the year with a substantially underweight equity position, a bond sleeve that is primarily short-duration, and a very heavy overweighting of cash. The problem with this allocation is that we will underperform if the market rallies substantially. Therefore, we plan to remain nimble and utilize our liquidity to trade markets from more extreme overbought or oversold positions.
If you haven’t read our blog on “Why Gardening Can Help You Manage Your Portfolio Better,” the following excerpt helps clarify our view for this year.
“Being a good gardener, or “having a green thumb,” is not a function of “luck,” but rather carefully planned actions to ensure the garden grows, the bounty gets harvested, and the garden is replanted.
Therefore, to have a successful and bountiful garden, we must:”
- Prepare the soil (accumulate enough cash to build a properly diversified allocation)
- Plant according to the season (build the allocation based on the current market cycle.)
- Water and fertilize (add cash regularly to the portfolio for buying opportunities)
- Weed (sell losers and laggards, weeds will eventually “choke” off the other plants)
- Harvest (take profits regularly; otherwise, “the bounty rots on the vine”)
- Plant again according to the season (add new investments at the right time)
You don’t have to do everything perfectly to succeed in growing wealth over the longer term. The trick is not to make a mistake that kills the whole garden at once.
As we head into the New Year, it is worth repeating the 15-portfolio management rules to navigate whatever lies ahead. The reason is that despite our best efforts, no one knows what the market will do in a week, much less a year from now. Therefore, the best thing we can do for our portfolios is to have a set of rules to follow to navigate whatever comes our way.
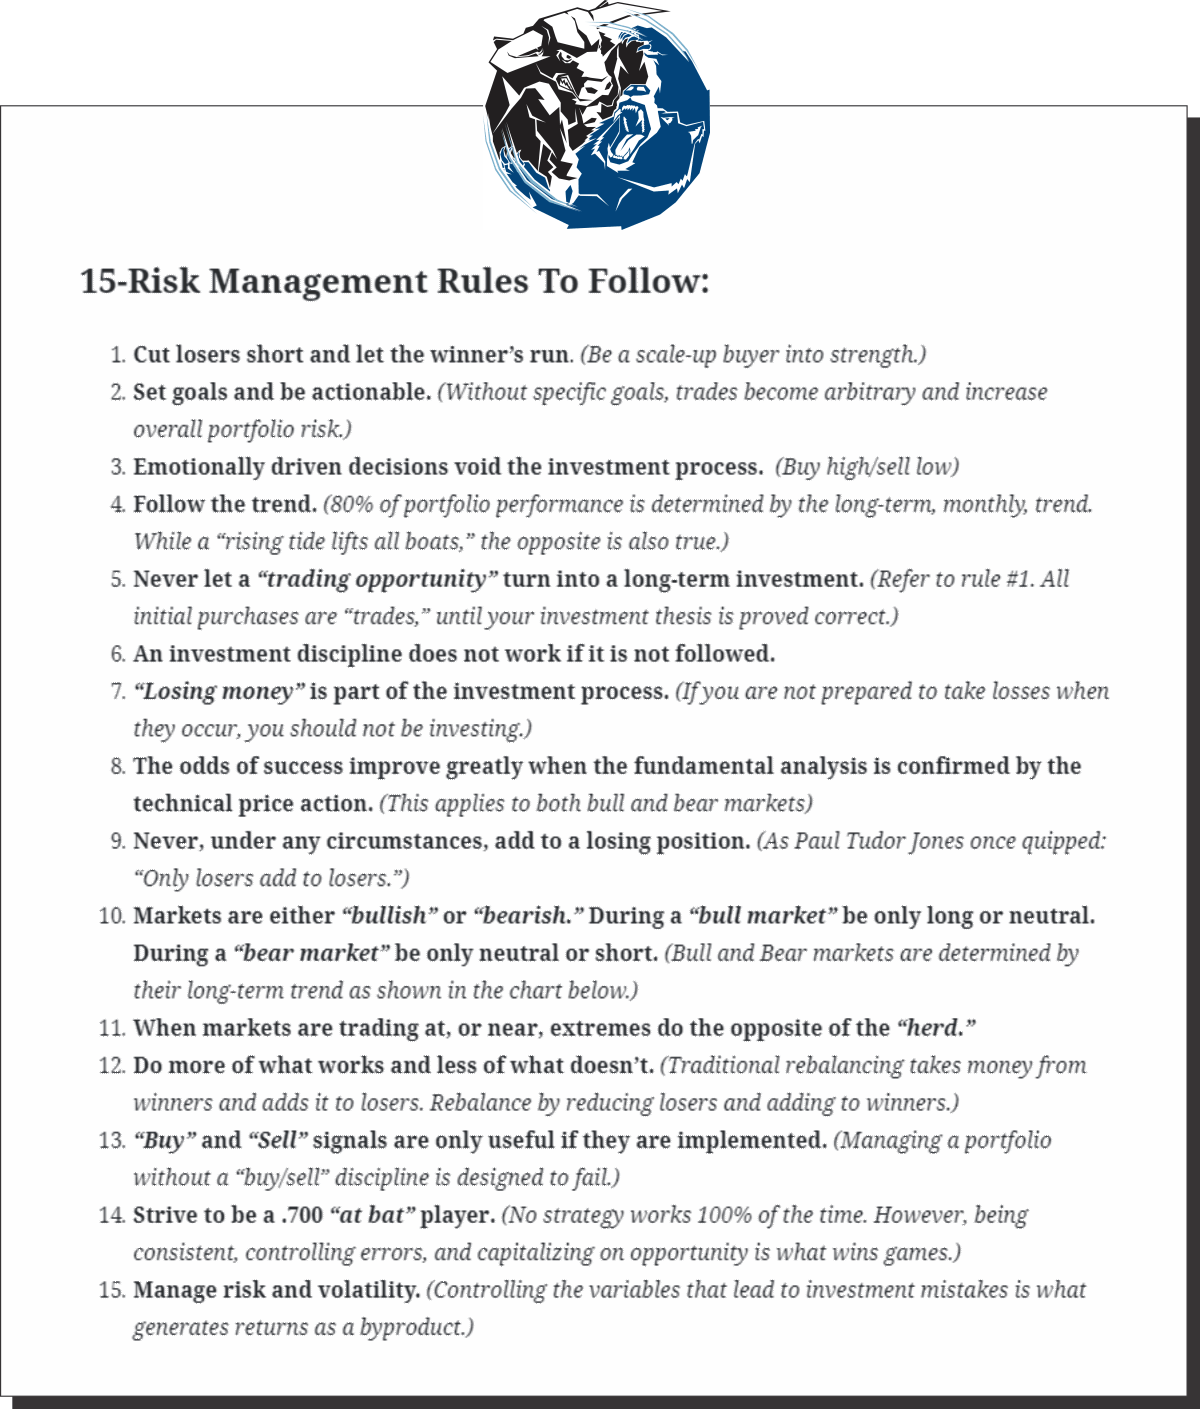
As we stated previously, these won’t guarantee you absolute success in the markets, but they will at least keep you from getting crushed.
We sincerely wish you a Happy and Prosperous New Year.
See you next week.
Research Report
Subscribe To “Before The Bell” For Daily Trading Updates (Formerly 3-Minutes)
We have set up a separate channel JUST for our short daily market updates. Be sure and subscribe to THIS CHANNEL to receive daily notifications before the market opens.
Subscribe To Our Youtube Channel To Get Notified Of All Our Videos
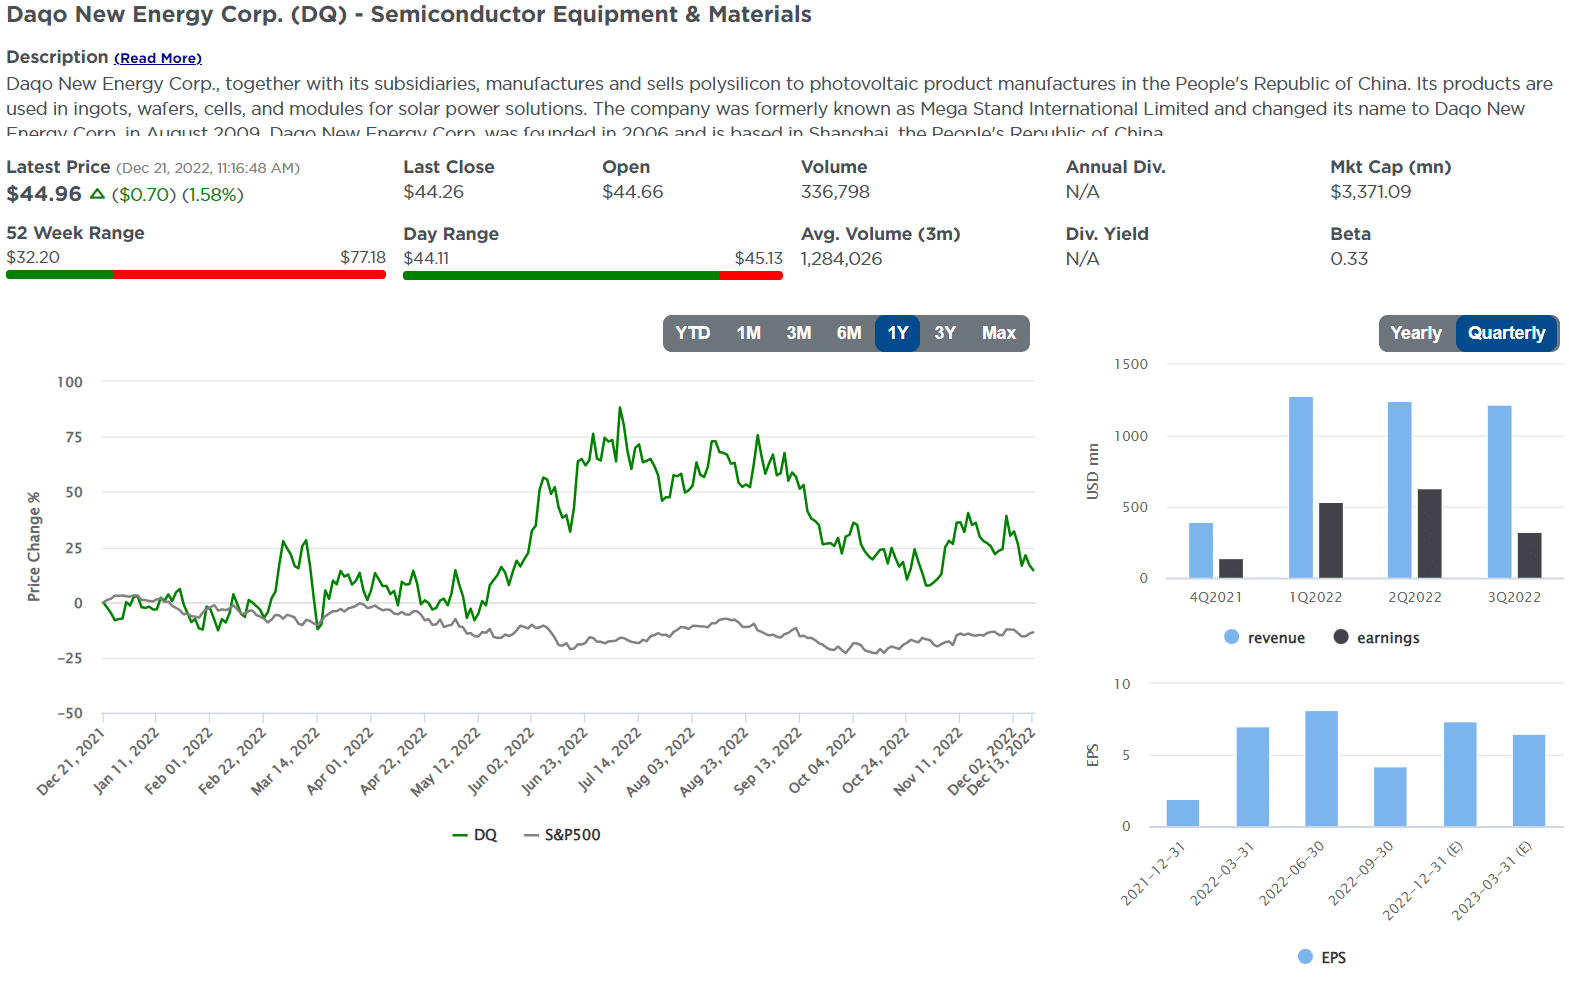
Stock Of The Week In Review
We have done value scans on large and small-cap stocks in the past few months, so it is time to present a value screen on mid-cap stocks. Stocks in this scan have a market cap between $2 billion and $10 billion. Mid-cap stocks tend to offer more growth than large-cap stocks and less price volatility than small-cap stocks.
Screening Criteria
We considered the following factors when screening:
- P/S <1
- P/B <1
- P/E <10
- Forward P/E <15
- PEG Ratio <1
- Return on Assets >15%
- Market Cap Between $2 and $10 billion
Here is a link to the full SimpleVisor Article For Step-By-Step Screening Instructions.
Here is one of the companies we screened.
Login to Simplevisor.com to read the full 5-For-Friday report.
Daily Commentary Bits
Large Or Small Cap Stocks For 2023
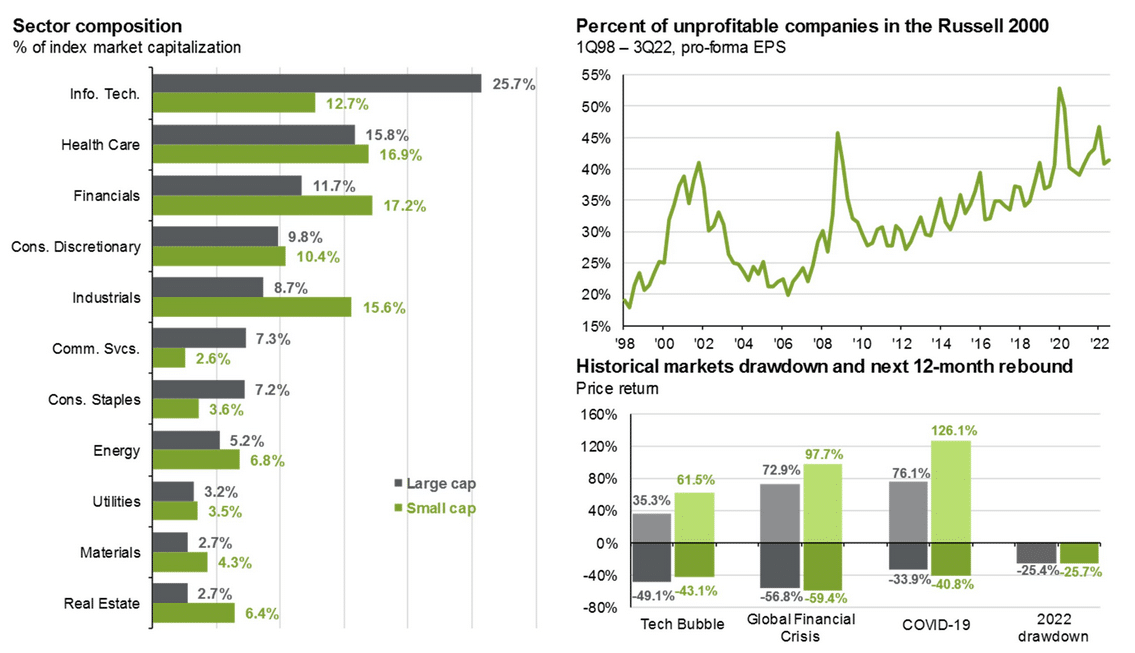
Many passive investors, such as those in retirement plans, use the start of a new year to reconsider their passive investment and reallocate accordingly. Often one of the decisions is how to split their stock allocations between large-cap and small-cap stocks. For those choosing between large-cap and small-cap stocks, we present a few graphs below to help.
The graph on the left shows large-cap stock indexes have twice the exposure to the tech sector than small-cap indexes. As a result, small-cap indexes tend to have more exposure to less volatile stocks. If you are bearish about the year ahead, this is a factor that might lead you toward small-cap stocks. However, the graph on the top right should give you some concern. It shows that over 40% of small-cap stocks are unprofitable. In our opinion, the takeaway is to be selective. If you want exposure to small-cap stocks, it’s worth looking at value-orientated funds. Lastly, the bottom right graph highlights large cap vs. small cap during the last four significant market drawdowns and their rebounds. In general, small-cap stocks tend to have more robust rebounds, yet the drawdowns are on par with large-cap indexes.
Every market cycle is different, but hopefully, this provides a little guidance for those making their 401k allocations.
Click Here To Read The Latest Daily Market Commentary (Subscribe For Pre-Market Email)
Bull Bear Report Market Statistics & Screens

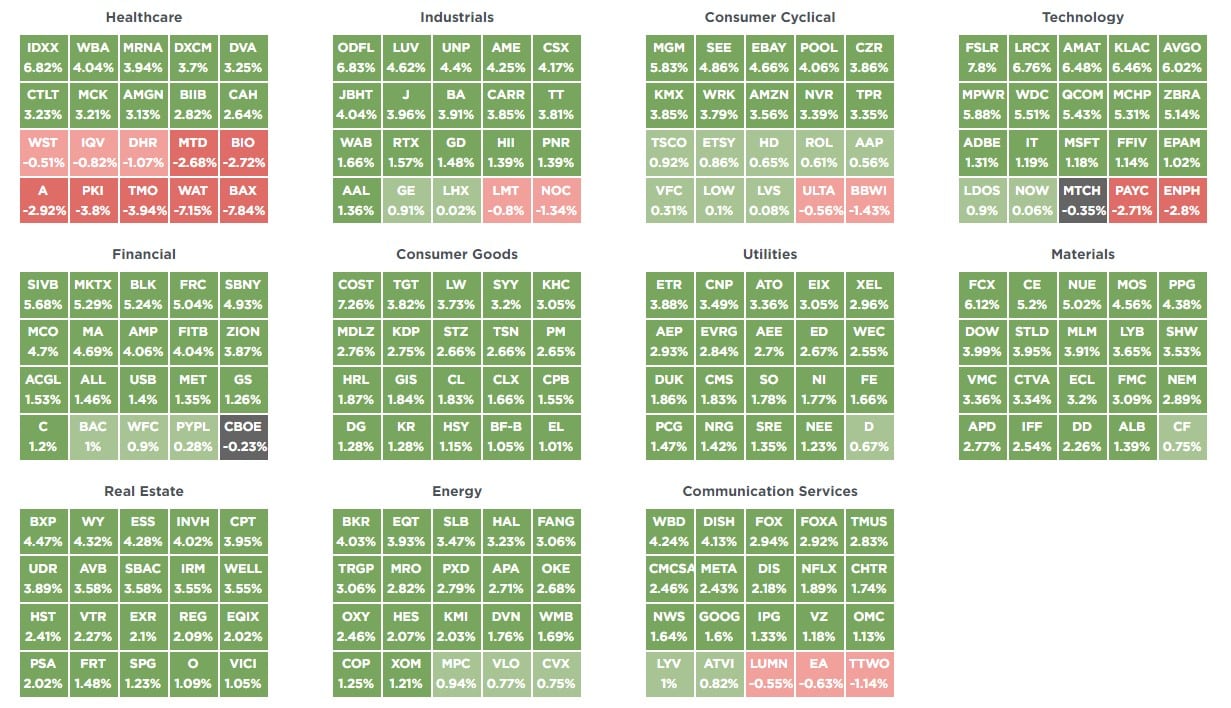
SimpleVisor Top & Bottom Performers By Sector
S&P 500 Tear Sheet
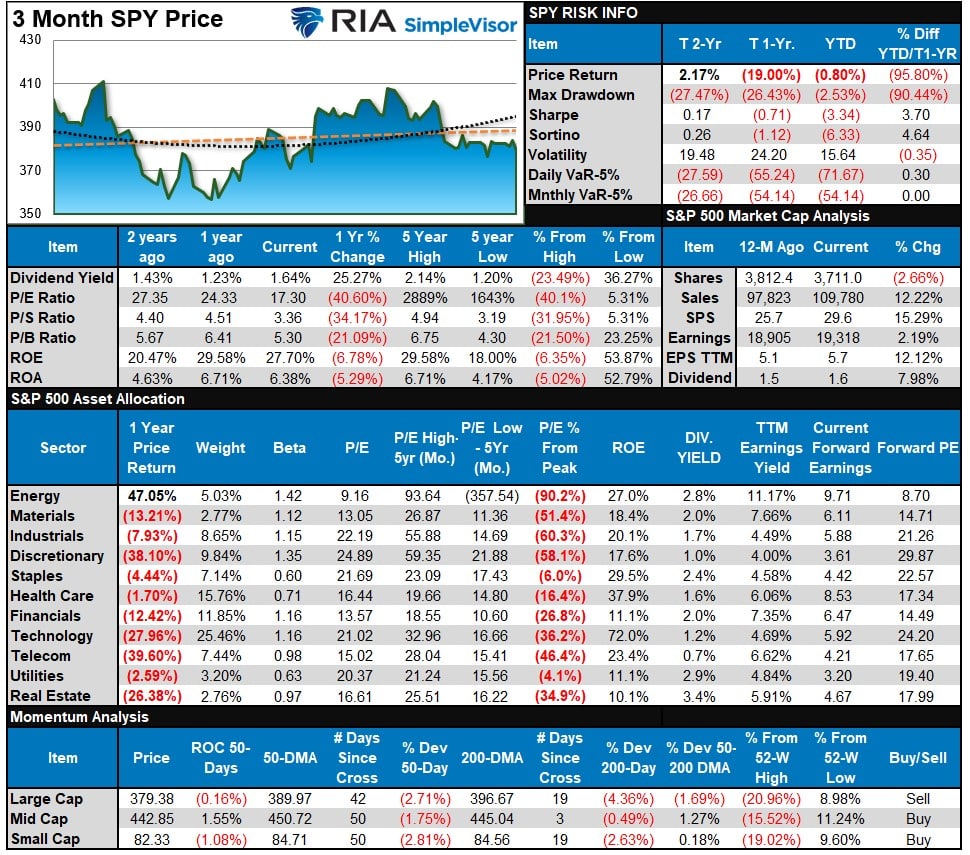
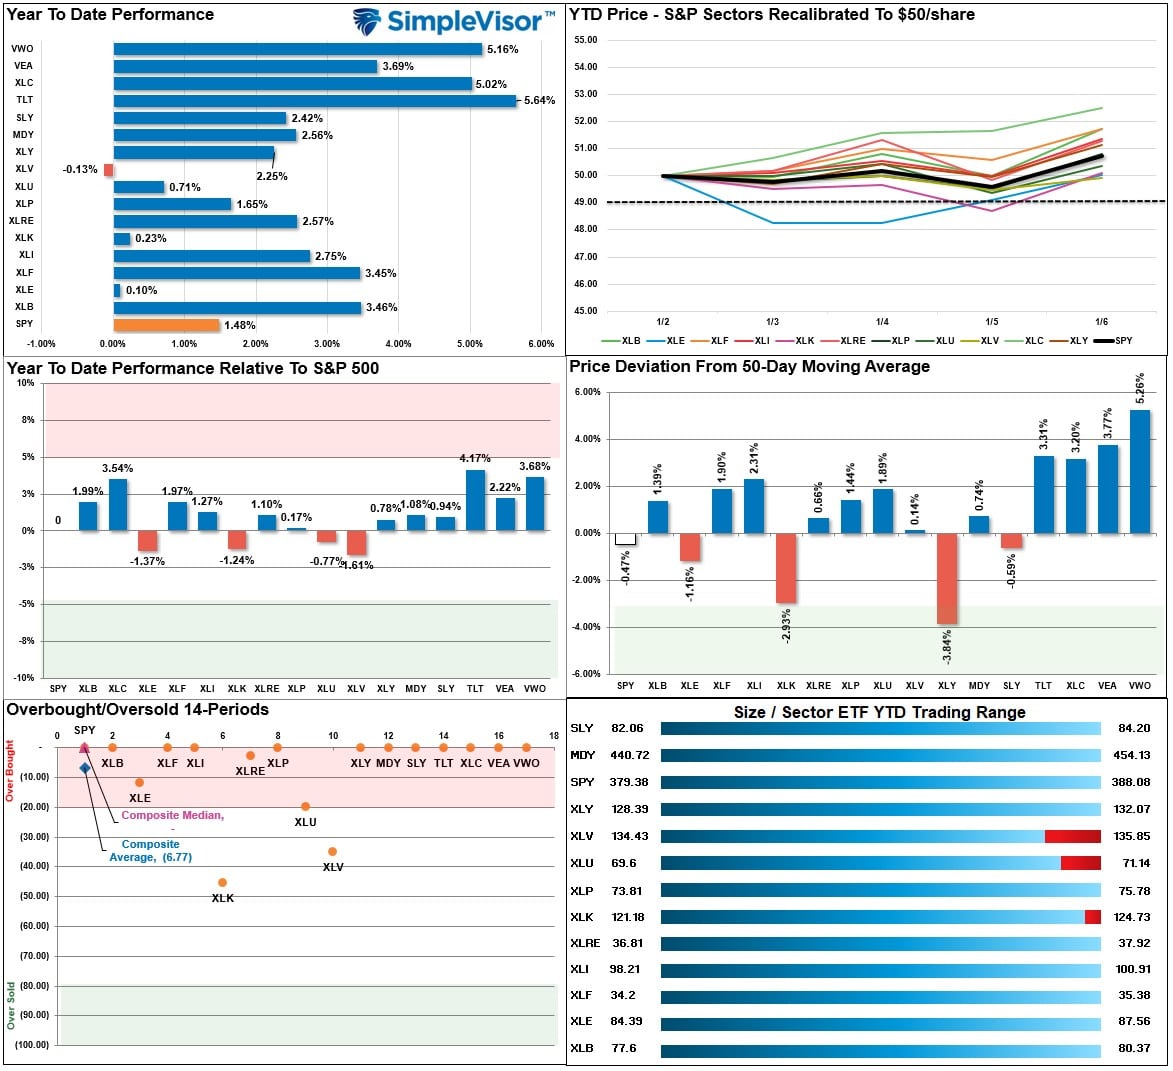
Relative Performance Analysis
The rally started a bit sluggish but finished the week strongly. However, I wouldn’t take too much for granted, as most of this past week was portfolio positioning for the New Year. Bonds, Communications, and International and Emerging markets were the big winners and strongly outpaced the S&P 500. However, this is the annual hope that THIS year will be the year that international stocks outperform the U.S. Such has been a poor bet over the last decade, and IF the U.S. slips into recession, international and emerging markets will underperform. Most everything is highly overbought, so a bit of a reversal next week will not be surprising.
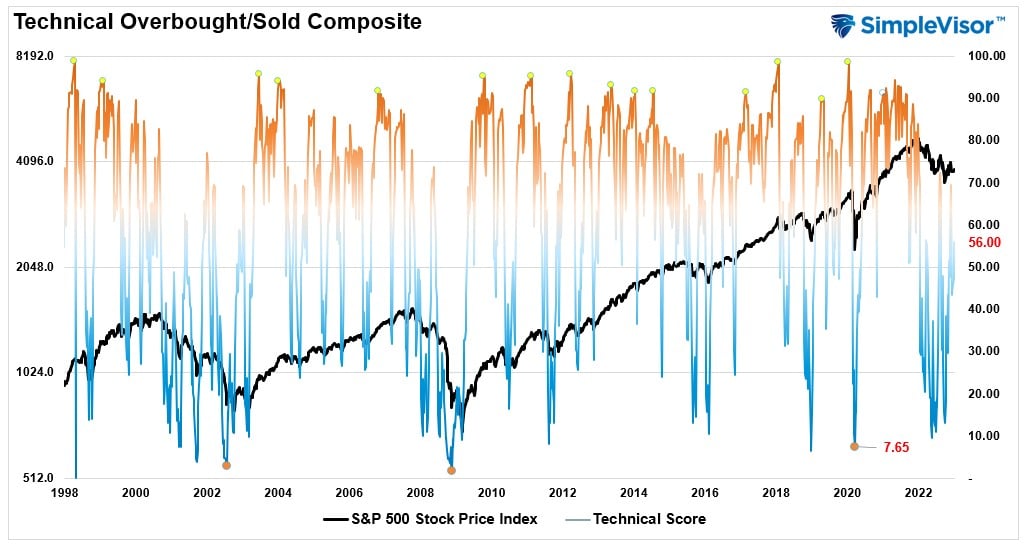
Technical Composite
The technical overbought/sold gauge comprises several price indicators (RSI, Williams %R, etc.), measured using “weekly” closing price data. Readings above “80” are considered overbought, and below “20” are oversold. Markets tend to peak when those readings are at 80 or above, which suggests profit-taking and risk management are prudent. The best buying opportunities exist when those readings are 20 or below.
The current reading is 56.00 out of a possible 100 and rising. Remain long equities for now.
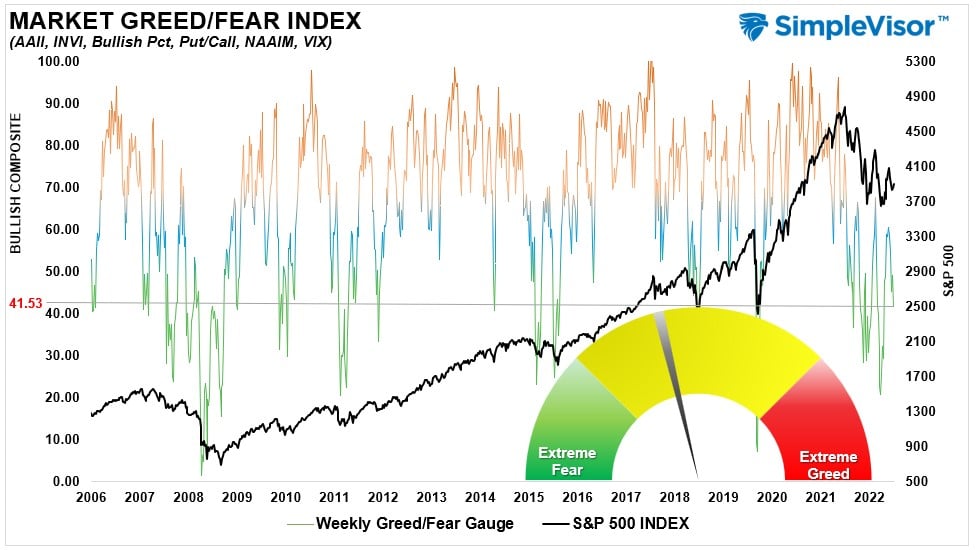
Portfolio Positioning “Fear / Greed” Gauge
The “Fear/Greed” Gauge is how individual and professional investors are “positioning” themselves in the market based on their equity exposure. From a contrarian position, the higher the allocation to equities, the more likely the market is closer to a correction than not. The gauge uses weekly closing data.
NOTE: The Fear/Greed Index measures risk from 0 to 100. It is a rarity that it reaches levels above 90. The current reading is 41.53 out of a possible 100.
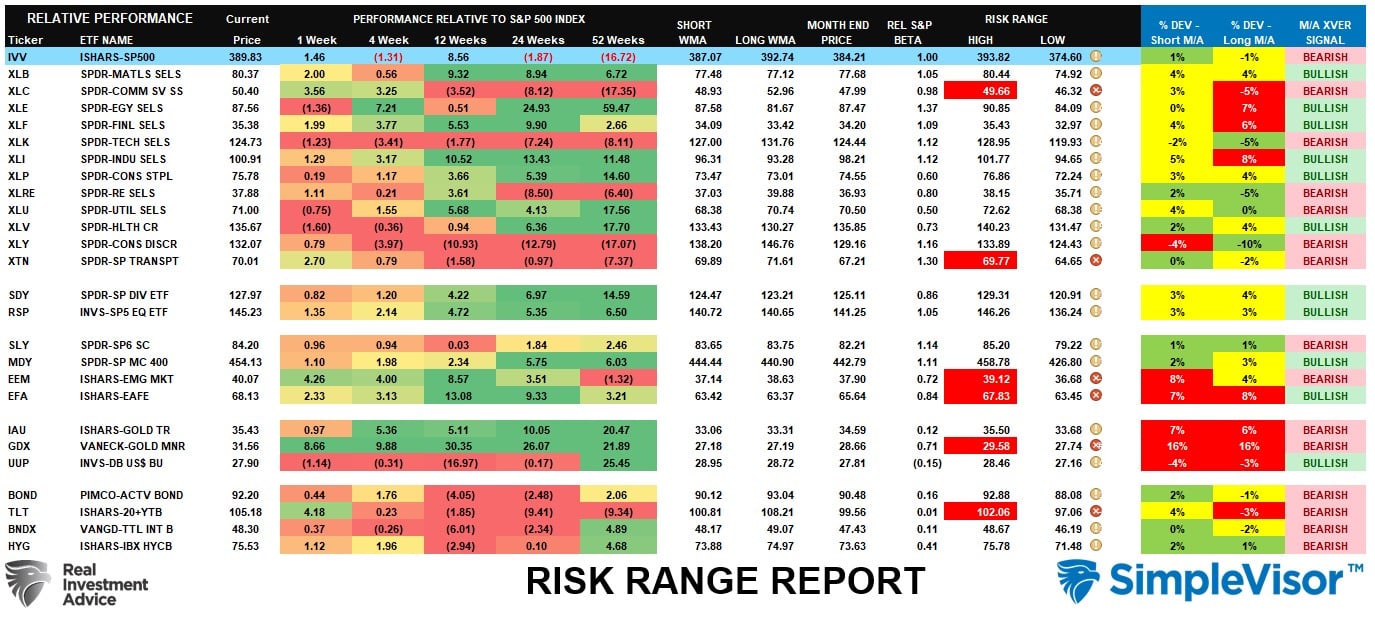
Sector Model Analysis & Risk Ranges
How To Read This Table
- The table compares the relative performance of each sector and market to the S&P 500 index.
- “M” XVER” “Moving Average Cross Over) is determined by the short-term weekly moving average crossing positively or negatively with the long-term weekly moving average.
- The risk range is a function of the month-end closing price and the “beta” of the sector or market. (Ranges reset on the 1st of each month)
- The table shows the price deviation above and below the weekly moving averages.
The market kicked off the New Year with a rally, and the “first 5 days” suggest the bulls are in charge for now. The big winners of Communications, Transportation, Emerging and International markets, Gold Miners, and Treasuries are now extremely overbought. I would not be surprised to see a bit of a reversal in the next few trading sessions, as much of this was likely initial portfolio dressing for the New Year.
Weekly SimpleVisor Stock Screens
Each week we will provide three different stock screens generated from SimpleVisor: (RIAPro.net subscribers use your current credentials to log in.)
This week we are scanning for the Top 20:
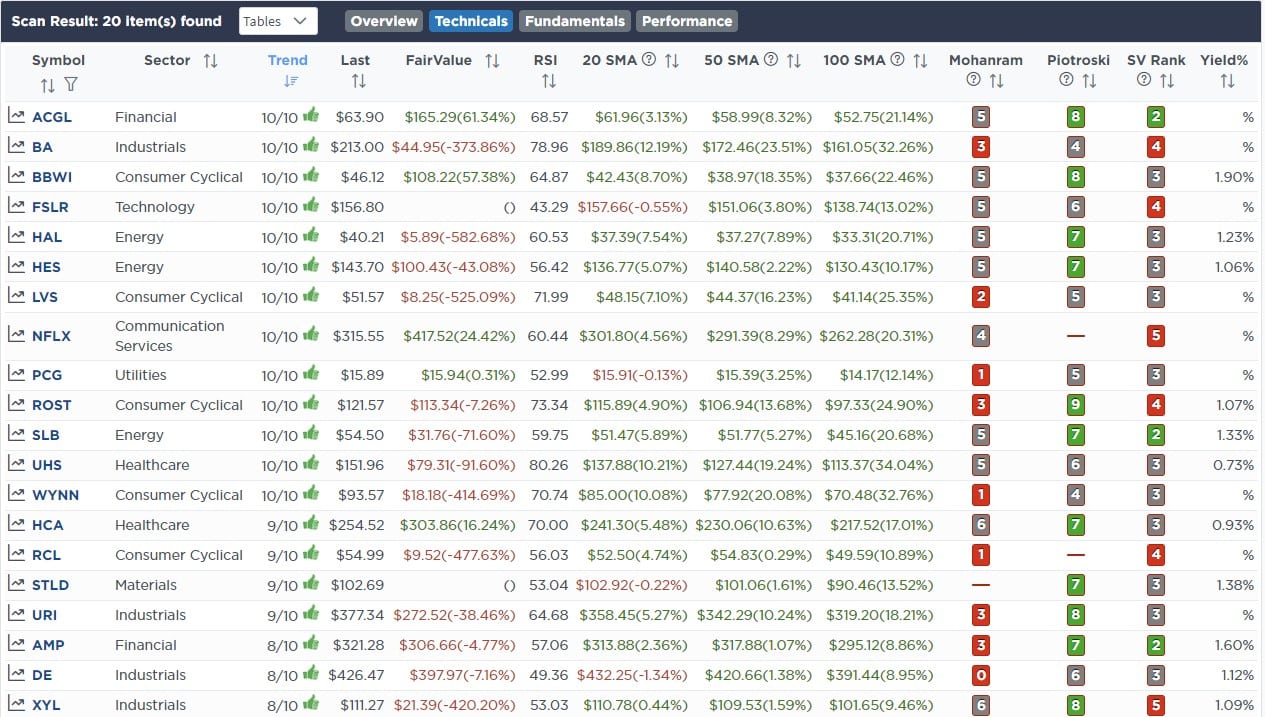
- Relative Strength Stocks
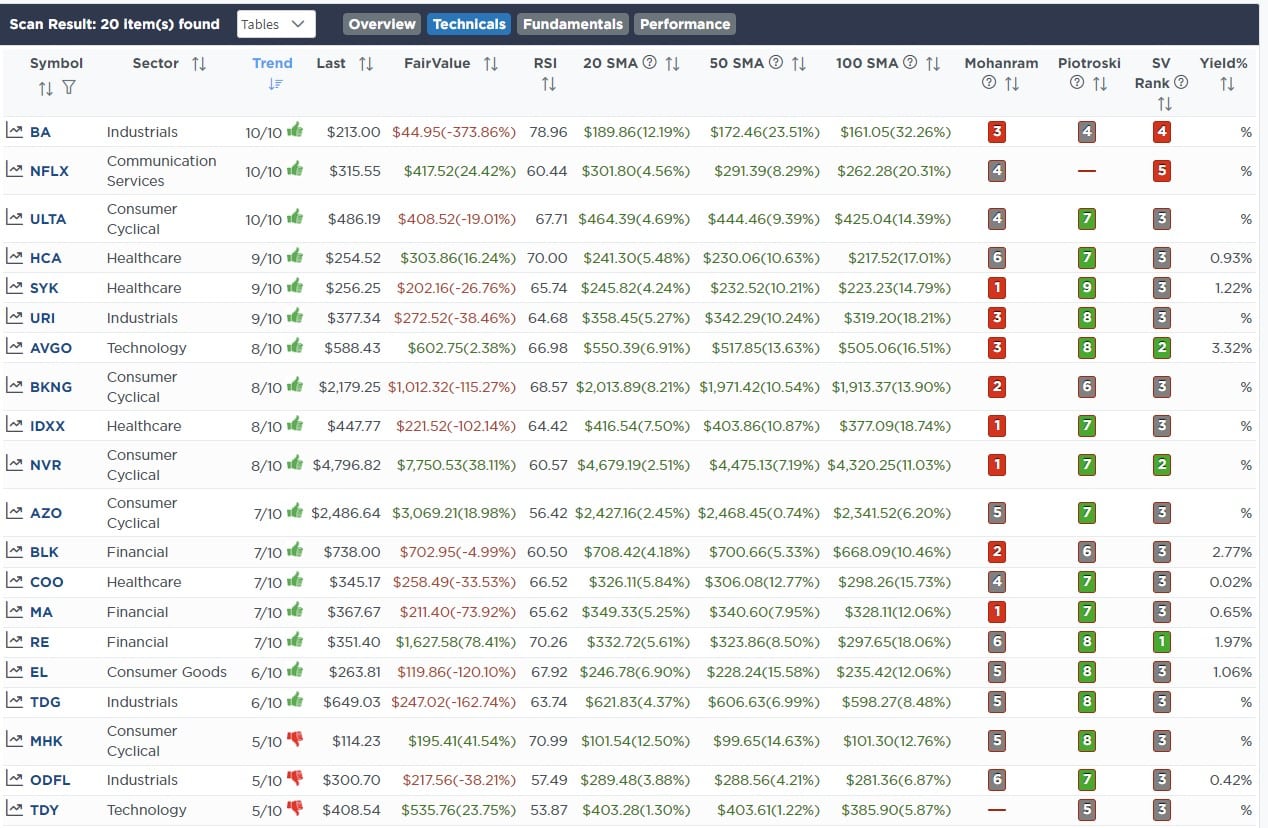
- Momentum Stocks
- Highest Rated Stocks With Dividends
These screens generate portfolio ideas and serve as the starting point for further research.
(Click Images To Enlarge)
RSI Screen
Momentum Screen
Highest Rated Stocks With Dividends

SimpleVisor Portfolio Changes
We post all of our portfolio changes as they occur at SimpleVisor:
We made no trades in the portfolios this past week.
The equity model is now at 35% equity exposure, and the ETF model is at 40.5%.

Lance Roberts, CIO
Have a great week!

