Bear Market Phases Are Like “The Revenant”


In this 03-11-22 issue of “Bear Market Phases Are Like ‘The Revenant.'”
- Market Review & Update
- Why Bear Market Phases Are Like “The Revenant”
- Portfolio Positioning
- Sector & Market Analysis
Follow Us On: Twitter, Facebook, Linked-In, Sound Cloud, Seeking Alpha
Need Help With Your Investing Strategy?
Are you looking for complete financial, insurance, and estate planning? Need a risk-managed portfolio management strategy to grow and protect your savings? Whatever your needs are, we are here to help.
Schedule your “FREE” portfolio review today.

Market Recap & Update With Adam Taggart
Market Review – Stocks Break Support
As has been the case all year, market volatility remained constant this past week. Stocks surged early in the week on hopes of talks between Russia and Ukraine, but hopes faded into Friday. Notably, the S&P 500 index broke the main support level of the January and September lows.
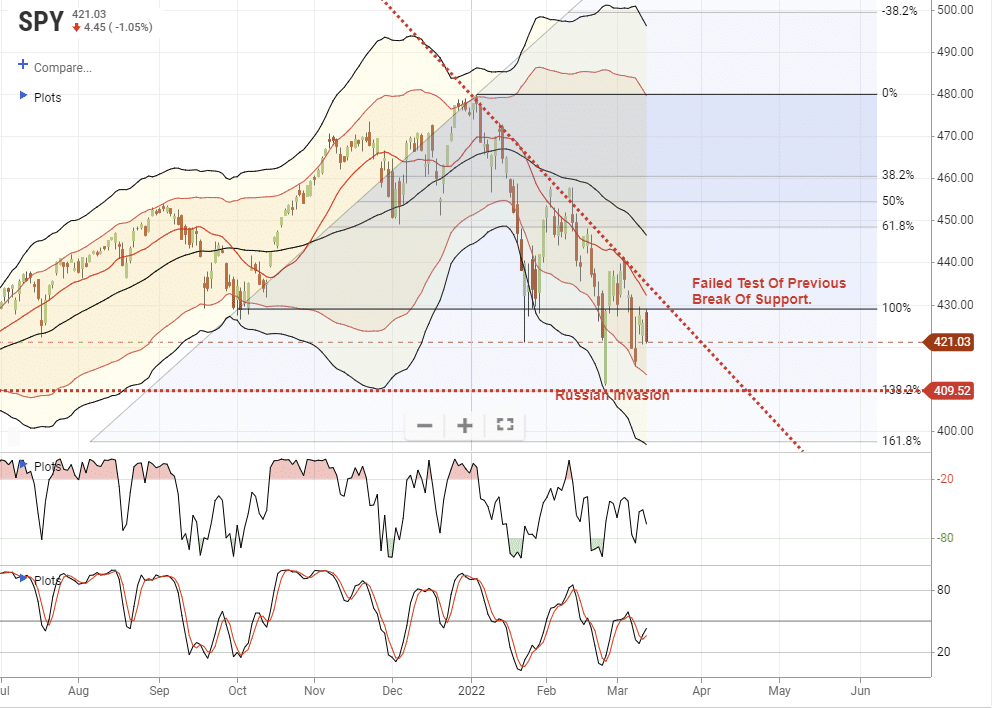
That break sets the market up for a retest of the lows set when Russia initially invaded Ukraine. A failure to hold that low and we are looking at a 161.8% Fibonacci retracement from the all-time highs, which would be roughly 4000 on the S&P index.
As we will discuss momentarily, there is a high probability of an outsized reflexive rally over the next two months due to several factors.
- Extreme negative sentiment
- Bearish portfolio positioning
- Higher levels of cash holdings by fund managers
- Dumb money is bearish
- Put/Call ratios are offsides
- Number of stocks trading at 52-week lows.
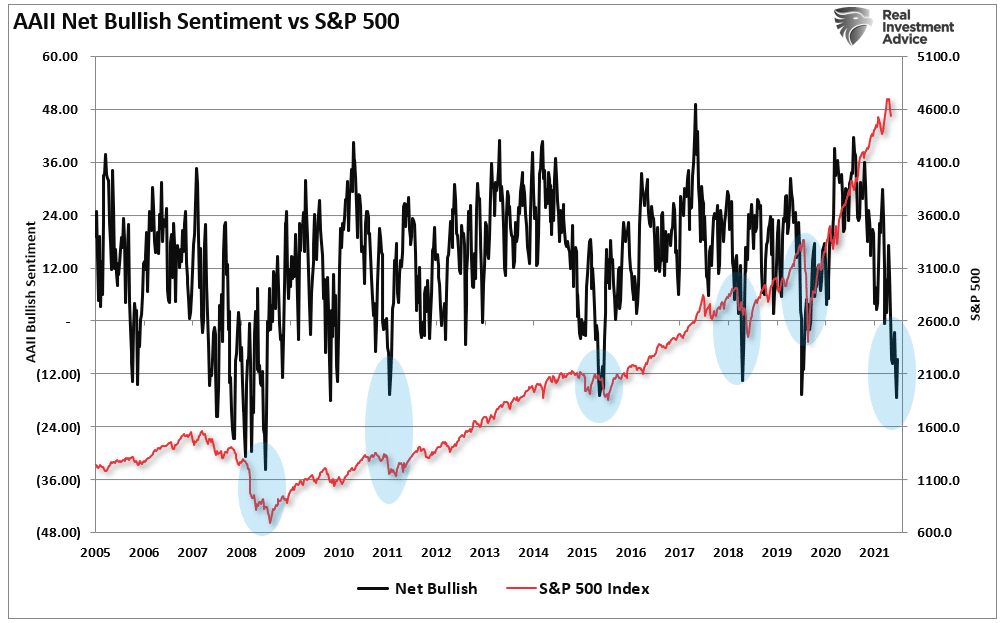
As shown, individual net bullish sentiment is at levels usually seen near market bottoms.
While we expect a significant rally from current levels, likely following the Fed’s meeting next week, such should get used to reduce risk and rebalance exposures accordingly. The market is currently very off-sides regarding money chasing the “inflation trade” and dumping everything else. Historically, such a “one-sided” trade sets up a rather severe rotation in the other direction.
As discussed below, we continue to reduce our exposures to consumer-related risk, are holding excess cash levels, and looking for opportunities to rebalance allocations at better levels.
There is a rising risk of a recession, and if this is the first leg of a bear market phase, we should expect a rally.
Before we go there, did you miss the most significant jump of the year?
Did You Miss The Biggest Jump Of The Year?
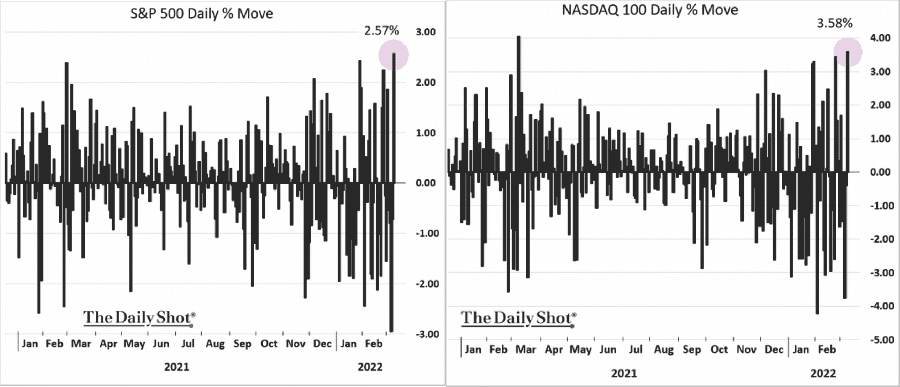
On Wednesday, the Nasdaq and the S&P 500 had the largest one-day jump since March 2020.
Despite the “best trading day” of the year, markets continue to remain weak so far. Such brings up one of the biggest investing myths.
“Panic selling not only locks in losses, but also puts investors at risk for missing the market’s best days.
Looking at data going back to 1930, Bank of America found that if an investor missed the S&P 500′s 10 best days in each decade, total returns would be just 91%, significantly below the 14,962% return for investors who held steady through the downturns.” – Pippa Stevens via CNBC
But here was her crucial point.
“The firm noted this eye-popping stat while urging investors to ‘avoid panic selling,’ pointing out that the ‘best days generally follow the worst days for stocks.’”
Think about that for a moment.
“The best days generally follow the worst days.“
The statement is correct, as the S&P 500’s most significant percentage gain days tend to occur in clusters during the worst of times for investors.

While Pippa is correct about missing the 10-best days of the market, avoiding the 10-worst days leads to remarkably better outcomes.
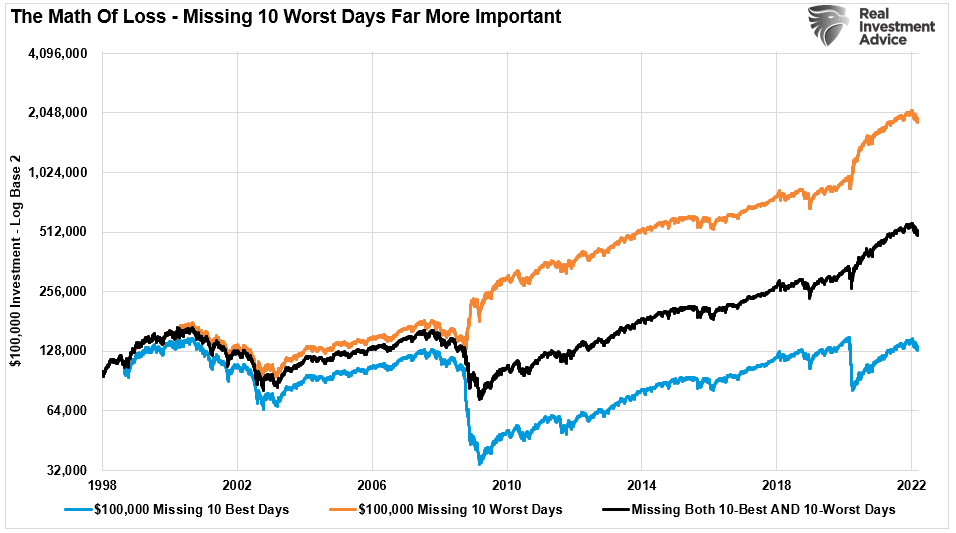
How important is this? Over an investing period of about 40 years, just missing the 10-best days would have cost you about 50% of your capital gains. But successfully avoiding the 10-worst days would have led to 2.5x the gains over “buy and hold.”
Notably, if you review the chart of daily price changes above, you will see that the 10-best days occur during the worst periods of the financial markets.
In other words, the 10-best days of the market are often best used for reducing portfolio risk.
This Week’s MacroView

Why Bear Market Phases Are Like “The Revenant”
If you haven’t seen the movie “The Revenant” with Leonardo DiCaprio, it is a 2015 American survival drama describing frontiersman Hugh Glass’s experiences in 1823. Hugh, an expert hunter and tracker is mauled by a grizzly bear in the film. (Warning: the scene is very graphic)
In the scene, the attack comes in three distinct waves.
- The bear attacks, and brutally mauls Hugh, who plays dead to survive. The attack subsides.
- The bear comes back, and Hugh shoots it, provoking the bear to maul him some more.
- Finally, Hugh pulls out his knife as the bear attacks for a final fight to the death. (Hugh wins if you don’t want to watch the video.)
Interestingly, this is also how “bear market phases” work.
Bob Farrell, a legendary investor, is famous for his 10-Investment Rules to follow.
Rule #8 states:
Bear markets have three phases – sharp down, reflexive rebound and a drawn-out fundamental downtrend
- Bear markets often START with a sharp and swift decline.
- After this decline, there is an oversold bounce that retraces a portion of that decline.
- The longer-term decline then continues, at a slower and more grinding pace, as the fundamentals deteriorate.
Dow Theory also suggests that bear market phases consist of three down legs with reflexive rebounds in between.
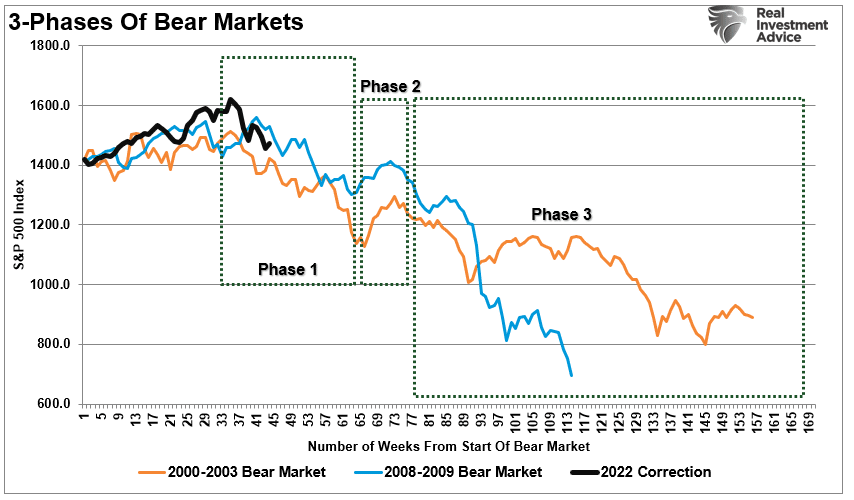
The chart above shows the last two primary cyclical bear market phases versus today (I adjusted the 2022 scale to match.)
As would be expected, the “Phase 1” selloff was not pleasant.
The Reflexive Bounce Is Coming?
That selloff sets up a “reflexive bounce.”
On Wednesday, I discussed the chart below in a Fox Business interview with Charles Payne.
The question is simple. What is the difference between a 10% decline in a bull market versus one that leads to a bear market?
As shown, it all depends on whether you are entering into a recession or not.
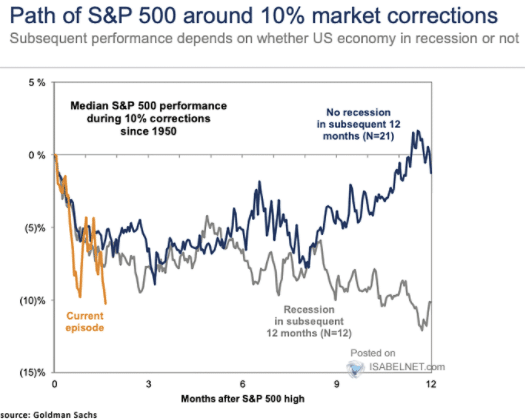
The risk of a “bear market” is rising. Inflation was surging before the surge in oil prices. Now those higher prices are impacting consumption as liquidity support is reversing. The massive infusions of fiscal liquidity in 2020 and 2021 are gone. The Fed’s QE program ended on Wednesday, which is extracting more liquidity from the markets. And next week, the Fed will hike interest rates, further tightening monetary policy.
However, monetary policy is already much tighter due to the inflationary build. When the Fed hikes rates, it will likely slow the economy much faster than most expect.
While a reasonably significant “reflexive rally” is likely, given investors’ more extreme negative sentiment and positioning, a recession will likely lead to substantially lower prices. Such will occur as investors reprice overvalued assets for slowing future earnings.
Bear market rallies are dangerous. Investors will “feel like” they are “safe” as the media proclaims the “correction” is over. However, that is precisely what “bear market rallies” do. They lure investors back into the markets just before they get mauled again in “Phase 3.”
Just like in 2000 and 2008, the media/Wall Street will be telling you to “hold on.” Unfortunately, by the time “Phase 3” got finished, no one wanted to “buy” anything.
I suspect when we find the actual market bottom, it will be much the same.

Portfolio Update
The main point of this week’s discussion is keeping perspective on the market and your portfolio. The continuous pressure on the market over the last couple of months is wearing investors’ patience very thin. Such is the time that we begin to make emotionally-driven mistakes that lead to poor future outcomes.
As stated, there is an increasingly high probability that any good news will spark a fairly substantial counter-trend rally that could last for a few days to a couple of weeks. That rally should get used to rebalance portfolio exposures and reduce risks.
Such is what we have continued to do this past week by reducing consumer-centric exposures in the portfolio, which will likely get hurt by slower economic growth. With target portfolio exposures down, and cash holdings up, we can weather volatility while looking for investible opportunities.
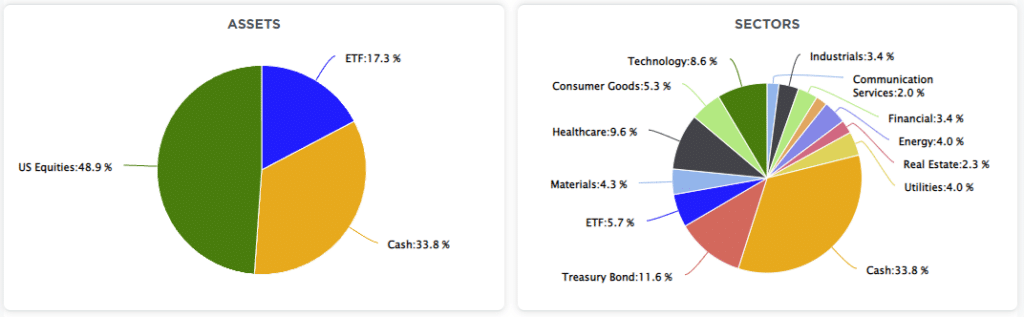
Since January, we have been regularly discussing taking profits in positions, rebalancing portfolio risks, and, most recently, moving out of areas subject to slower economic growth.
There is some truth “that no one” could see the Russian invasion of Ukraine. However, such is why we previously stated that “all bear markets are a function of an unexpected, exogenous event, that changes investor perceptions.”
Investors are now evaluating the impact of higher inflation on earnings and profits margins against a backdrop of excessive valuations. That is a risk we warned you of.
However, it is managing these types of risks that clients ultimately pay their advisors for.
If this is “Phase 1” of a bear market, you don’t want to be around for the “final mauling.”
Market & Sector Analysis
S&P 500 Tear Sheet
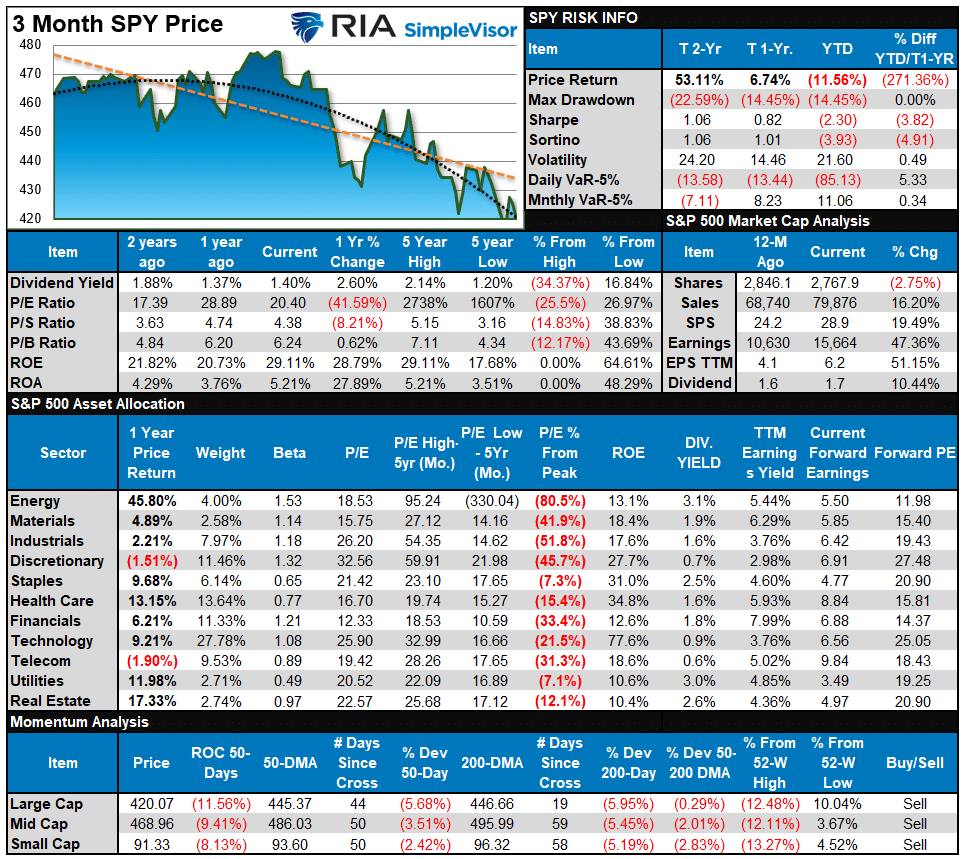
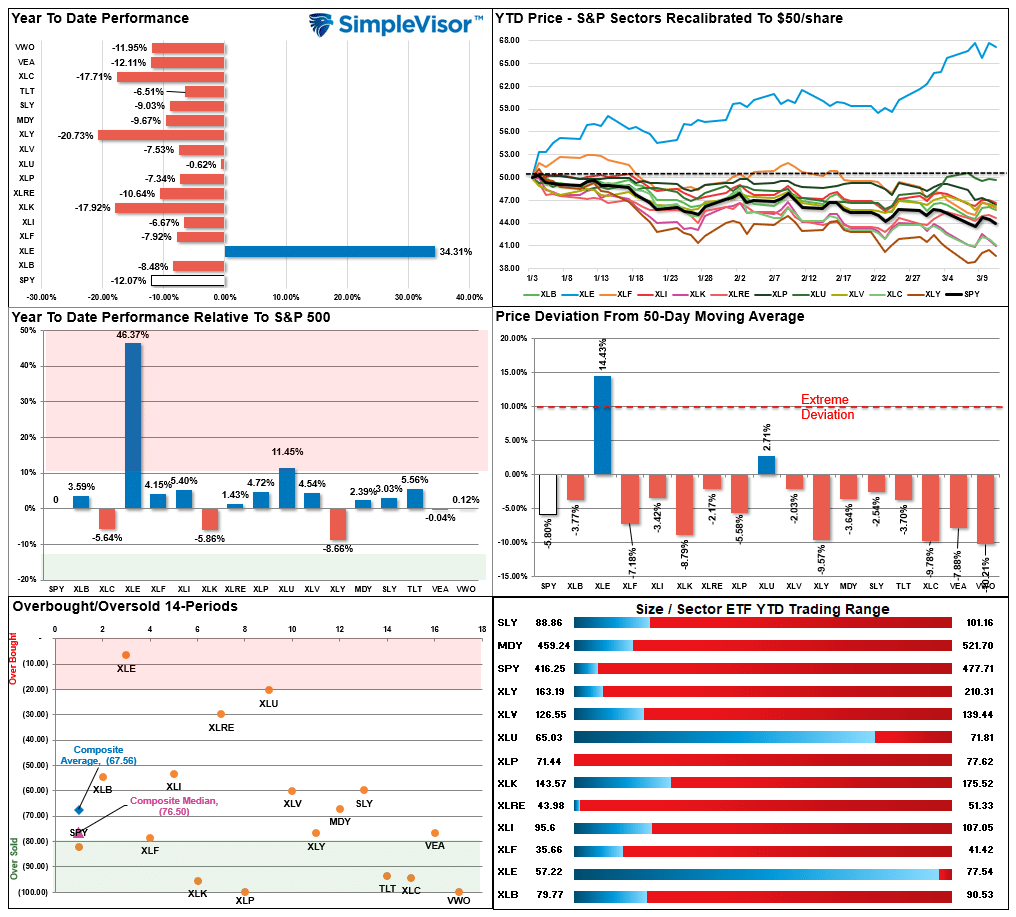
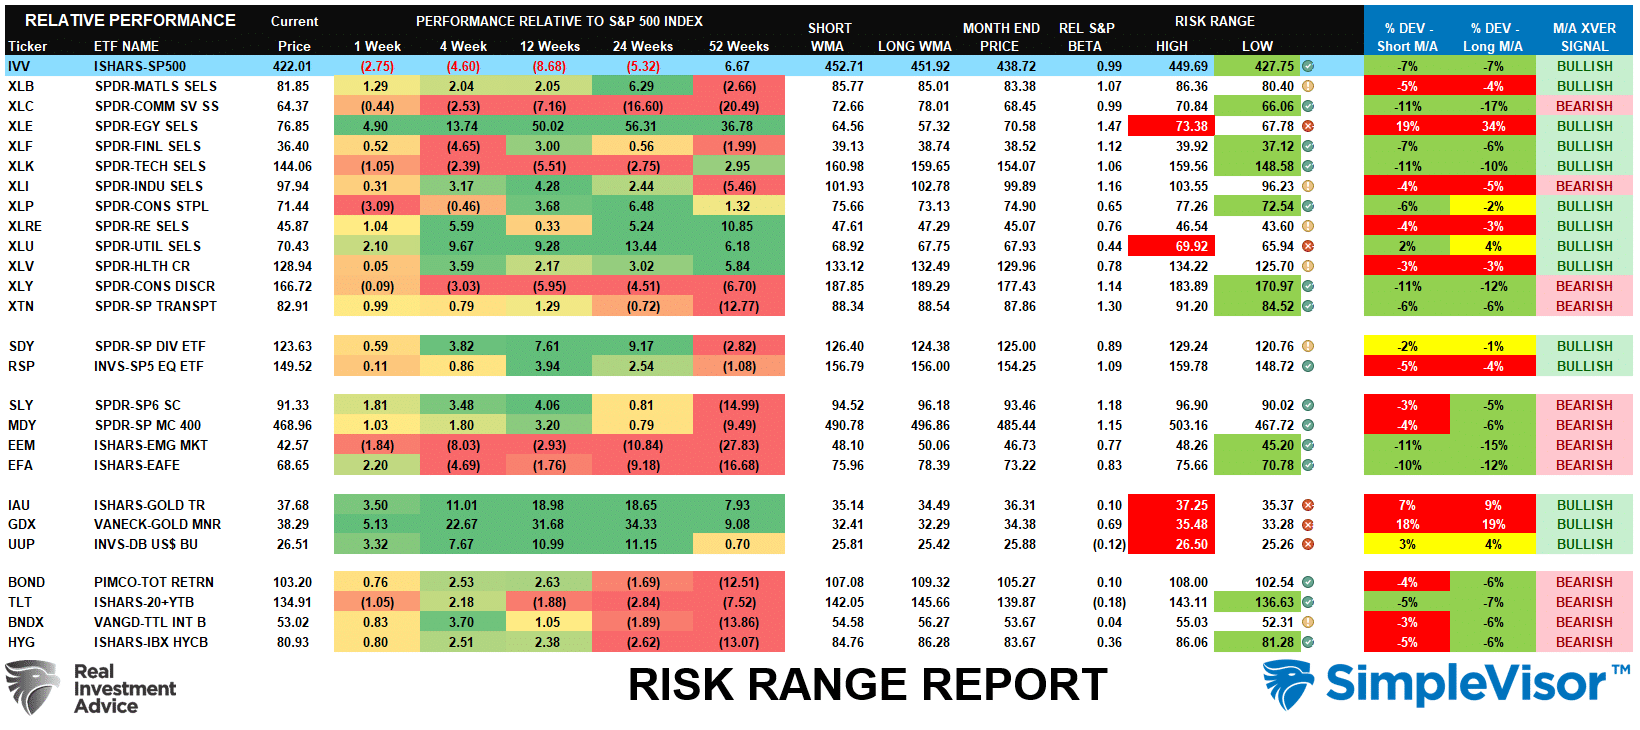
Relative Performance Analysis
Technical Composite
The technical overbought/sold gauge comprises several price indicators (RSI, Williams %R, etc.), measured using “weekly” closing price data. Readings above “80” are considered overbought, and below “20” are oversold. The current reading is 20.34 out of a possible 100.

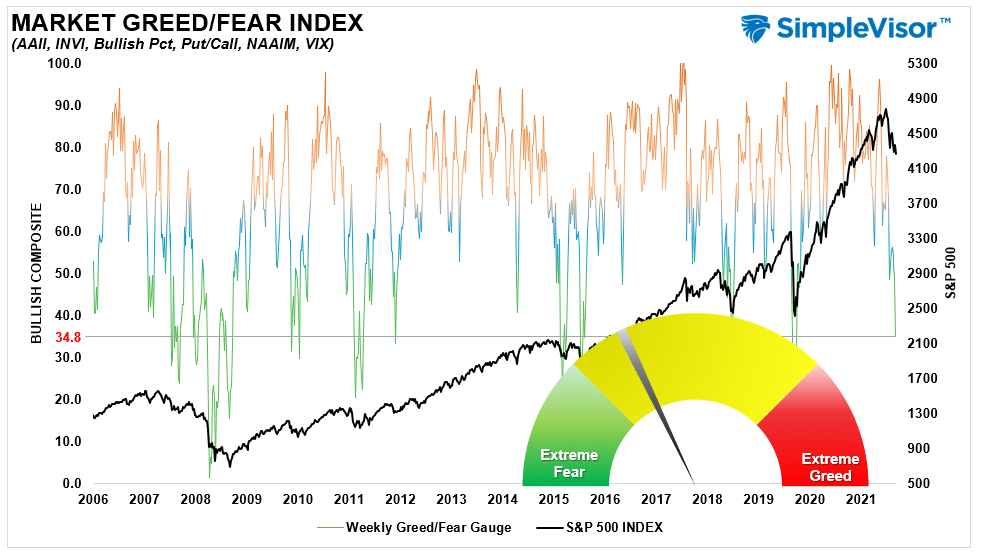
Portfolio Positioning “Fear / Greed” Gauge
Our “Fear/Greed” gauge is how individual and professional investors are “positioning” themselves in the market based on their equity exposure. From a contrarian position, the higher the allocation to equities, to more likely the market is closer to a correction than not. The gauge uses weekly closing data.
NOTE: The Fear/Greed Index measures risk from 0-100. It is a rarity that it reaches levels above 90. The current reading is 34.8 out of a possible 100.
Sector Model Analysis & Risk Ranges
How To Read This Table
- The table compares each sector and market to the S&P 500 index on relative performance.
- “MA XVER” is determined by whether the short-term weekly moving average crosses positively or negatively with the long-term weekly moving average.
- The risk range is a function of the month-end closing price and the “beta” of the sector or market. (Ranges reset on the 1st of each month)
- Table shows the price deviation above and below the weekly moving averages.
- The complete history of all sentiment indicators is on under the Dashboard/Sentiment tab at SimpleVisor
Weekly Stock Screens
Each week we will provide three different stock screens generated from SimpleVisor: (RIAPro.net subscribers use your current credentials to log in.)
This week we are scanning for the Top 20:
- Relative Strength Stocks
- Momentum Stocks
- Technically Strong With Strong Fundamentals
These screens generate portfolio ideas and serve as the starting point for further research.
(Click Images To Enlarge)
RSI Screen

Momentum Screen
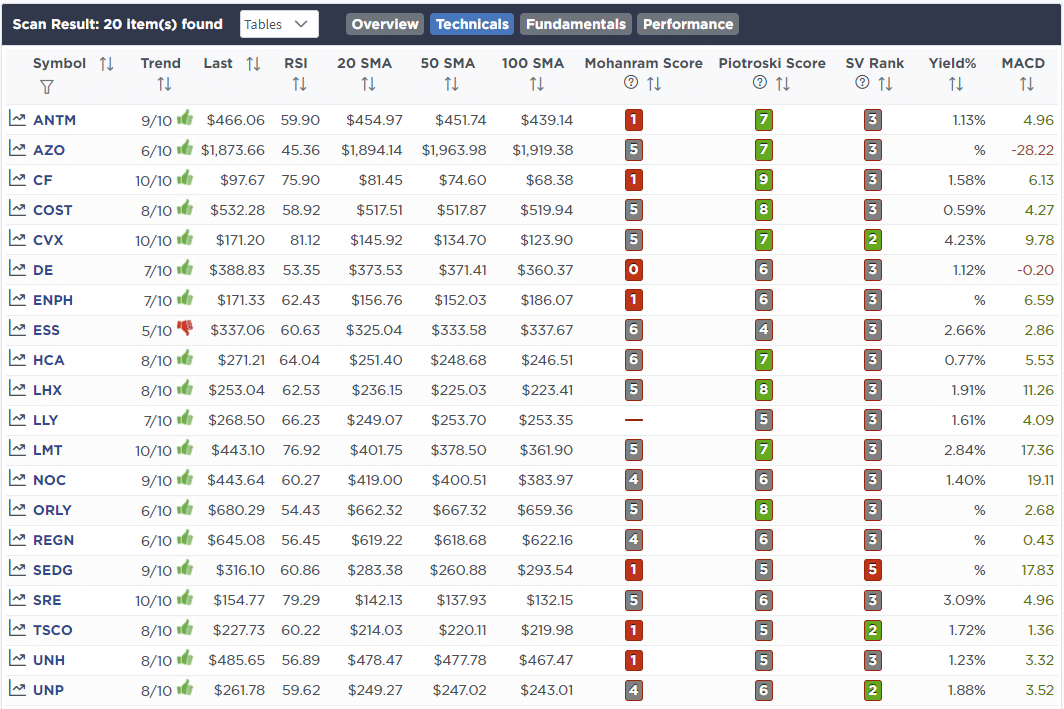
Technical & Fundamental Strength Screen

SimpleVisor Portfolio Changes
We post all of our portfolio changes as they occur at SimpleVisor:
March 8th
“This morning we sold the remaining ADBE (1%) in the equity model after it broke our final stop loss level. This reduces our technology exposure further but frees up capital to buy growth stocks at the right time. We also brought ALB back up to its model weight of 4%.
Lithium prices are soaring, but ALB is languishing with the market but unlike other metal miners/producers. There are reasons for this including slowing economic growth (possible recession) and old contracts in which they locked down lower lithium prices. That said its price is down over 30% and it is grossly oversold on all technical indicators. Over the last 10 years, its MACD has never been this oversold. Its forward P/E of 27, is not cheap, but well off recent highs and back in the pre-Covid range.”
- Sell 100% of Adobe (ADBE)
- Increase Albemarle (ALB) to 4% of the portfolio
March 10th
“Yesterday, Amazon (AMZN) announced a 20-for-1 stock split and a $10 billion stock buyback plan. That announcement sent the stock up roughly 5% this morning. We are using that pop to sell our AMZN stake entirely due to its exposure to retail sales in an inflationary environment with a weakening economy. Opportunistically, we will shift that stake into our other technology holdings over the next few days to add to our positions at lower levels.
We are reducing XLY in the ETF model given its major exposure is AMZN for the same reasons.”
Equity Model
- Sell 100% of Amazon (AMZN)
ETF Model
- Reduce SPDR Discretionary ETF (XLY) by 1% of the portfolio.

Lance Roberts, CIO
Have a great week!


