Overly Bullish Speculators Front-Run “Santa Claus” 12-18-20


In this issue of “Overly Bullish Speculators Front-Run ‘Santa Claus'”
- Here Comes “Santa Claus”
- Good Intentions
- Portfolio Positioning Update
- MacroView: The Energy Rally Is Likely Premature
- Sector & Market Analysis
- 401k Plan Manager
Follow Us On: Twitter, Facebook, Linked-In, Sound Cloud, Seeking Alpha
The 2020/21 Tax Guide Is Now Available
RIA Advisors has partnered with DoerenMayhew, CPA’s, to bring you, and our clients, the best tax planning services available. Click the link to download the free tax planning guide for 2020 and 2021.

Catch Up On What You Missed Last Week

Here Comes “Santa Claus”
Last week, we discussed the market approaching the 3750 year-end price target we had established back in August. To wit:
“That target was derived when I previously set out several ‘risk/reward ranges.’
‘With the markets closing just at all-time highs, we can only guess where the next market peak will be. Therefore, to gauge risk and reward ranges, we have set targets at 3500, 3750, and 4000.’
I have updated the chart below. The “black arrow” was where I initially did the analysis.”
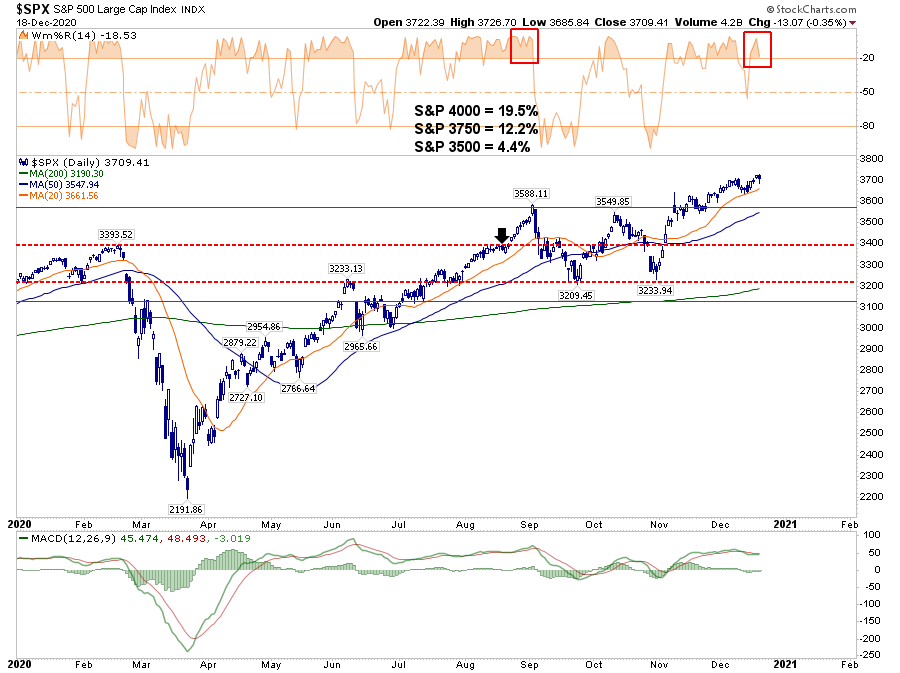
With the markets currently “knocking on the door,” we will likely reach that target by year-end. Such is particularly the case with the seasonal “Santa Claus” rally just ahead of us. As we discussed in “Will ‘Santa Claus’ Visit Broad & Wall:”
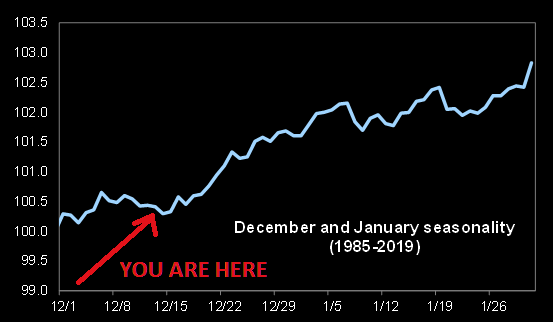
“Stock Trader’s Almanac explored why end-of-year trading has a directional tendency. The Santa Claus indicator is pretty simple. It looks at market performance over a seven day trading period – the last five trading days of the current trading year and the first two trading days of the New Year. The stats are compelling.
‘The stock market has risen 1.3% on average during the 7 trading days in question since both 1950 and 1969. Over the 7 trading days in question, stock prices have historically risen 76% of the time, which is far more than the average performance over a 7-day period.'”
Chasing The Sleigh
Given the high probability of higher prices by year-end as managers “window dress” portfolios for annual performance reports, we increased equity risk this past Tuesday. We reported the trade to our RIAPRO Subscribers (Free 30-day Trial) at the time of execution.
“Adding 5% of SPY to Equity and ETF portfolios for the end-of-year strength. As noted in both posts below, there is a 76% win ratio for the S&P between the 15th of December and the first week of January.
- Initiate a 5% position of SPY in portfolios”
As discussed last week, while there is a 76% chance the markets will be positive, there is a pesky 24% chance it won’t.
That Pesky 24%
As discussed in Thursday’s “3-minutes” video, the longer-term market dynamics are supportive of a rally into January,
https://www.youtube.com/watch?v=6IaHv7K02Js
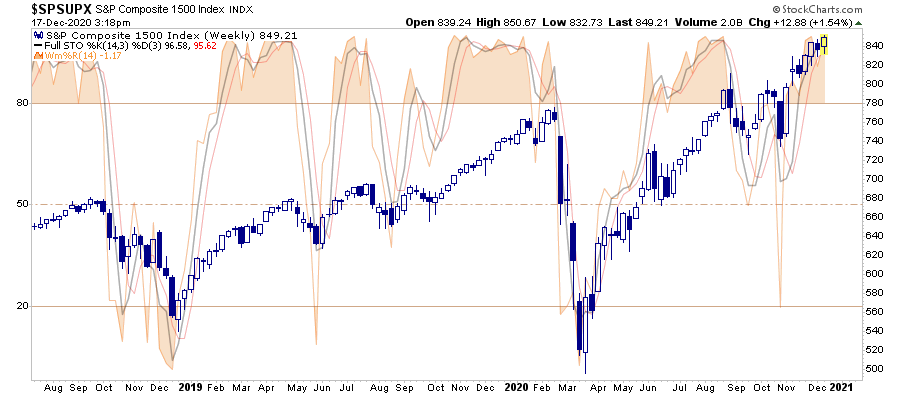
So, why are we concerned? We wouldn’t be if the markets had not already rallied to more extreme extensions. (The weekly chart of the S&P 1500 index is pushing more extreme overbought conditions now, but can certainly get more extreme.)
Furthermore, this monthly chart of the S&P 500 index shows more clearly just how stretched markets are getting.
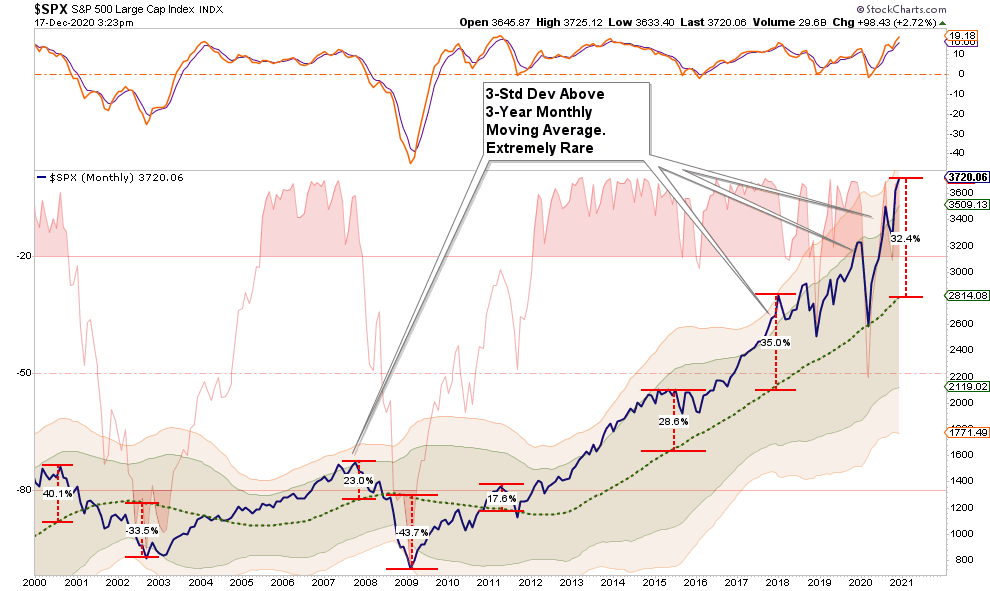
While none of this says the market will correct tomorrow, next week, or even next month, it does suggest investors have harvested the “low hanging” fruit.
So, while we have the “good intentions” to “ride Santa’s Sleigh” into the new year, we want to make sure you are aware the “Grinch could still steal Christmas.”

Good Intentions
An old proverb states, “The road to hell is paved with good intentions.”
US economics professor Danny Yagan, in “Riding the bubble? Chasing returns into illiquid assets,” discussed that retail investors might say one thing, but often do quite the opposite.
I hear this almost daily when talking with prospective clients. During initial discussions, they tell me how “conservative” they are in their portfolios. However, while they say they are conservative investors, their actual portfolio allocations and selected investments are usually anything but conservative.
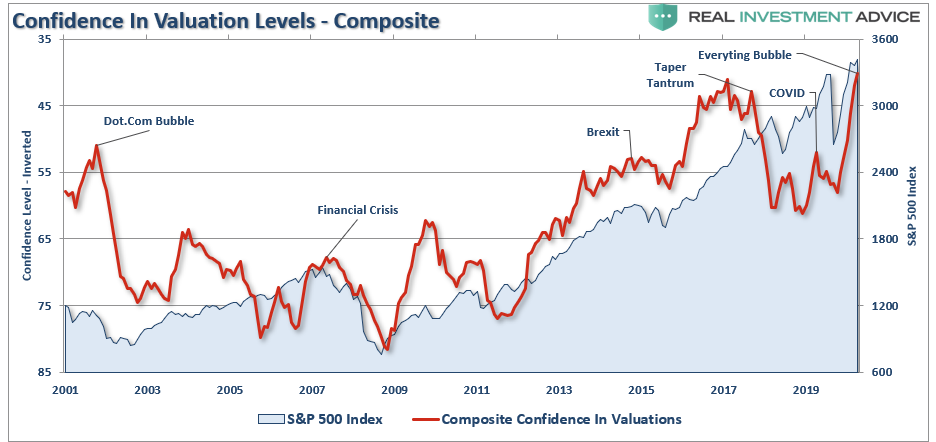
An excellent example of this dichotomy is the Yale Stock Market and Valuation Confidence Indexes. If you examine the data, you find that while investors are crazy bullish on the market over the next year, they aren’t attracted to its valuation. As shown in the chart below, a historically low share of investors thinks the market is cheap. Valuation Confidence, from both individual and institutional investors, is at the lowest levels on record. (Index is inverted)
Irrational Exuberance?
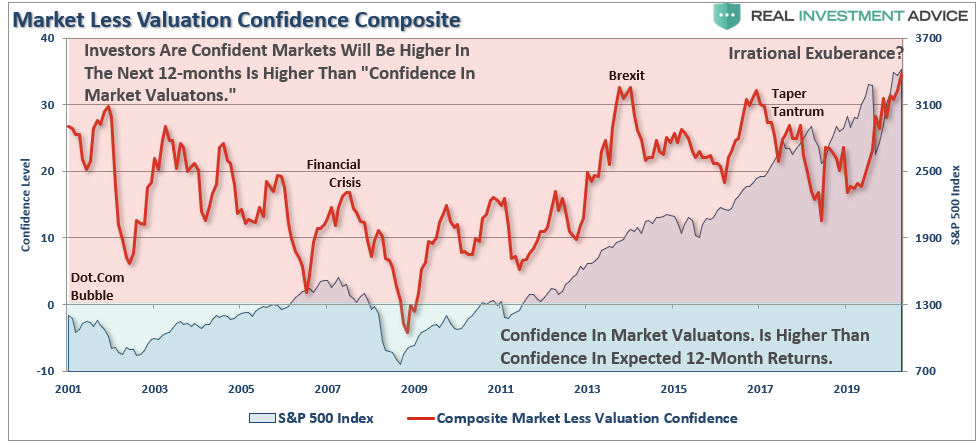
The chart below shows the combined average of institutional and individual investor valuation confidence subtracted from future returns confidence. When the reading is positive, the confidence the market will be higher one year from now is more elevated than the confidence in the market’s valuation. The opposite is the case when the reading is in negative territory.
The key takeaway is that investors think simultaneously, the market is over-valued but likely to keep climbing.
Such is the same phenomenon famously described by former Fed Chair Alan Greenspan in a December 1996 speech on “Irrational Exuberance.”
The explanation for this lies in the behavioral finance sin of “anchoring.”
As we wrote previously in “The Money Game,” there are nine psychological “traps,” investors fall into that ultimately derail their “good intentions.” “Anchoring” is where investors remain focused on what happened previously and do not adapt to a changing market.
As noted in the chart above, outcomes have often not been good.

Stuffing Stockings
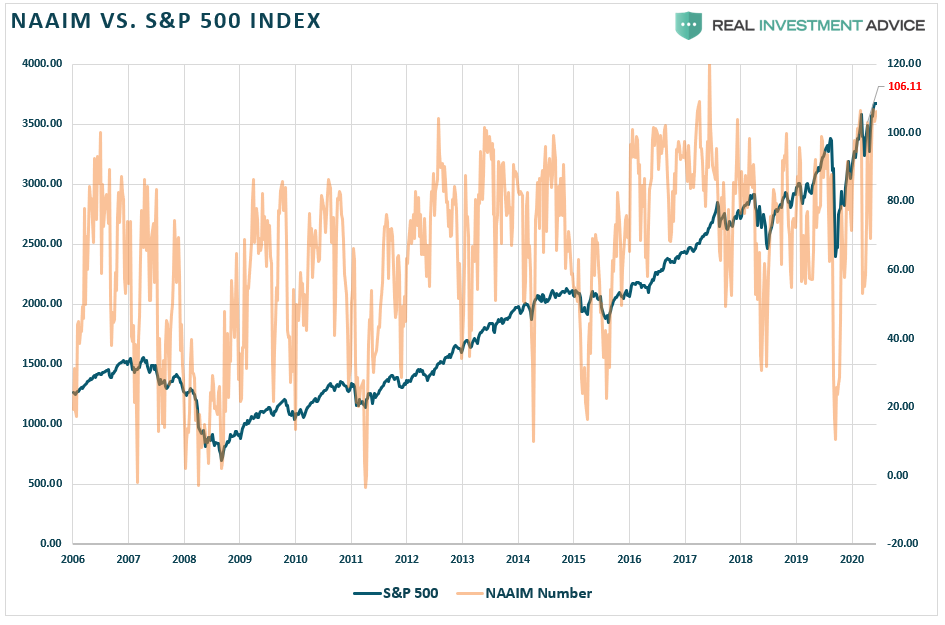
As noted in the chart above, it isn’t just “retail” investors getting overly exuberant about the market, but “institutional investors” are jumping in the pool with them. As I noted last week, portfolio managers are not only entirely long but have leveraged up portfolios to over 100% exposure to equities.
While investment managers are “all in,” Wall Street strategists are rushing to ramp up price targets on stocks to lure more retail investors into the market. The “Fear Of Missing Out” is a powerful force few retail investors can resist.
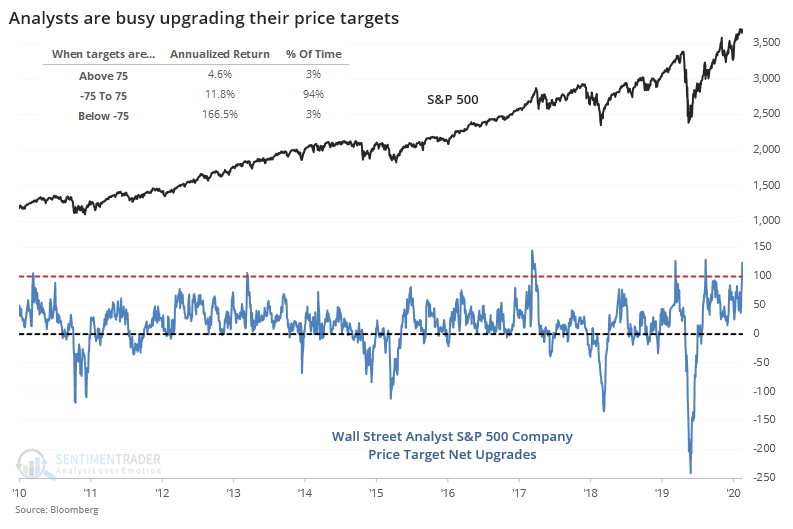
As noted by SentimenTrader:
“Analysts on Wall Street have been busy upgrading the price targets on their stocks, too. Strategists tend to work from the top down; analysts from the bottom up. From both directions, Wall Street is extremely optimistic.”
Might want to take a mental note of where peaks in the strategist’s price target upgrades align with the market.
Portfolio Positioning Update
The point here is simplistic.
While the market is entering into a seasonally strong time of year, the market is already very overbought based on past historical statistics. Such provides a risk level that would not exist had the markets not already had a decisive run from the October lows.
Does this mean you should “sell everything” and move to cash? Absolutely not.
As I stated at the outset, we have increased our portfolio allocations to equities and decreased our hedges to participate in the market. However, we are not turning a “blind eye” to the “risk” either.
Currently, there are a vast number of investors that are falling prey to the Dunning-Kruger effect. Such was a point Doug Kass made on Thursday:
“The Dunning-Kruger effect is a cognitive bias in which people with low ability at a task overestimate their ability. It is related to the cognitive bias of illusory superiority and comes from people’s inability to recognize their lack of ability. The Dunning-Kruger effect observes that people who are the most ignorant about something will be the least aware of their own ignorance; they have the highest sense of false confidence.”
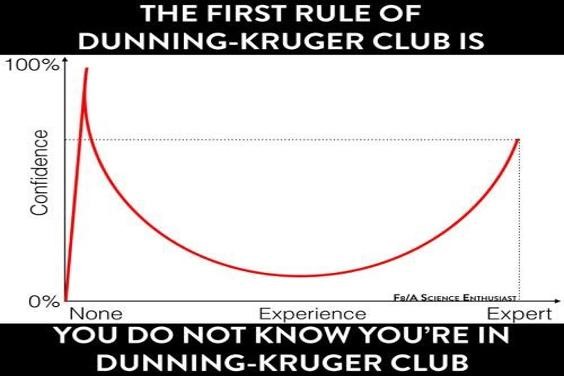
As noted, investors are overly confident.
What we do know is that “momentum” is a “tailwind” for investors currently. The hope for a “vaccine” allowing the economy to return to normal with another stimulus package is reason to be optimistic.
The actual outcomes will fall far short of overly optimistic projections, and the disappointment will lead to the eventual correction. But we will discuss that later.
For now, we will continue to trade momentum until our money-flow indicators turn negative again.
Besides, we have been “really good” this year, so we are hope “Santa Claus” doesn’t bring us a lump of coal.

The MacroView
If you need help or have questions, we are always glad to help. Just email me.
See You Next Week
By Lance Roberts, CIO
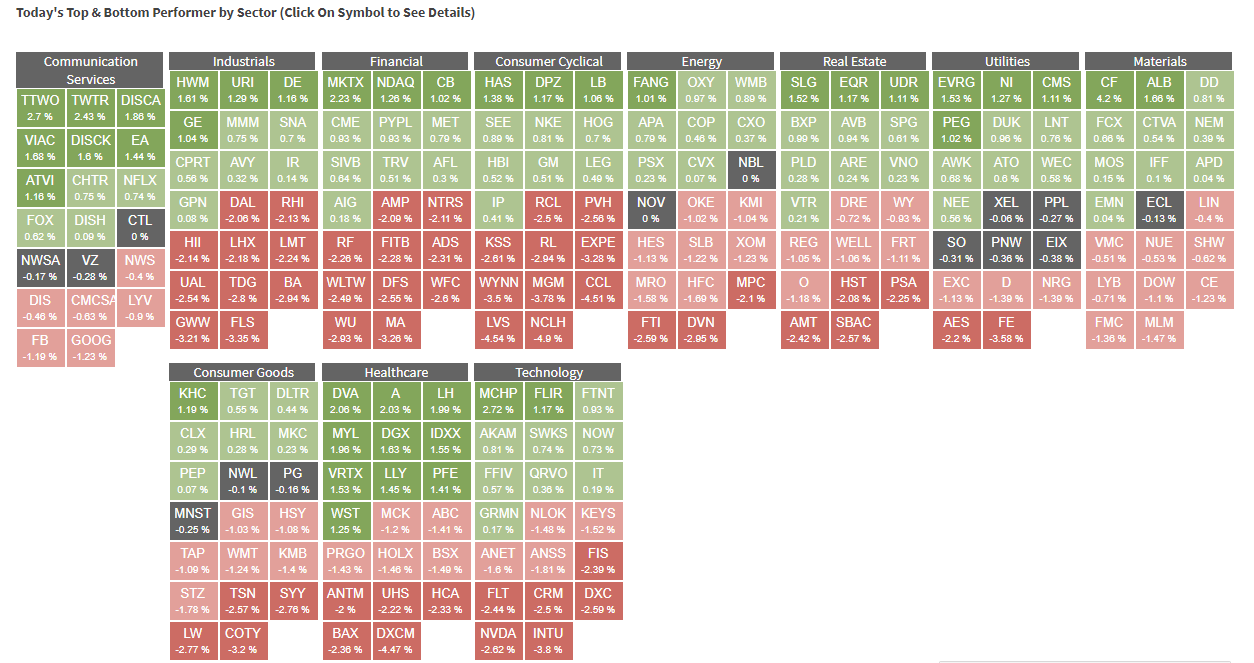
Market & Sector Analysis
Analysis & Stock Screens Exclusively For RIAPro Members
Discover All You Are Missing At RIAPRO.NET
This is what our RIAPRO.NET subscribers are reading right now! Risk-Free For 30-Day Trial.
- Sector & Market Analysis
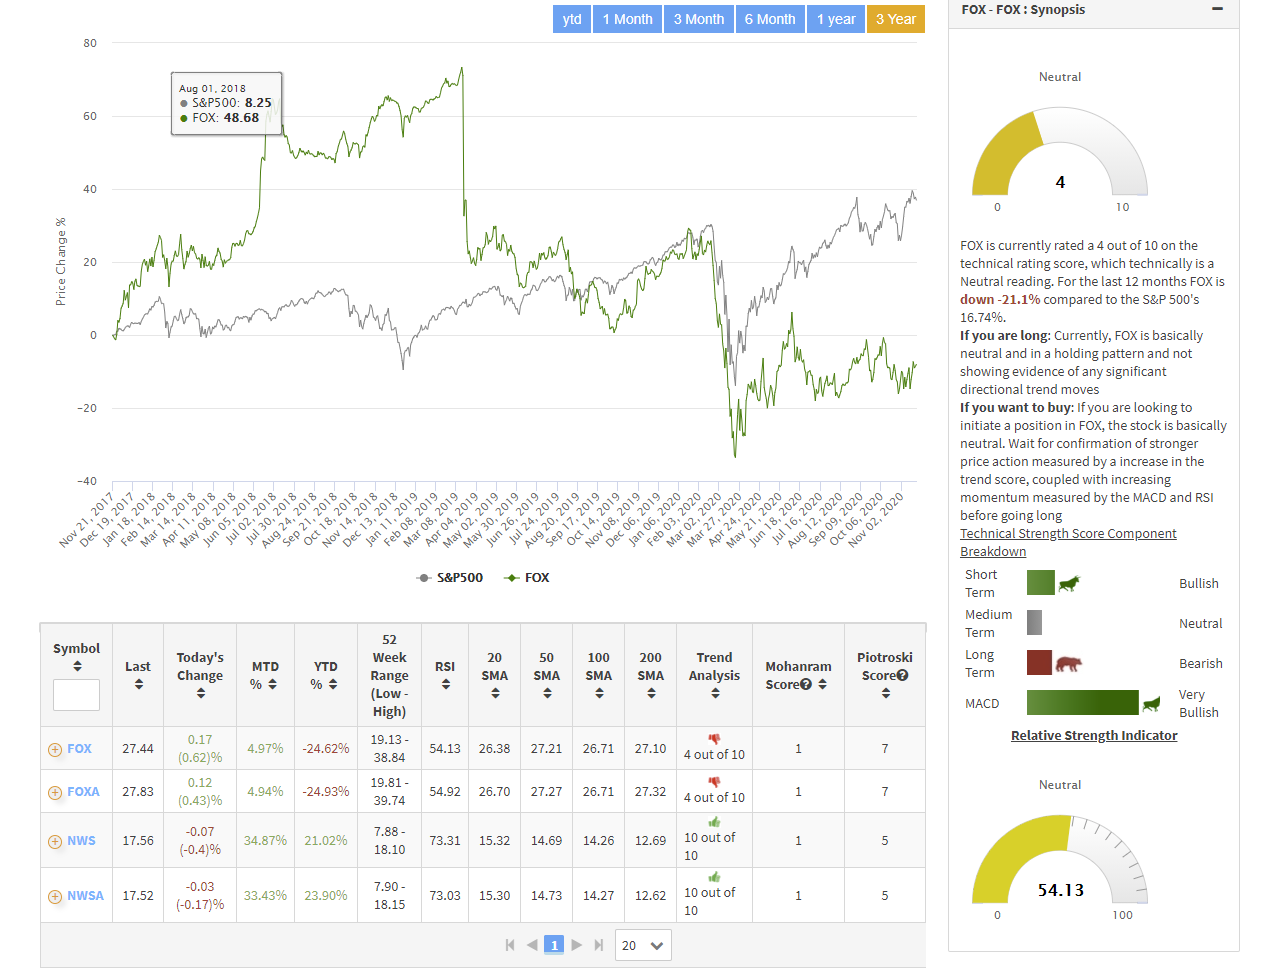
- Technical Gauge
- Fear/Greed Positioning Gauge
- Sector Rotation Analysis (Risk/Reward Ranges)
- Stock Screens (Growth, Value, Technical)
- Client Portfolio Updates
- Live 401k Plan Manager
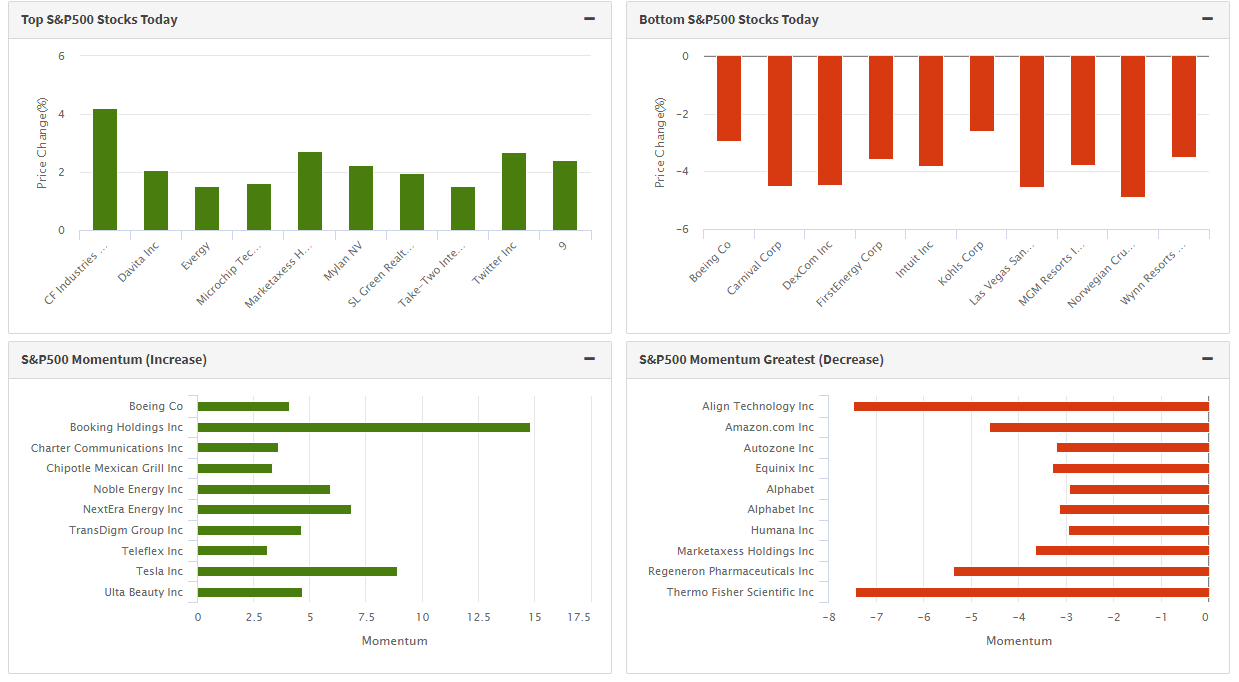
We just launched an all-new dashboard with tons of market data and stock and ETF specific analysis to generate real-time trading ideas. (Screen Shots)

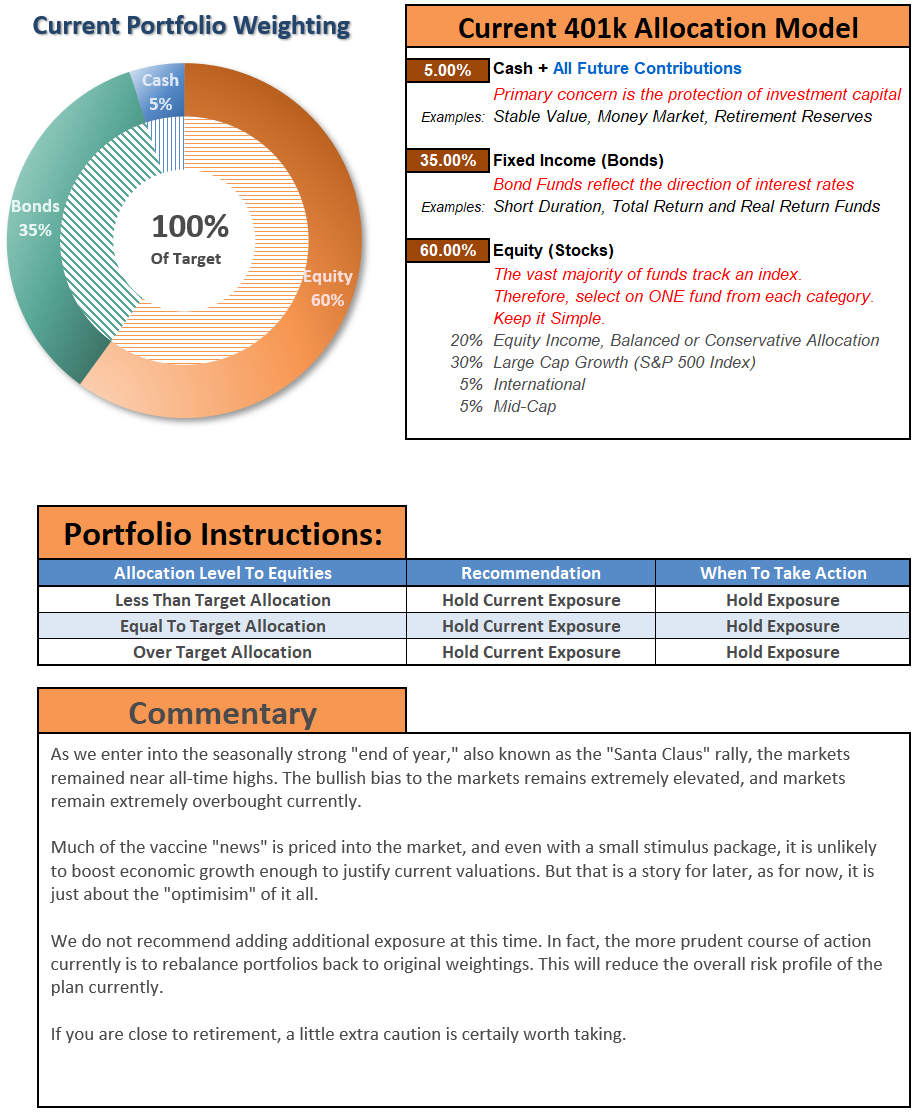
THE REAL 401k PLAN MANAGER
A Conservative Strategy For Long-Term Investors
If you need help after reading the alert, do not hesitate to contact me.
Model performance is a two-asset model of stocks and bonds relative to the weighting changes made each week in the newsletter. Such is strictly for informational and educational purposes only, and one should not rely on it for any reason. Past performance is not a guarantee of future results. Use at your own risk and peril.

401k Plan Manager Live Model
As anRIA PRO subscriber (You get your first 30-days free), you can access our live 401k plan manager.
Compare your current 401k allocation to our recommendation for your company-specific plan and our 401k model allocation.
You can also track performance, estimate future values based on your savings and expected returns, and dig down into your sector and market allocations.
If you would like to offer our service to your employees at a deeply discounted corporate rate, please contact me.


