
Inside This Week’s Bull Bear Report
- Possibilities Versus Probabilities
- How We Are Trading It
- Research Report – Economists No Longer Expect A Recession
- Youtube – Before The Bell
- Market Statistics
- Stock Screens
- Portfolio Trades This Week
It’s Make Or Break Time For The Market
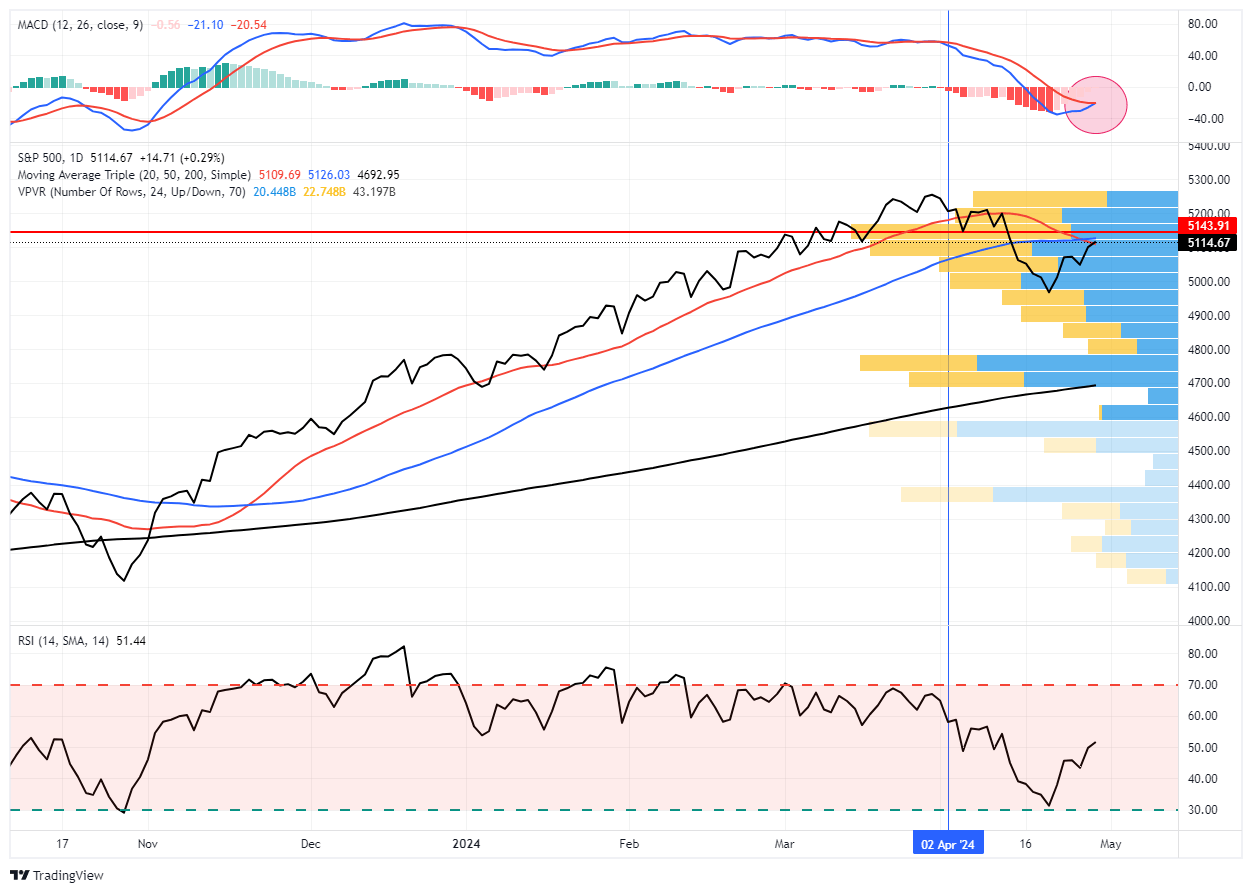
Possibilities and probabilities are currently difficult to evaluate. The drubbing the market took this week was undoubtedly disappointing. However, the market is approaching deep oversold conditions with some minor support heading into next week. Since March, whenever the market reached such oversold levels, a reflexive rally has ensued.
But many concerns are weighing on sentiment currently. The Stocktrader Almanac summed up our current thinking well.
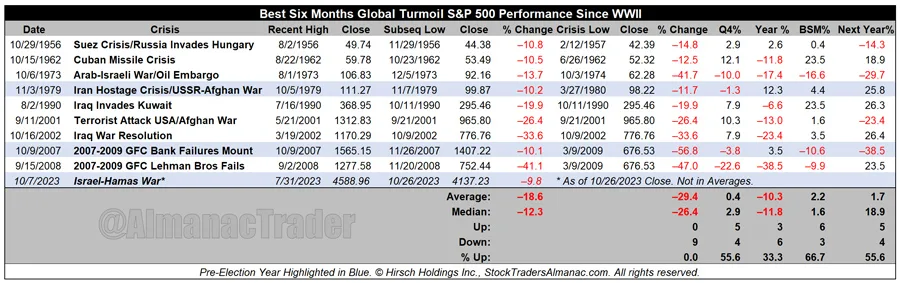
“What’s the history when turmoil grips the planet in October, heading into the Best Six Months of the year? Since WWII, there has been an ongoing war or international conflagration going on practically all the time. Things have come to a head in October many times, with several happening in the Mideast. Current events in the Middle East are especially tense.
We’ve tried to pinpoint the Recent High related to the crisis and then the nearest Subsequent Low around October. We included the nearest Crisis Low, the Q4, Year, Best Six Months, and Next Year % Changes.
We find ourselves today at a similar crossroads with the Hamas attack, Israel’s reaction and unrest in Mideast and on the world stage. If this situation can be contained the market will likely rally sharply. If it drags on or escalates that will likely negatively impact the market.”
We are still in the window of October weakness, but many seasonal factors suggest the possibility of a year-end rally.
Given the very negative levels of investor sentiment and oversold technical conditions, as shown, the possibility of a counter-trend rally is decent. Our weekly technical composite indicator has not been this oversold since October 2022 and is near levels that have historically always marked correction and bear market bottoms.
Investor sentiment is also negative, which, when it reverses, provides the fuel for a rally.
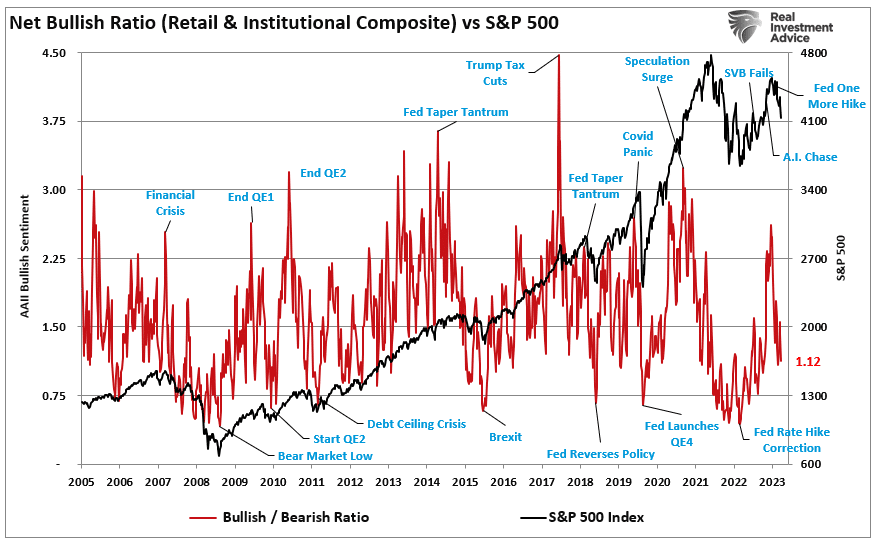
However, use rallies into year-end to rebalance equity risk as needed.
Notably, we must continue to assess the “possibilities” and “probabilities” of expected outcomes to manage our investment risks accordingly.
Need Help With Your Investing Strategy?
Are you looking for complete financial, insurance, and estate planning? Need a risk-managed portfolio management strategy to grow and protect your savings? Whatever your needs are, we are here to help.

Possibilities Versus Probabilities (If It Bleeds, It Leads)
Here are some recent headlines:


You get the idea. There are many things to worry about between geopolitical conflicts, inflation, rising interest rates, increasing debts, and surging deficits. In such an environment, it certainly seems as if the “worst outcomes” are just around the corner. Critically, when it comes to the media, there is an old axiom that “if it bleeds, it leads.” In other words, to get ratings, or in today’s world, clicks and views, the more dire the headline is, the more attention it attracts.
However, as investors, we must carefully navigate the “clickbait” to ensure we are not distracted from our investment goals. As such, we must extract the emotions from our analysis and focus on the underlying data. With that basis, we can begin calculating the “possibilities” and “probabilities” of various outcomes and the potential impact on our investments.
On Wednesday’s Real Investment Show, I spent a lot of time discussing the normal distribution of events in the economy. The chart below is a normally distributed “bell curve” of potential events and outcomes. In simple terms, 68.26% of the time, typical outcomes occur. Economically speaking, such would be a normal recession or the avoidance of a recession. 95.44% of the time, we are most likely dealing with a range of outcomes between a reasonably deep recession and standard economic growth rates. However, there is a 2.14% chance that we could see another economic crisis like the 2008 Financial Crisis.
But what about “economic armageddon?”
That event where nothing matters but “gold, beanie weenies, and bunker.” That is a 0.14% possibility.

While “fear sells,” we must assess the “probabilities” versus “possibilities” of various outcomes.
Playing Poker
Poker is always an easy way to understand this concept.
If you were playing a hand of poker and were dealt a “pair of deuces,” would you go “all-in?”
Of course not.
The reason is you intuitively understand the other factors “at play.” Even a cursory understanding of the game of poker suggests other players at the table are probably holding better hands, which will rapidly reduce your wealth.
Investing in the financial markets is one of the purest forms of speculation. Every day, investors make bets on the future and must weigh the possibilities and probabilities of winning or losing. The size of the “bet” should ultimately be determined by the “potential loss” of being wrong.
Ultimately, investing is about managing those risks that substantially reduce your ability to “stay in the game long enough” to “win.”
It is critical not to let potential outcomes with a minimal probability of occurring dominate your investment thesis.
Psychological Impact
As is always the case, individuals are always looking for why “this time is different.” Not surprisingly, as discussed previously, the consequences of such thinking consistently lead to underperformance. To wit:
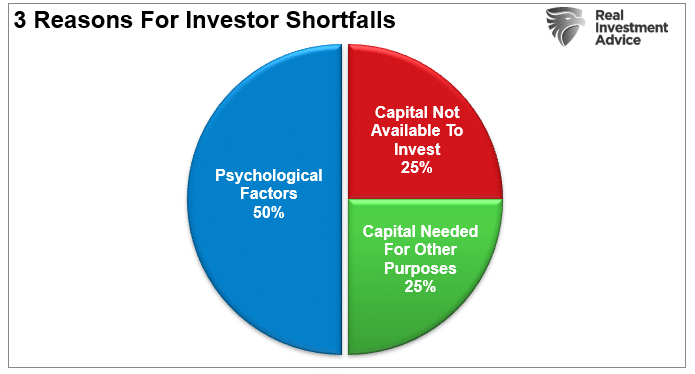
“Throughout history, whenever most investors believed the worst about a particular asset class, such has often been the right time to start buying. As we have often discussed, psychological behaviors account for as much as 50% of the reasons investors consistently underperform the markets over the long term.”
Behavioral biases lead to poor investment decision-making. Dalbar defined nine of the irrational investment behavior biases specifically:
- Loss Aversion – The fear of loss leads to a withdrawal of capital at the worst possible time. Also known as “panic selling.”
- Narrow Framing – Making decisions about one part of the portfolio without considering the effects on the total.
- Anchoring – The process of remaining focused on what happened previously and not adapting to a changing market.
- Mental Accounting – Separating the performance of investments mentally to justify success and failure.
- Lack of Diversification – Believing a portfolio is diversified when it is a highly correlated pool of assets.
- Herding– Following what everyone else is doing. Which leads to “buy high/sell low.”
- Regret – Not performing a necessary action due to the regret of a previous failure.
- Media Response – The media is biased to optimism to sell products from advertisers and attract view/readership.
- Optimism – Overly optimistic assumptions lead to rather dramatic reversions when met with reality.
The biggest problems for individuals are the “herding effect” and “loss aversion.” Notably, “loss aversion” is one of the leading factors influencing investment decisions, according to a survey from the CFA Institute.

“Loss aversion is a tendency in behavioral finance where investors are so fearful of losses that they focus on trying to avoid a loss more so than on making gains. The more one experiences losses, the more likely they are to become prone to loss aversion.” – Corporate Finance Institute
Therefore, to navigate markets over longer-term time frames, we must:
- Avoid investing in events that have a low probability of occurring.
- Don’t try to “trade” markets.
- Reduce leverage and speculative bets.
- Avoid selling quality companies just because they are down.
While it is easy to get tied up in the daily news headlines, investing requires assessing the probabilities of future outcomes.
Nonetheless, we are currently in very uncertain markets, making investing increasingly tricky.
Navigating Uncertain Markets
Investing during periods of uncertainty can be dangerous, particularly when valuations across all asset classes are elevated. Add to that a sharp rise in interest rates, the Federal Reserve tightening monetary policy, and still high prices from the prior inflationary surge. The combination of those events has a long history of unhappy outcomes. However, there are some steps to take when investing in uncertain markets to weather the increased market volatility.
- Have excess emergency savings so you are not “forced” to sell during a market decline to meet obligations.
- Extend your time horizon to 5-7 years, as short-term stresses can take time to resolve.
- Don’t obsessively check your portfolio.
- Consider tax-loss harvesting (selling stocks at a loss) to offset those losses against future gains.
- Stick to your investing discipline regardless of what happens.
Once you are prepared, what investments do well during periods of uncertainty?
“A recession is a good time to avoid speculating, especially on stocks that have taken the worst beating. Weaker companies often go bankrupt during recessions, and while stocks that have fallen by 80%, 90%, or even more might seem like bargains, they are usually cheap for a reason. Just remember — a broken business at an excellent price is still a broken business.” – Motley Fool
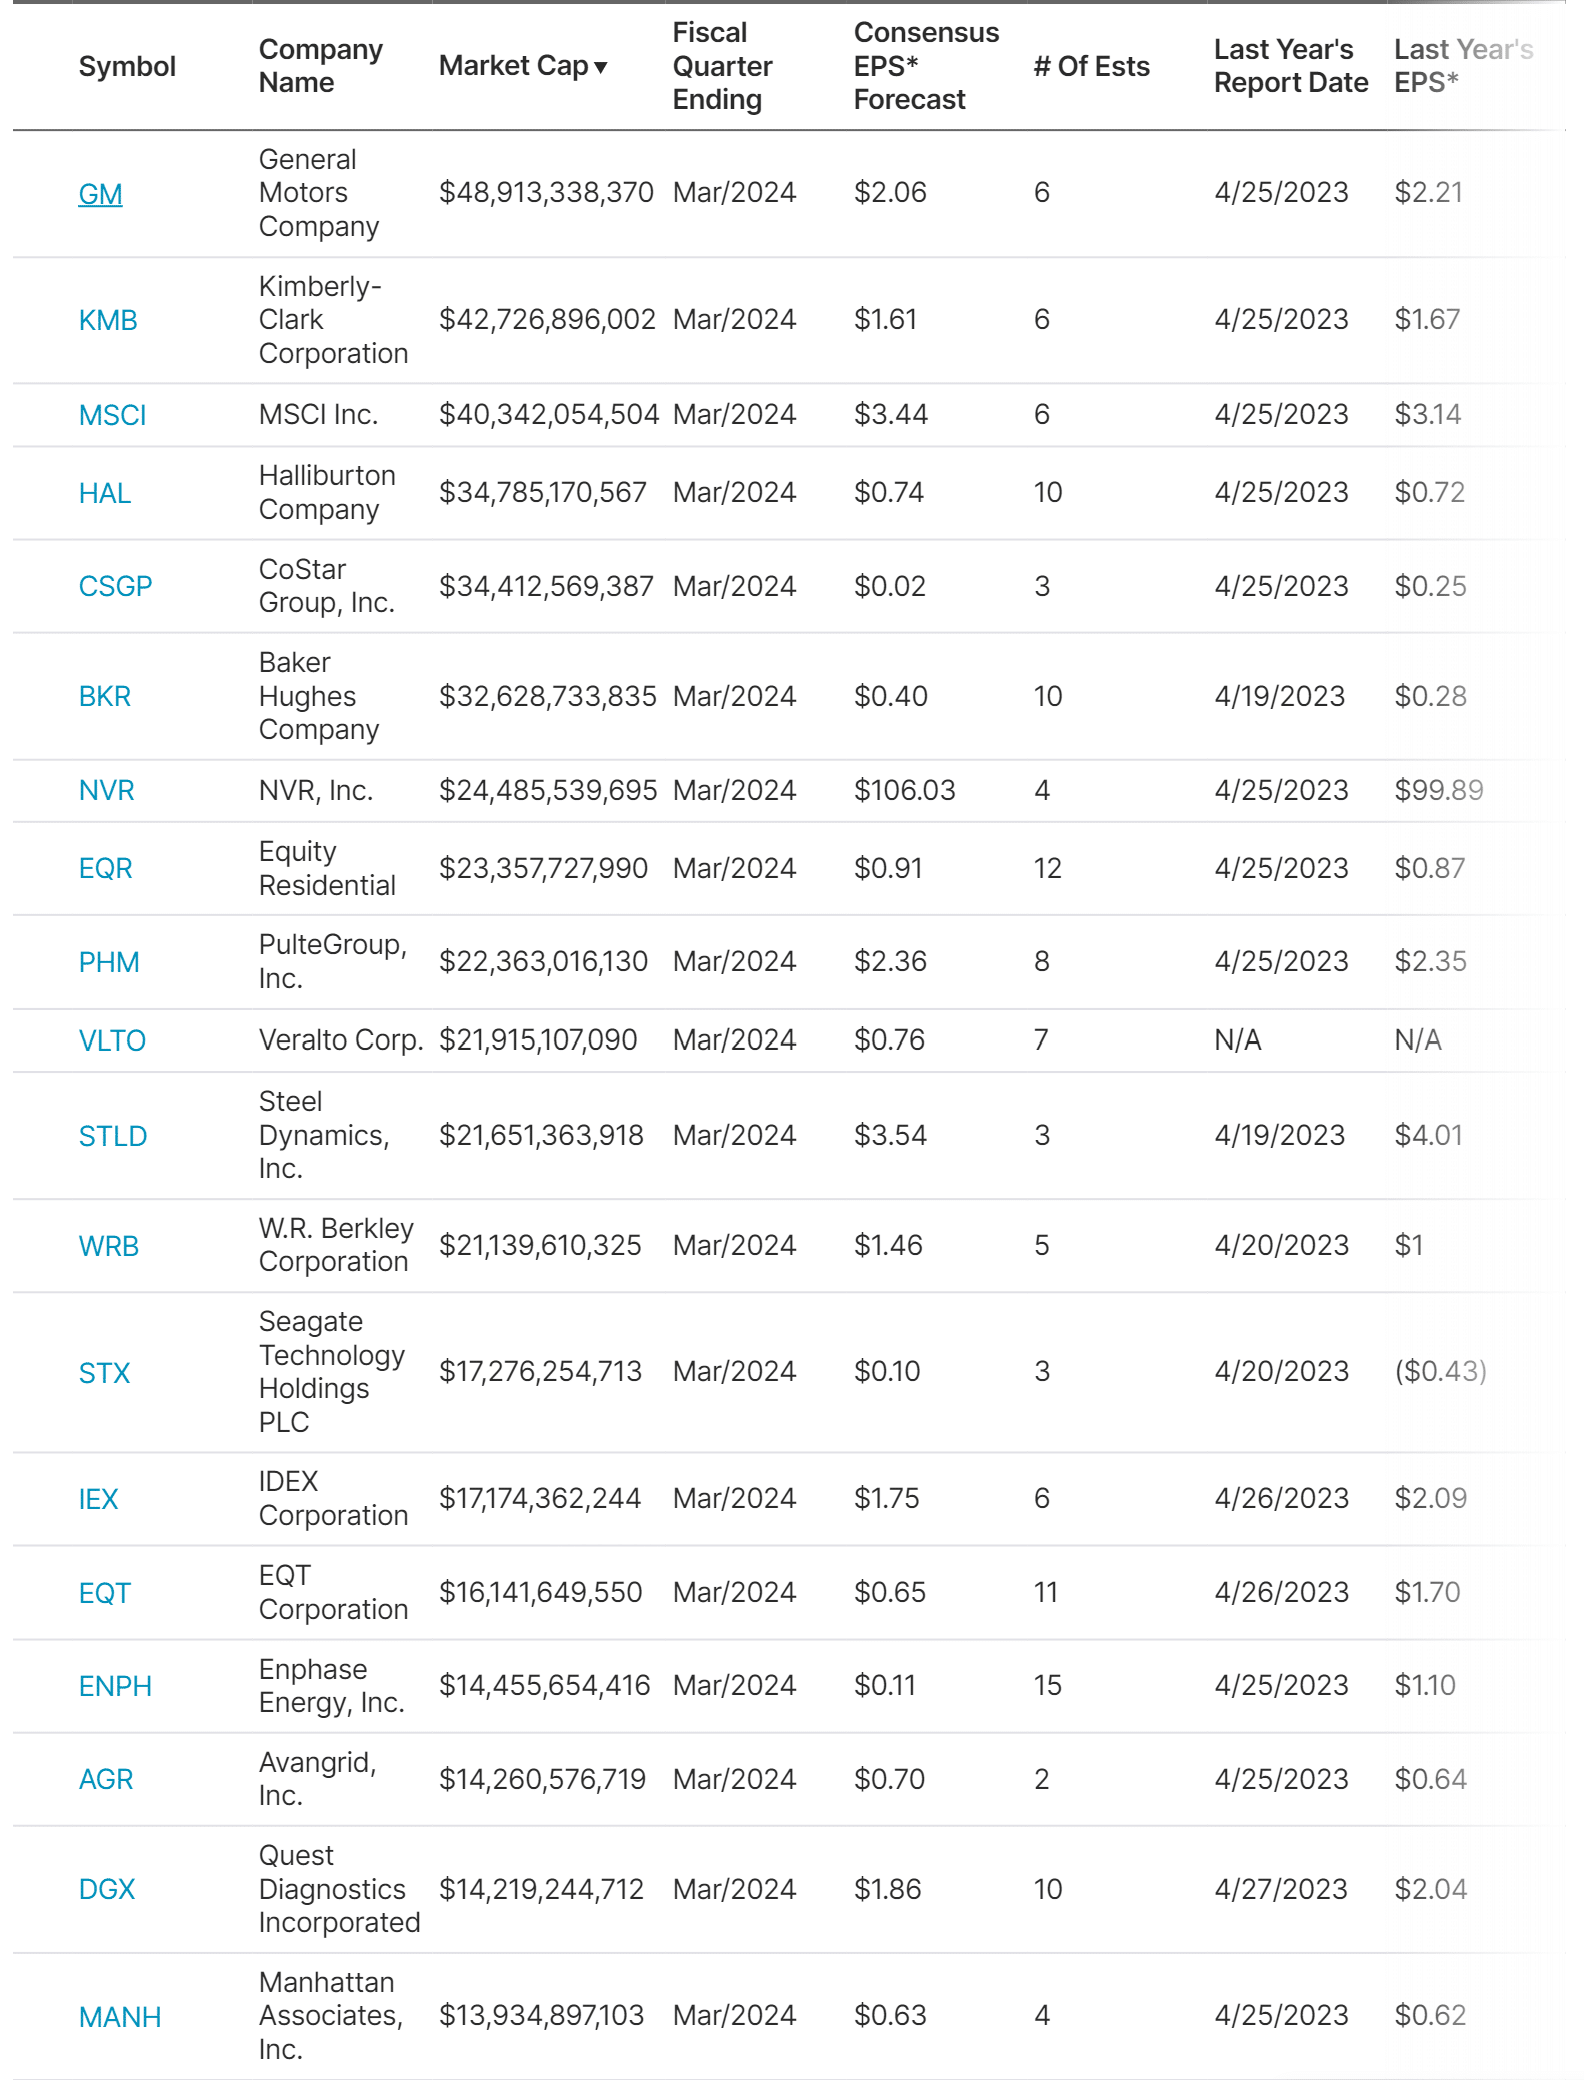
As I noted on Wednesday, there is a large contingent of small and mid-capitalization combines which are not profitable. If the economy slips into a recession, many of these companies will face potential bankruptcies.
During periods of uncertainty, focus on probabilities rather than possibilities and look for companies that:
- Have consistent earnings growth over time.
- Focus on dividend-payers and avoid high leverage.
- Free cash flow and strong operating margins are essential.
- Avoid companies dependent on consumer spending, have high cash burn rates, or have negative incomes and earnings.
- Invest incrementally using lower prices to build positions.
- Lastly, don’t forget about bonds, a haven in an economic storm.
Investing is never easy.
Such is why a well-thought-out strategy, a longer-term timeline, and an ability to stick to your discipline can help you reach your goals.
How We Are Trading It
As we wrote last week:
“Despite weak rally attempts, the summer weakness that started in July remains. The market is oversold, and the recent selling pressure across all assets is nearing exhaustion. If you are worried about what is happening overseas or with the Fed and the economy, use rallies to reduce risk at better price levels.”
- Tighten up stop-loss levels to current support levels for each position.
- Hedge portfolios against more significant market declines.
- Take profits in positions that have been big winners.
- Sell laggards and losers.
- Raise cash and rebalance portfolios to target weightings.
From a portfolio management perspective, we have to trade the market we have rather than the one we think should be. This can make the challenge of battling emotions difficult from week to week. However, as noted, we expect a rally next month, providing a better risk/reward opportunity to rebalance equity exposure.
As we noted last week, periods like this are never fun, but the market never goes straight up or down. However, the psychological strain during periods of market weakness leads to a host of behavioral mistakes that lead to longer-term underperformance. This period will pass, and the next bullish cycle will begin. Sometimes, turning off the television can help reduce the emotional toll of headline news.
See you next week.
Research Report
Subscribe To “Before The Bell” For Daily Trading Updates
We have set up a separate channel JUST for our short daily market updates. Please subscribe to THIS CHANNEL to receive daily notifications before the market opens.
Click Here And Then Click The SUBSCRIBE Button
Subscribe To Our YouTube Channel To Get Notified Of All Our Videos
Bull Bear Report Market Statistics & Screens

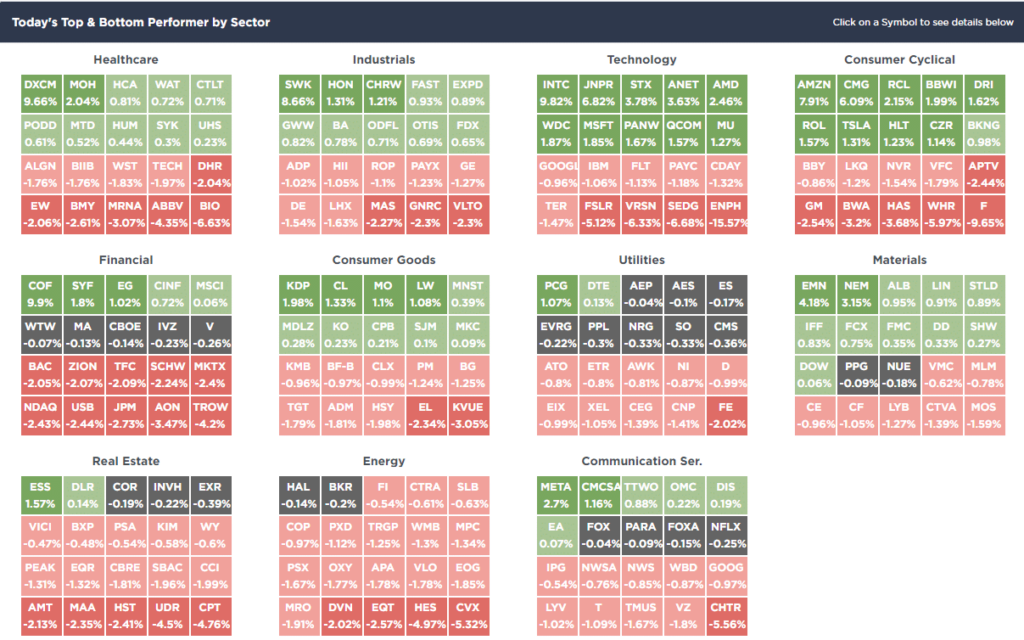
SimpleVisor Top & Bottom Performers By Sector
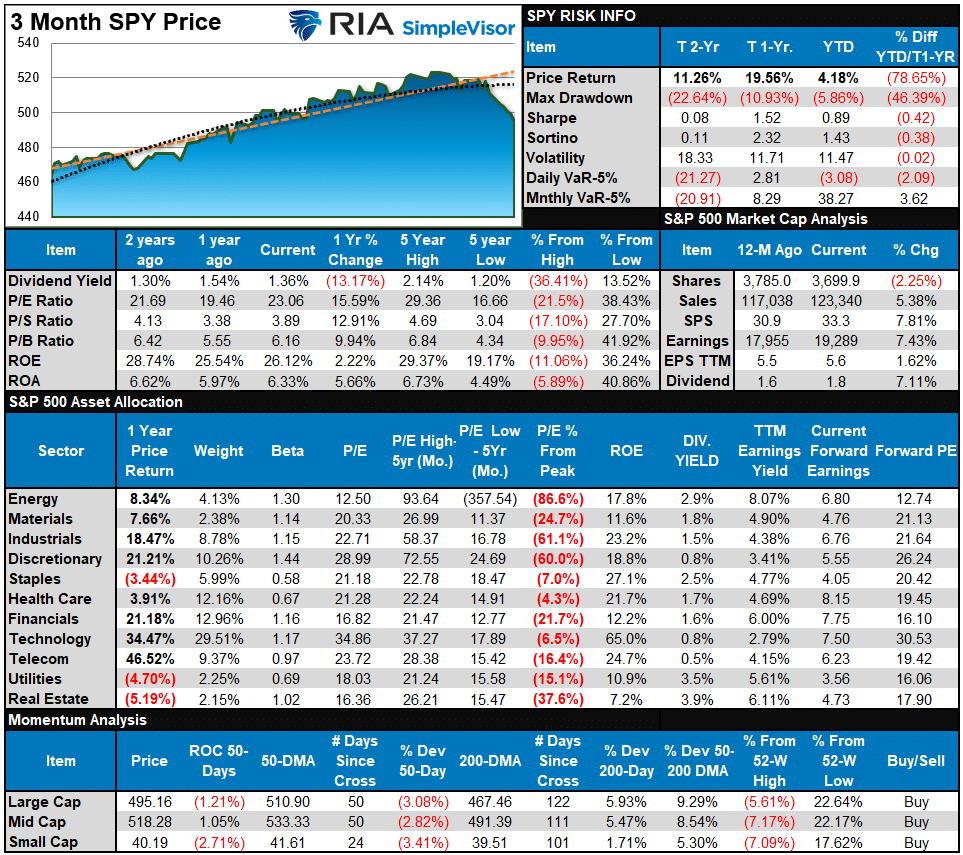
S&P 500 Weekly Tear Sheet
Relative Performance Analysis
Last week, we stated:
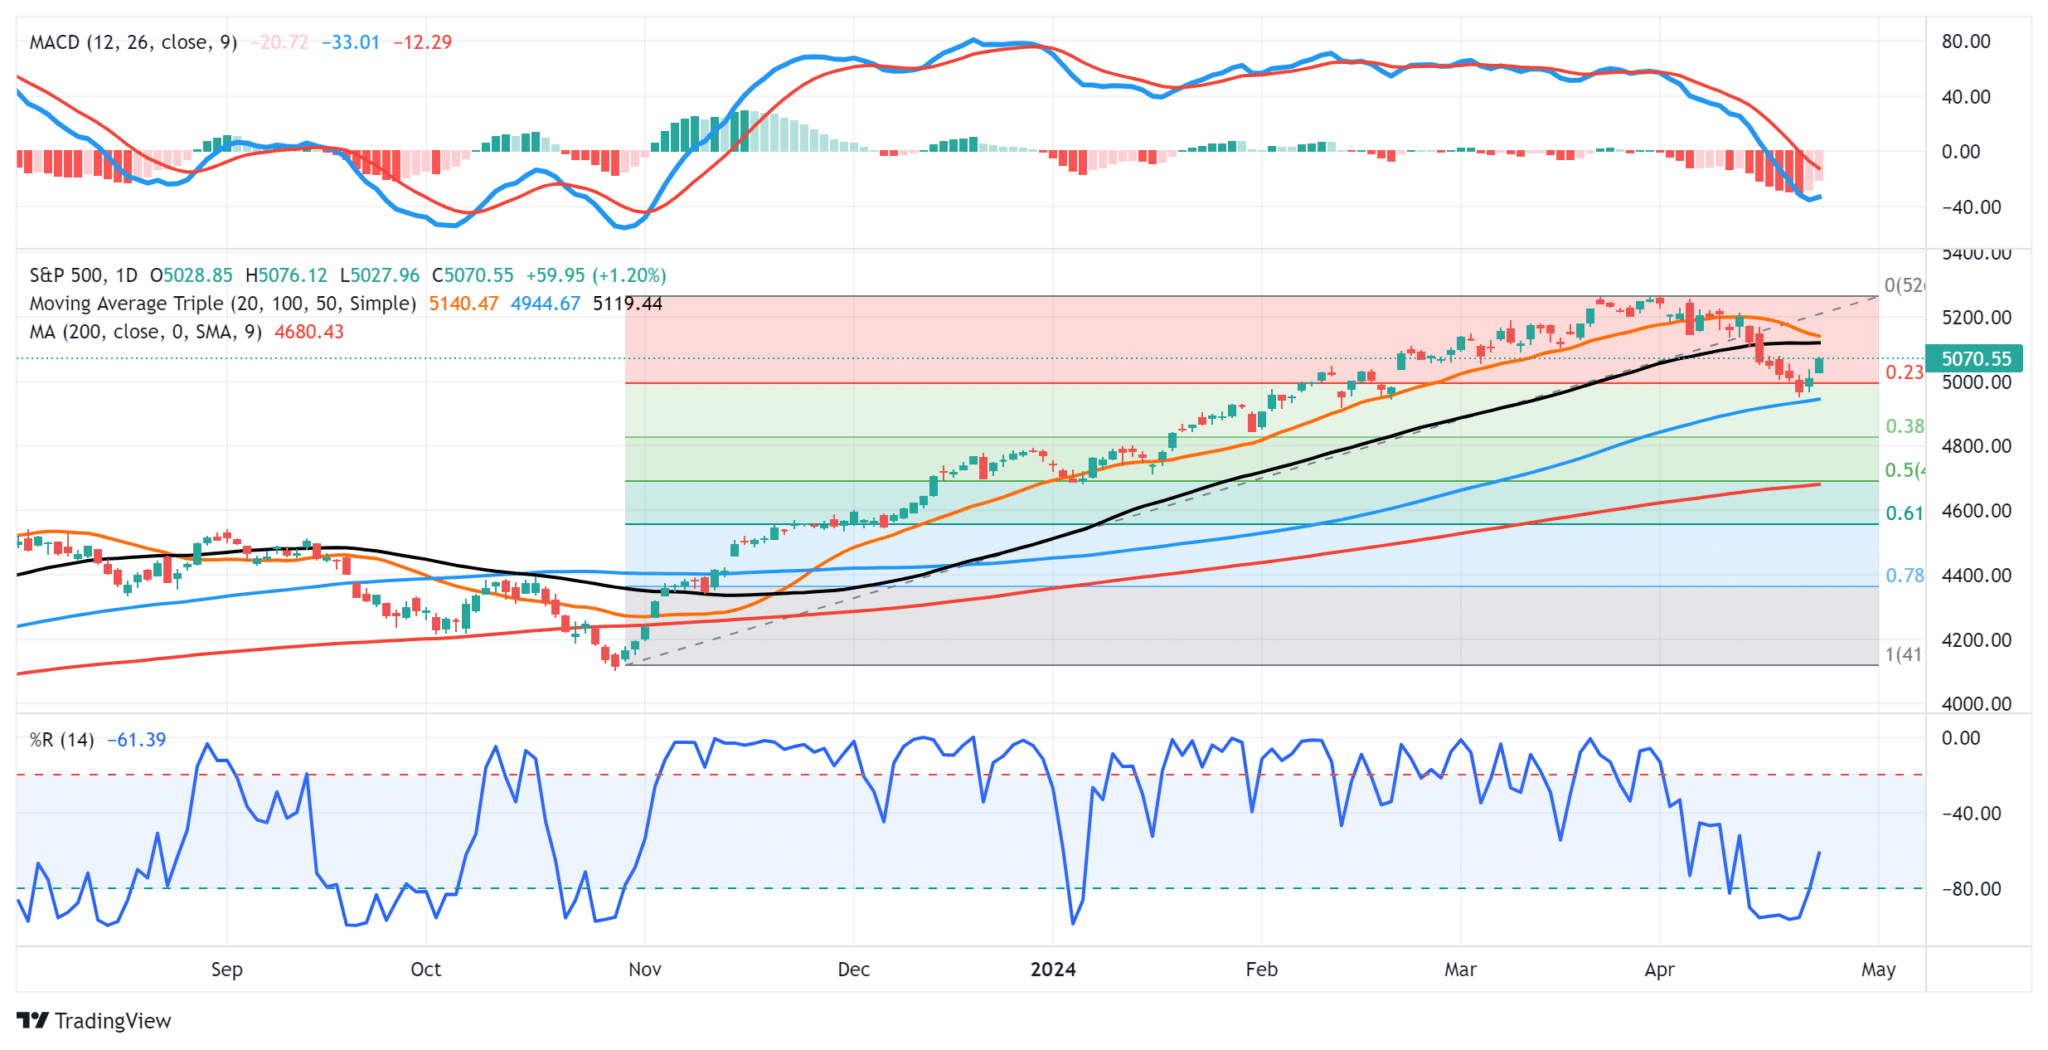
“On a very short-term basis, the markets are oversold and should rally next week. However, given the weakness on Friday, we could see some additional selling pressure on Monday. One thing to note is the deep deviation of the vast majority of sectors below their respective 50-day moving averages. Such deviations are unsustainable and suggest a counter-trend rally is likely.”
Unfortunately, the market did not rally last week, but the deviations and oversold conditions only deepened further, which provides the fuel for a counter-trend rally. Use rallies to reduce risk and rebalance exposures for now until the overall technical footings significantly improve.

Technical Composite
The technical overbought/sold gauge comprises several price indicators (R.S.I., Williams %R, etc.), measured using “weekly” closing price data. Readings above “80” are considered overbought, and below “20” are oversold. The market peaks when those readings are 80 or above, suggesting prudent profit-taking and risk management. The best buying opportunities exist when those readings are 20 or below.
The current reading is 19.08 out of a possible 100.
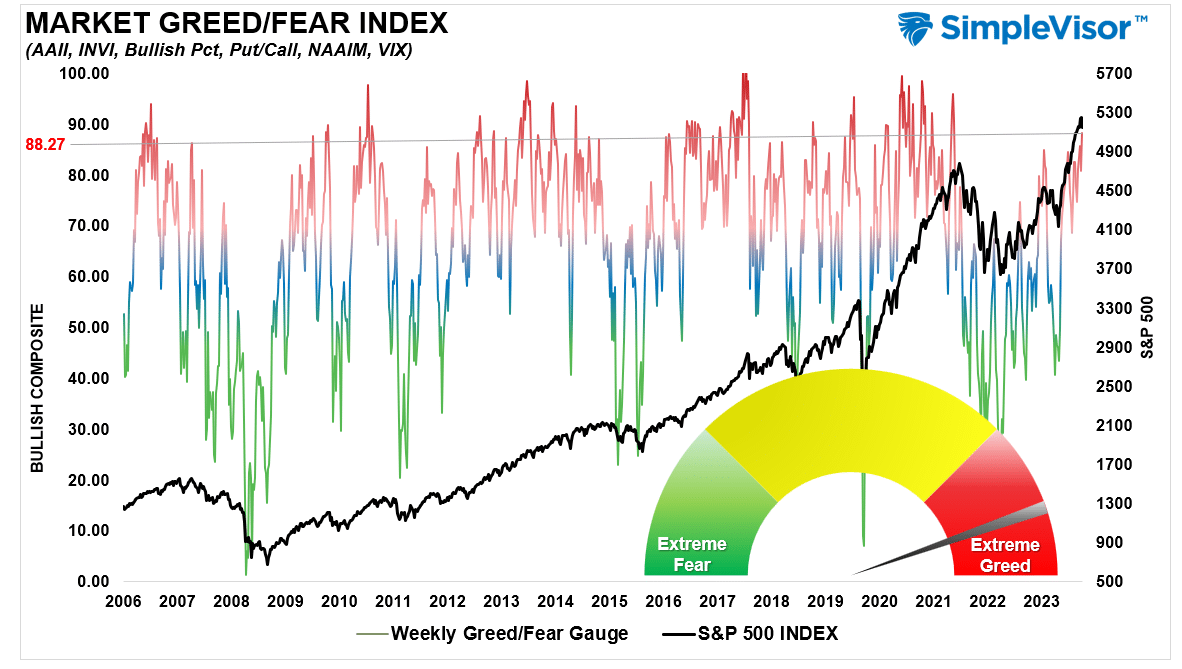
Portfolio Positioning “Fear / Greed” Gauge
The “Fear/Greed” gauge is how individual and professional investors are “positioning” themselves in the market based on their equity exposure. From a contrarian position, the higher the allocation to equities, the more likely the market is closer to a correction than not. The gauge uses weekly closing data.
NOTE: The Fear/Greed Index measures risk from 0 to 100. It is a rarity that it reaches levels above 90. The current reading is 47.90 out of a possible 100.
Relative Sector Analysis
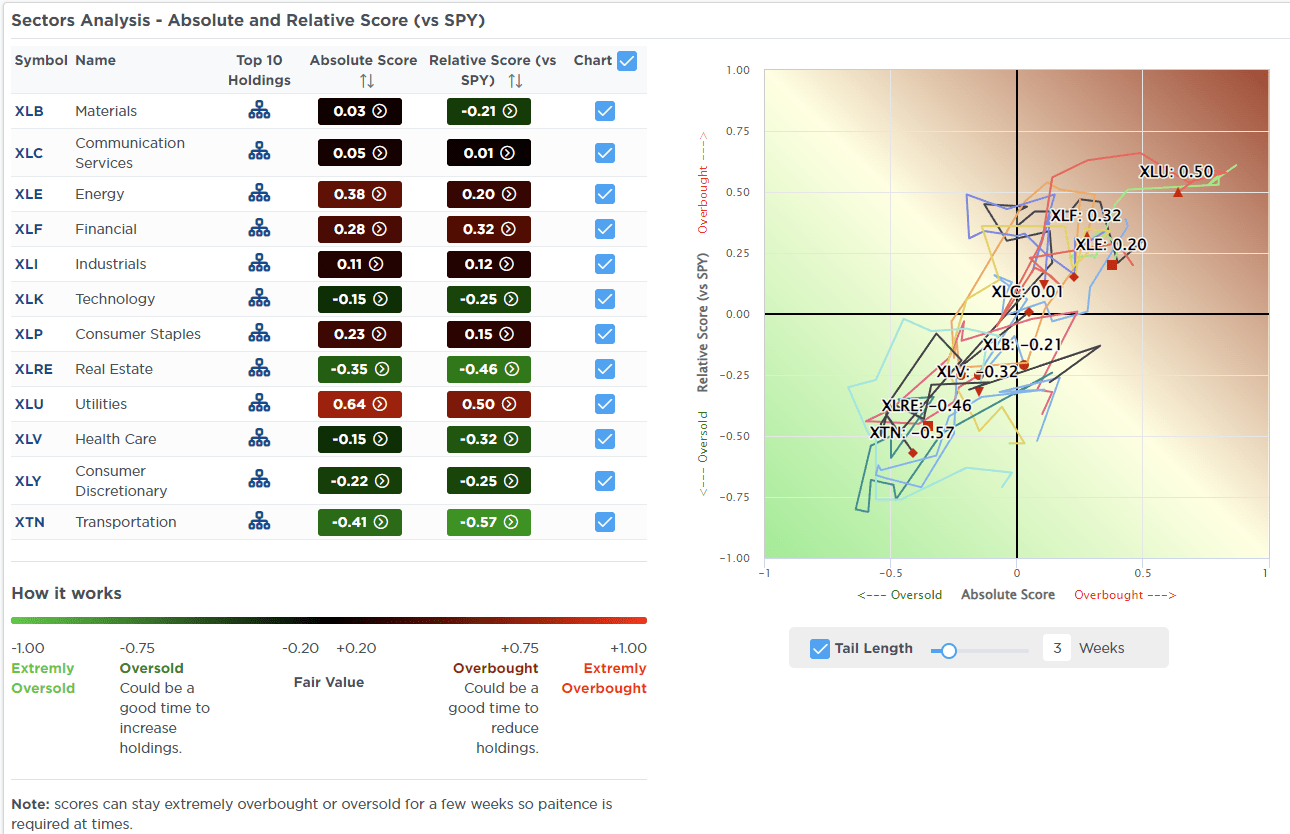
Most Oversold Sector Analysis

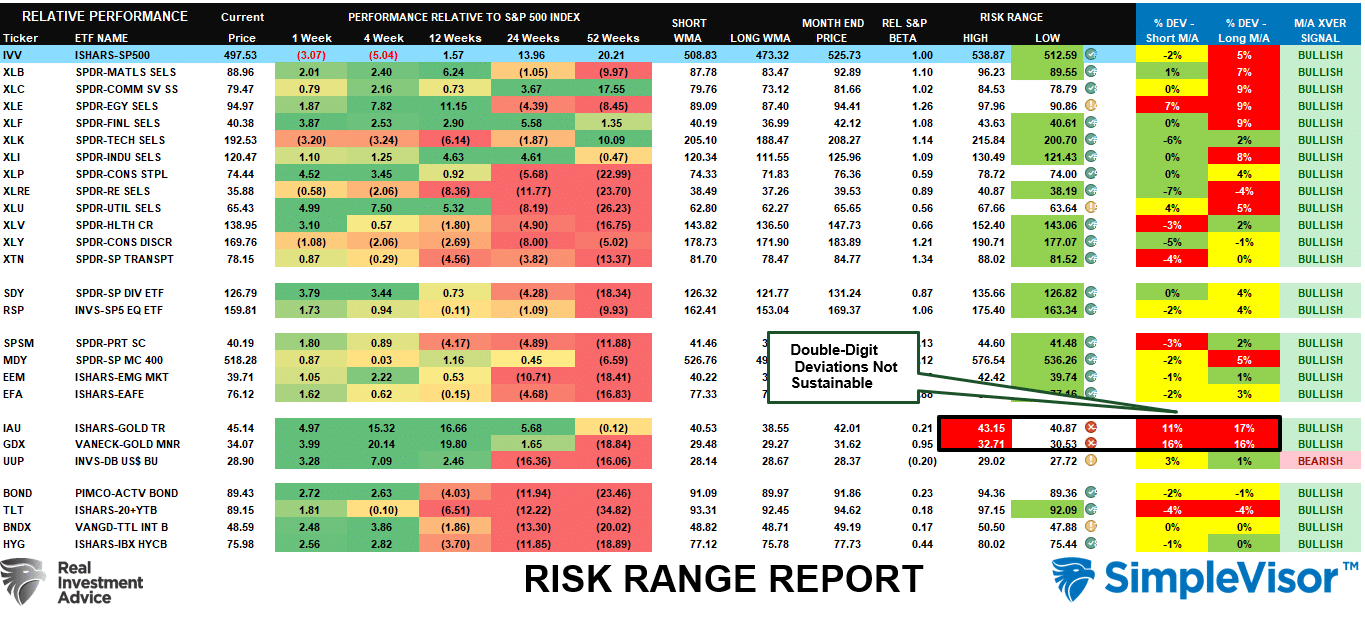
Sector Model Analysis & Risk Ranges
How To Read This Table
- The table compares the relative performance of each sector and market to the S&P 500 index.
- “MA XVER” (Moving Average Crossover) is determined by the short-term weekly moving average crossing positively or negatively with the long-term weekly moving average.
- The risk range is a function of the month-end closing price and the “beta” of the sector or market. (Ranges reset on the 1st of each month)
- The table shows the price deviation above and below the weekly moving averages.
As noted last week, the Israel conflict sent Gold and Gold Miners into more extreme overbought conditions. Consider taking profits, particularly if there is a break in the hostilities. Conversely, most every other sector and market, including Bonds, are deeply oversold and should see buying near-term, particularly as we head into year-end and portfolio managers need to rebalance holdings.
Weekly SimpleVisor Stock Screens
We provide three stock screens each week from SimpleVisor.
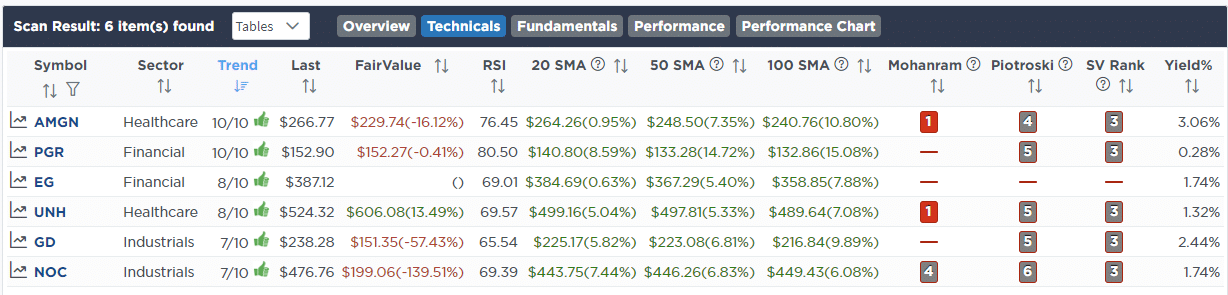
This week, we are searching for the Top 20:
- Relative Strength Stocks
- Momentum Stocks
- Fundamental & Technical Strength
(Click Images To Enlarge)
R.S.I. Screen
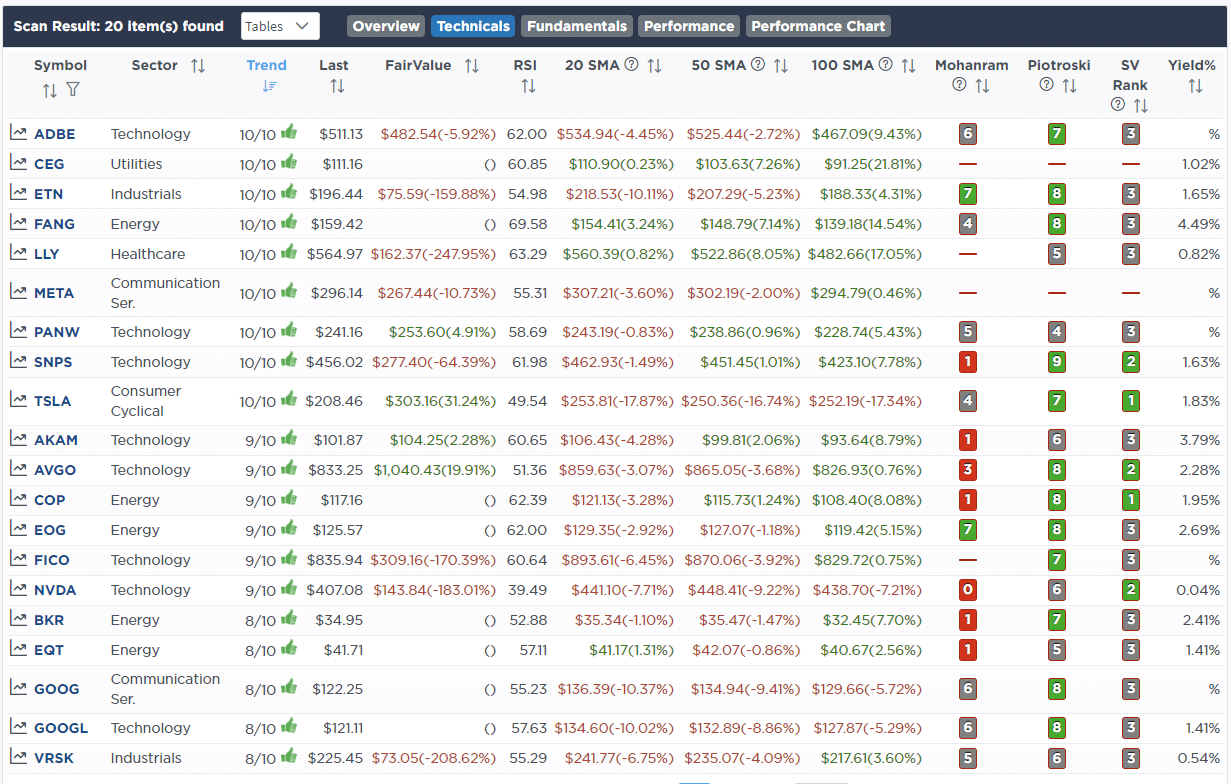
Momentum Screen
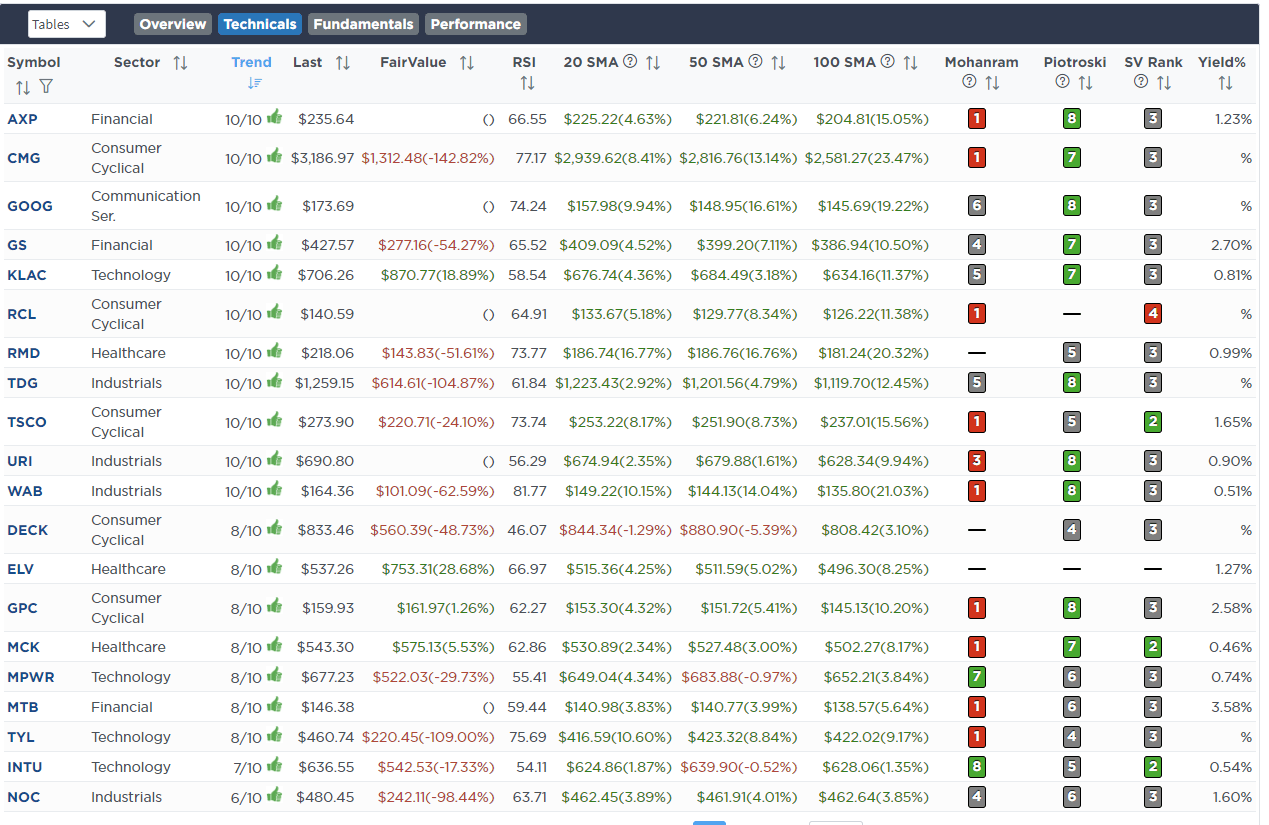
Fundamental & Technical Strength
SimpleVisor Portfolio Changes
We post all of our portfolio changes as they occur at SimpleVisor:
Oct 26th
We are beginning to reduce risk and rebalance portfolios heading into year-end. While we still expect a rally at some point over the next two months, once we get into 2024, we will likely see the impact of higher rates on economic activity. Therefore, we are reducing weightings in Energy and Defense to start and, over the next two months, will continue to rebalance as needed to align risk with expected outcomes next year.
In the equity model, we are reducing both Exxon Mobil (XOM) and Raytheon (RTX) from 3% to 2% and 3% to 1.5%, respectively. We reduced the iShares Energy ETF (XLE) from 3% to 2% in the ETF model.
Equity Model
- Reduce Exxon Mobil (XOM) from 3% to 2% of the portfolio.
- Reduce Raytheon Technologies (RTX) from 3% to 1.5% of the portfolio.
ETF Model
- Reduce the iShares Energy ETF from 3% to 2% of the portfolio.

Lance Roberts, C.I.O.
Have a great week!

