
Inside This Week’s Bull Bear Report
- A Rising Tide Lifts All Boats?
- How We Are Trading It
- Research Report – Cash On The Sidelines – A Myth That Won’t Die
- Youtube – Before The Bell
- Market Statistics
- Stock Screens
- Portfolio Trades This Week
Administrative Note
This week’s newsletter will be abbreviated as I present at the RIA Economic Summit in Houston this morning. However, the entire newsletter will return next week. I appreciate your patience and your readership.
If you have any questions, please click this link.
Have a great week.
Market Review And Update
Last week’s newsletter discussed the continued rally in the market and the breakout to new highs as expectations for substantial rate cuts this year persist. To wit;
“Nonetheless, the breakout to new highs is encouraging and suggests the two-year market correction process is behind us. The action is bullish from a technical perspective. However, the more overbought conditions have failed to correct meaningfully, suggesting further upside from current levels may be somewhat limited. I expect we will likely see another corrective phase before the end of summer.”
The MACD “buy signal” is firmly intact, although at a high level, suggesting the bullish bias remains. While the market is overbought in the short term, corrections will likely remain mild with 4800, where the market broke out, remaining essential support.

As we have discussed, there is little reason to be bearish on the market. The ongoing advance remains within a trend channel from the October 2023 lows. We continue to recommend maintaining exposure to equity risk, but be aware the current advance is getting rather long concerning time. The market will have a correction at some point over the next few months, which will provide a better entry point for increasing exposure.
Nonetheless, the market continues its advance, but as we showed last week, it is back to the Mega-caps leading the way, with everything else lagging.

This week, we are discussing the death of MPT and why a rising tide is not lifting all boats.
Need Help With Your Investing Strategy?
Are you looking for complete financial, insurance, and estate planning? Need a risk-managed portfolio management strategy to grow and protect your savings? Whatever your needs are, we are here to help.

A Rising Tide Lifts All Boats?
While preparing my slide presentation for this weekend’s conference, some of the charts I was building surprised me. However, before I get there, let me start with a prevalent and widely practiced portfolio theory based on diversification.
The idea of diversification was derived initially from Harry Markowitz’s seminal work on what has become known as “Modern Portfolio Theory.”
“Modern portfolio theory (MPT), or mean-variance analysis, is a mathematical framework for assembling a portfolio of assets such that the expected return is maximized for a given level of risk. It is a formalization and extension of diversification in investing, the idea that owning different kinds of financial assets is less risky than owning only one type. Its key insight is that an asset’s risk and return should not be assessed by itself, but by how it contributes to a portfolio’s overall risk and return. It uses the variance of asset prices as a proxy for risk.” – Investopedia
The essential premise is that holding a basket of diversified assets is 1) less “risky” and 2) provides better returns on a risk-adjusted basis than owning just one asset, such as the S&P 500. The theory worked well during the last century when various asset classes did not correlate highly. However, with advances in Technology, transaction speeds, and information flows, correlations rose at the turn of the century. The chart below compares an S&P 500 Index Fund to a Global Asset Allocation fund.

From 2000 through 2007, allocation funds provided comparable performance to owning an S&P 500 index fund. However, where MPT failed was following the “Financial Crisis” in 2008. While the allocation fund did lose slightly less capital during the financial crisis, it did not minimize the risk of loss by much. Moreover, the performance gap compounded over the next decade as international and emerging markets markedly underperformed domestic equity and provided a minimal reduction in volatility.
Moreover, the allocation fund fell far short of the “average 8% return” promised by the media. The S&P 500 index didn’t accomplish that goal either until the peak in 2022.

So, why didn’t the rising tide of U.S. large-cap equities lead to better performance of other markets and sectors?
The Law Of Change
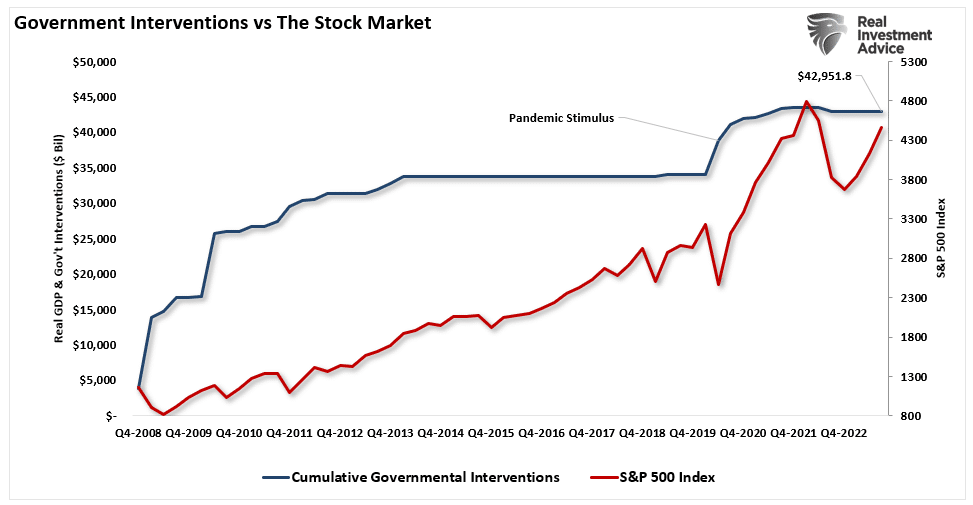
As we discussed in the “Markets Are Front Running The Fed,“ the unprecedented flow of liquidity, both monetary and fiscal, found its way into the financial markets.
“The psychological change is a function of more than a decade of fiscal and monetary interventions that have separated the financial markets from economic fundamentals. Since 2007, the Federal Reserve and the Government have continuously injected roughly $43 Trillion in liquidity into the financial system and the economy to support growth. That support entered the financial system, lifting asset prices and boosting consumer confidence to support economic growth.”
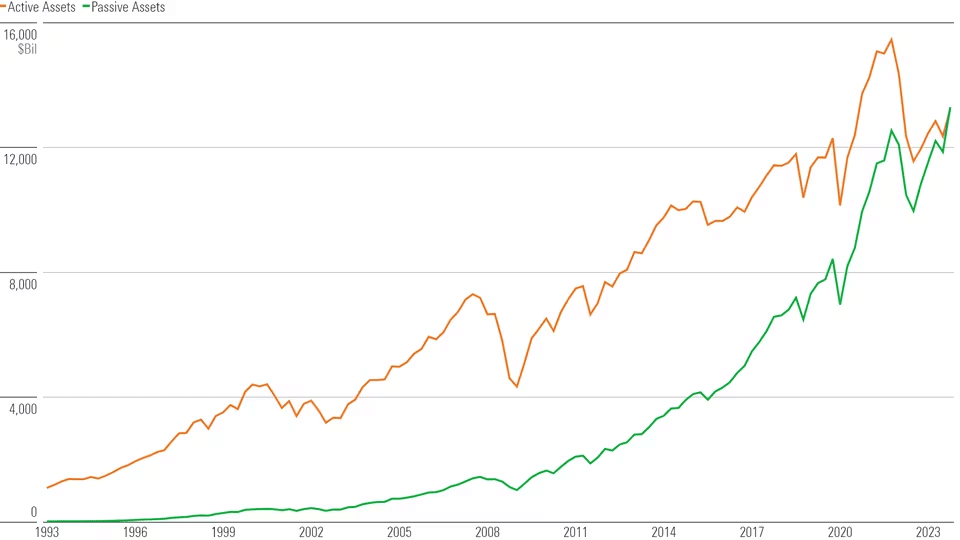
As liquidity flooded the financial markets, asset managers, pension funds, etc., began to funnel more and more money into large, highly liquid companies. That money flowed into those companies, and their respective market capitalization grew and comprised an ever-increasing index share. Compounding that effect was the rise of Exchange Trade Funds, or ETFs, which retail investors and advisors have used increasingly over the last decade. As shown, passive index shares have swallowed a massive portion of inflows.
That ETF issuance surge and the assets’ growth under management fuel the performance of the top 10 stocks. As we discussed previously:
“In other words, out of roughly 1750 ETF’s, the top-10 stocks in the index comprise approximately 25% of all issued ETFs. Such makes sense, given that for an ETF issuer to “sell” you a product, they need good performance. Moreover, in a late-stage market cycle driven by momentum, it is not uncommon to find the same “best performing” stocks proliferating many ETFs.”
Therefore, as investors buy shares of a passive ETF, the shares of all the underlying companies must be purchased. Given the massive inflows into ETFs over the last year and subsequent inflows into the top-10 stocks, the mirage of market stability is not surprising.
As shown, for each $1 invested in the S&P 500 index, $0.35 flows directly into the top 10 stocks. The remaining $0.65 is divided between the remaining 490 stocks.

The law of change states:
“Change will occur, and the elements in the environment will adapt or become extinct, and that extinction in and of itself is a consequence of change.“
For investors, the flood of liquidity, combined with the “passive indexing effect,” has changed market dynamics over the last decade and pushed investors to become increasingly allocated to domestic equities and leave MPT behind. Such is particularly the case as the rising tide of domestic equities, particularly Technology, left everything else behind.
Leaders And Mostly Laggards
While many of us “old guys” who are still in the business believe in fundamentals and valuations, the market hasn’t been concerned with such quaint ideologies for over a decade. How often have you heard someone say, “This year, Emerging Markets and International stocks will outperform because their valuations are cheap.” Or, “Gold will be an outperformer this year due to inflation?” Yet, for the last decade, all those prognostications have fallen well short of expectations – except for the technology-heavy Nasdaq and the S&P 500 Index, which is a distant second.

That analysis is why a “diversified portfolio” of stocks, bonds, real estate, and international stocks has suffered dismal returns over the last decade. However, the performance drag in the S&P 500 itself is also quite broad. Since 2020, every sector in the S&P 500 index has underperformed the index itself, except for Technology.

Because of its heavy weighting in the S&P 500 index, the rising tide of Technology has created a mirage of overall market performance. However, when looking below the surface, that rising tide has not lifted all boats.
For now, there is little to deter portfolio managers from chasing the mega-cap stocks for performance reporting purposes. Such is because a significant divergence between the manager’s performance and the benchmark index will lead to “career risk.” However, the problem is compounded by retail investors piling money into passive ETFs.
There is a fundamental belief by investors that “for every buyer, there is a seller.”
However, the correct statement is:
“For every buyer, there is a seller….at a specific price.”
In other words, when the selling begins, those wanting to “sell” overrun those willing to “buy.” Therefore, prices drop until a “buyer” is willing to step in.
That surge in selling pressure creates a “liquidity vacuum” between the current price and a “buyer” willing to execute. In other words, just as professional managers are trying to sell their shares of Apple (AAPL), the other 343 ETFs that own Apple are vying for the same scarce pool of buyers in a declining market.
Furthermore, advisors are actively migrating portfolio management to passive ETFs for some, if not all, of the asset allocation equation. The rise of index funds has turned everyone into “asset class pickers” instead of stock pickers. However, just because individuals are choosing to “buy baskets” of stocks rather than individual securities, it is not a “passive” choice but rather “active management” in a different form.
With the concentration of risk in a handful of stocks, the markets are set for a rather vicious cycle. The concentration of holdings and the subsequent lack of liquidity suggest reversals will not be a slow and methodical process. Instead, it will be a stampede with little regard for price, valuation, or fundamental measures as the exit narrows.
However, while the risk is apparent, there seems little to deter the current flow of money, which disproportionately benefits a smaller pool of stocks. What will ultimately cause a shift in investor behavior? Outside of the onset of another financial “event” like 2008, I don’t know.
What I do know is that as investors, we must acknowledge that MPT is dead and play the game by the new rules of a rising tide of liquidity and money flows.
As my Dad used to say: “Them’s the rules. You’se bets your money and play the game.”
How We Are Trading It
There has been little change to our positioning this past week. As noted last week:
“The breakout to new highs keeps us bullishly biased toward the markets. The number of stocks trading above the 50- and 200-DMA remains healthy, and volatility remains low, suggesting little reason to be overtly concerned about financial conditions. As such, we will look for opportunities to increase our exposure to full target weightings.”
Such continues to be the case this week. With earnings season in full swing, the positive news flow will continue to push stocks higher, and as noted above, that will be primarily dominated by a handful of stocks. Next week is the next FOMC meeting, which could well introduce some volatility into the markets, particularly if the Fed tries to walk back some of its recent dovish tilt. We will also get the next read on inflation data as well.
We continue to be well aware of the underlying market risk and continue to watch our technical indicators for any sign of a change. For now, there appears to be little need for being overly cautious. Although a bit of caution never hurts.
Have a great week.
Research Report

Subscribe To “Before The Bell” For Daily Trading Updates
We have set up a separate channel JUST for our short daily market updates. Please subscribe to THIS CHANNEL to receive daily notifications before the market opens.
Click Here And Then Click The SUBSCRIBE Button
Subscribe To Our YouTube Channel To Get Notified Of All Our Videos
Bull Bear Report Market Statistics & Screens

Will Return Next Week
SimpleVisor Portfolio Changes
We post all of our portfolio changes as they occur at SimpleVisor:
Jan 22nd
With the markets registering a MACD buy signal and breaking out to all-time highs, we are adding a little exposure to our portfolios. As we go through earnings season, we will continue to add exposure as needed, using short-term corrections as opportunities. Today, we are adding to our stake in Apple (AAPL) after its recent correction, it is triggering a buy signal. Given that the “Magnificent 7” are once again leading the charge, and the ETF model doesn’t have direct exposure, we are initiating a position in the Mega-Cap Growth ETF (MGK) to compensate.
Equity Model
- Add 1% to Apple (AAPL)
ETF Model
- Initiate a 1% position in the Mega-Cap Growth ETF (MGK)
Jan 25th
This morning, we are using the recent declines in some sectors to increase our portfolio exposure slightly. As we have noted previously, we want to maintain our overall equity exposure and opportunistically use the markets to increase that exposure toward target portfolio weights. We are doing that as detailed in the models below. With the overall market overbought, we are still underweight equity exposure, and hopefully, we will get an opportunity soon to move portfolios closer to target weights.
Equity Model
- Reduce AMD (AMD) to 3% of the portfolio (taking profits after a huge run.)
- Increase Comcast Communications (CMCSA) to 4% of the portfolio.
- Increase United Healthcare (UNH) to 3.5% of the portfolio.
ETF Model
- Initiate a 1% of the portfolio position in SPDR Basic Materials ETF (XLB).
- Increase SPDR Healthcare ETF (XLV) to 9.25% of the portfolio.

Lance Roberts, C.I.O.
Have a great week!

