Bull Trend Remains Despite Inflation Scare


Inside This Week’s Bull Bear Report
- Bull Trend Remains
- How We Are Trading It
- Research Report – Powell Says The Quiet Part Out Loud
- Youtube – Before The Bell
- Market Statistics
- Stock Screens
- Portfolio Trades This Week
Market Review And Update
Last week, we discussed the unstoppable advance driven by the mega-capitalization stocks, which topped the psychological 5000 level.
“With the strong momentum carrying that particular group of stocks, the index will likely try to push higher over the next few days. However, as shown, the market is back to more extreme overbought levels, and bullish sentiment has reached ‘greed.’ Most notably, the deviation between the index and the 200-DMA is getting rather extreme, which has typically preceded short-term corrections.
While we are highly confident that a correction is coming, the timing of that event is uncertain. As such, we must maintain exposure to garner performance while we can. However, once signals are triggered, we will become more aggressive in the risk reduction process.“
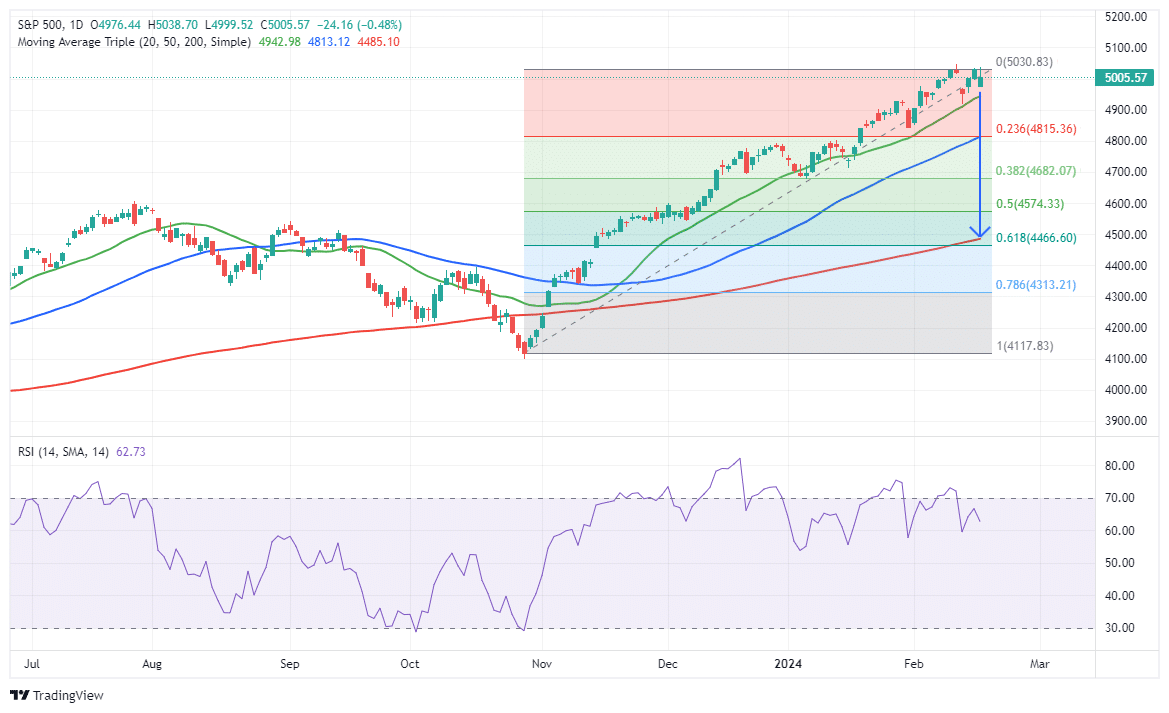
The market rebounded mid-week from the disappointing inflation report but stumbled again on Friday after producer inflation. The market’s momentum remains strong, and investor optimism is very high. The only question is what causes a short-term correction to reduce the deviations between the market and the 200-DMA, as shown above. Stocktrader’s Almanac provided a clue.
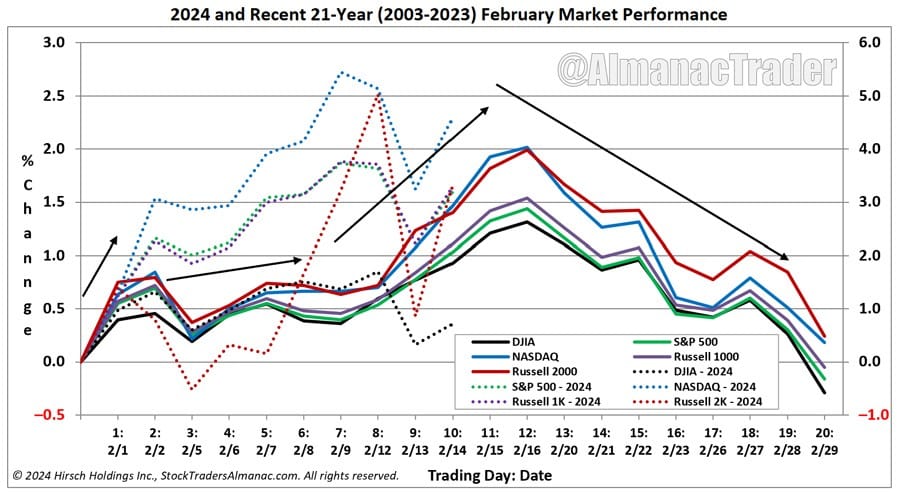
“Mid-February has arrived and with it the probability of some market weakness in the near term is on the rise. February is the weak link in the Best Months and as we have pointed out on several occasions its average performance in election years, since 1950, has been tepid. As of yesterday’s close, NASDAQ was up 4.58% this February, S&P 500 was up 3.20% while DJIA was holding onto a 0.72% advance. Compared to the recent 21-year average performance, S&P 500 and NASDAQ were well above average levels at this point in February while DJIA was modestly lagging. Based upon the following chart, typical second half of February weakness could begin any day now.”
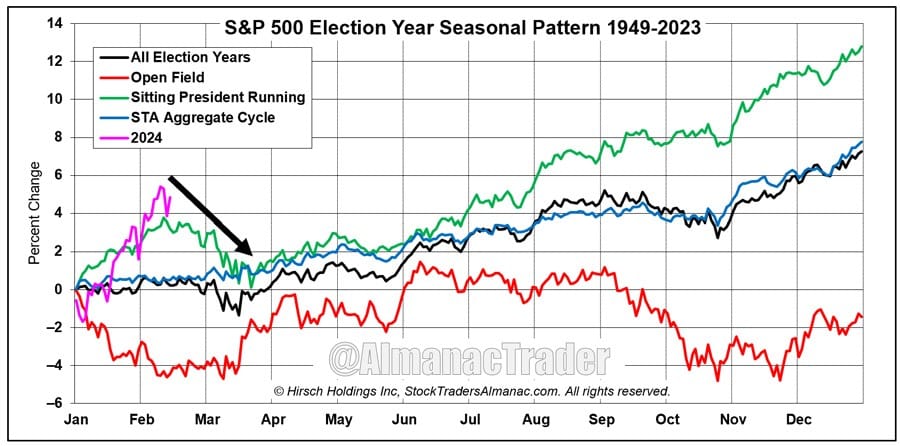
While the last half of February tends to be weak, the summer months also pose a threat heading into the election. This is because Wall Street tends to reduce risk over uncertainty of the outcome and post-election policies. Such could be a more significant issue this year, given the potential candidates;
As we will discuss, the bullish trend remains firmly intact. However, we must also be aware that a correction or consolidation is needed if this bull market continues to increase.
Need Help With Your Investing Strategy?
Are you looking for complete financial, insurance, and estate planning? Need a risk-managed portfolio management strategy to grow and protect your savings? Whatever your needs are, we are here to help.

Bull Trend Remains Intact
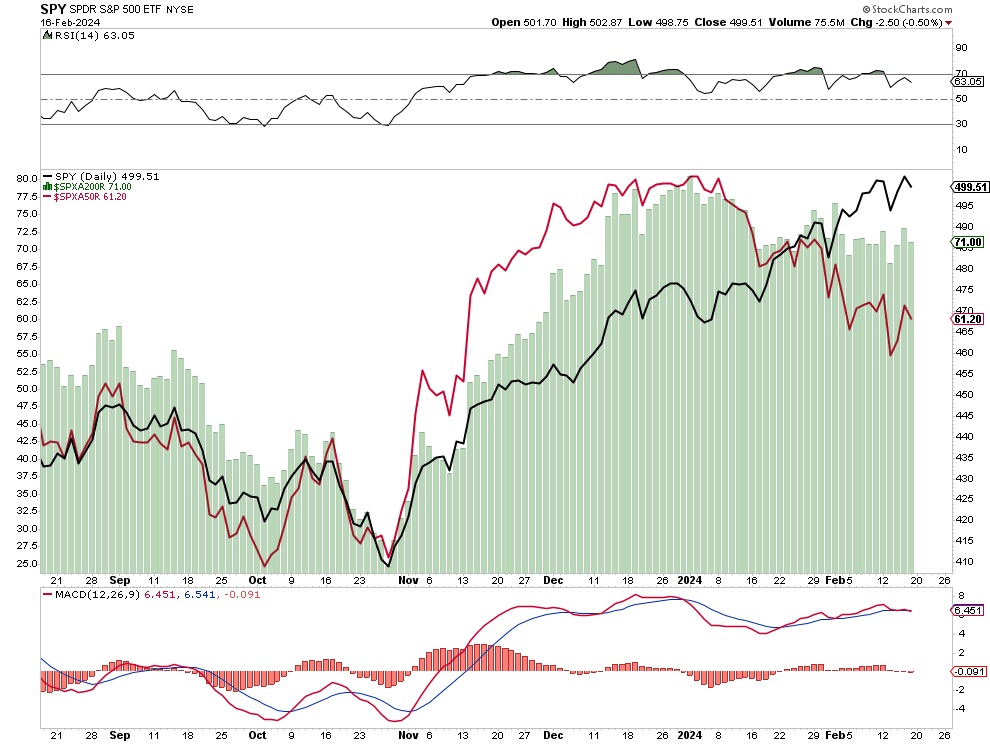
On Wednesday, the market tanked following a much hotter-than-expected inflation report. Immediately, the markets begin repricing the Fed’s expected rate cuts this year. However, by the end of the day, the market recovered as it became more apparent there were some incongruencies in the report, which we will discuss next. The end-of-the-day bounce was notable as the market retested and held the 20-DMA, keeping the bull trend intact.
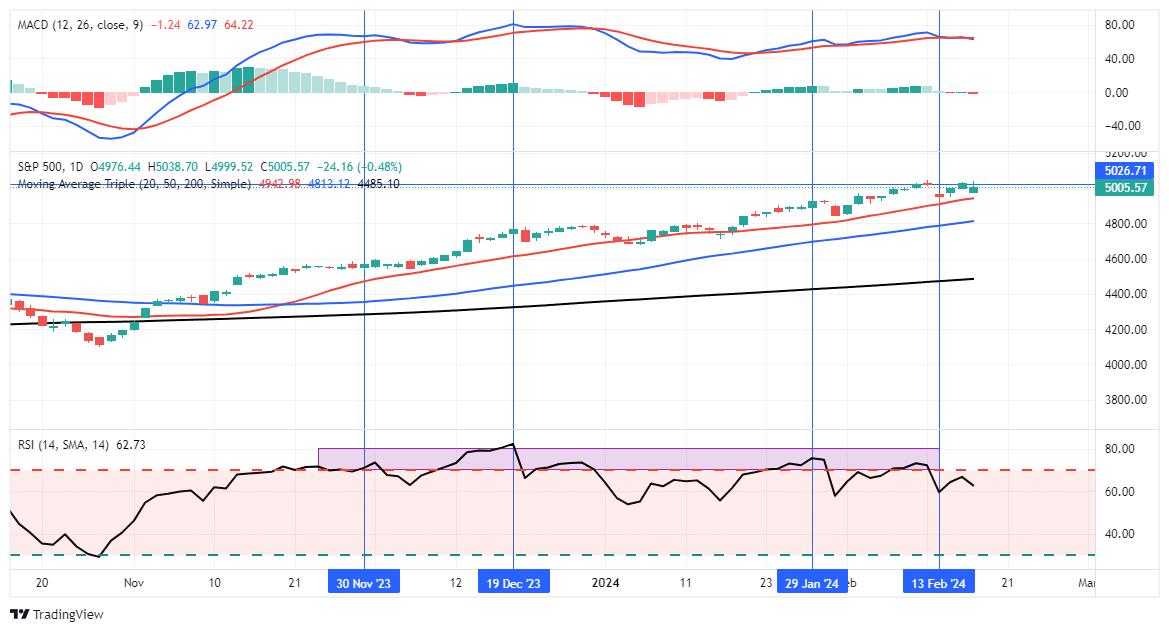
However, while the market held support, the internal deterioration continued. As we discussed last week, the breadth of the market remains weak, with an increasing number of stocks trading below their respective 50 and 200-DMA. With the markets very overbought, that negative divergence, as shown, is a risk we continue to monitor closely.
Another “breadth indicator” we measure is the number of stocks on bullish “buy” signals. That index peaked at 80.20, about where the market peaked in July 2023. Currently, the bullish percent index has fallen while stocks continue to advance. As with all breadth or momentum-based indicators, when there is a “negative divergence” between the indicator and the market, it is usually a prudent time to become more cautious concerning risk-based exposure.
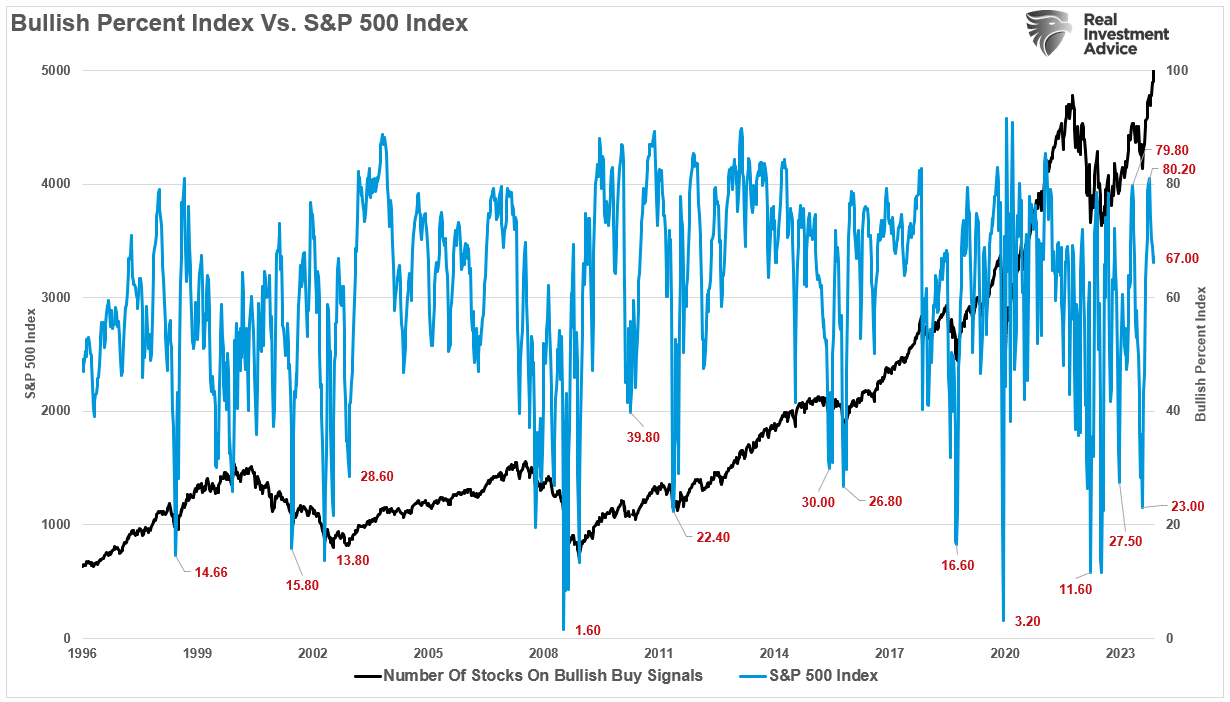
With the market still very overbought on many levels, these indicators are just “warning signs” we pay attention to. As discussed in “Divergences And Other Technical Warnings,” this is NOT an alarm bell.
“Regarding speculative bull markets, as noted above, the “this is nuts” part can remain “nuts” for much longer than you think. Therefore, given that we have to generate returns for our clients or suffer career risk, we must be careful not to exit the markets too early…or too late.
Therefore, regardless of your personal views, the bull market that started in October remains intact. The speculative frenzy is still present. As such, we are reducing equity exposure modestly and rebalancing risk by following our basic procedures.”
As we concluded in that missive, I could be wrong, and a more severe market correction could be underway. If we are, we will continue to reduce equity exposure as needed. But for now, the bull trend remains intact, investor sentiment remains bullish, and momentum is strong. When that changes, and it will, we will become more defensive.
Now, about that inflation report.
The Inflation Report Was Not What It Seemed
The latest employment report sent the market into spasms as it was much stronger than expected.
- Core Inflation m/m was 0.4% vs forecast of 0.3%
- Core inflation y/y was 3.9% vs forecast of 3.7%
- Headline inflation m/m was 0.4% vs forecast of 0.2%
- Headline inflation y/y was 3.4% vs forecast of 3.1%
The table below breaks down CPI into its eight major components with the annual rate of change in each category over the last 5-months.
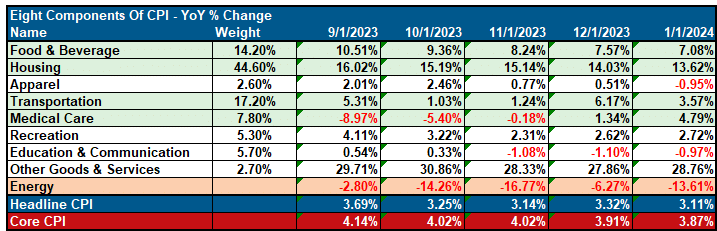
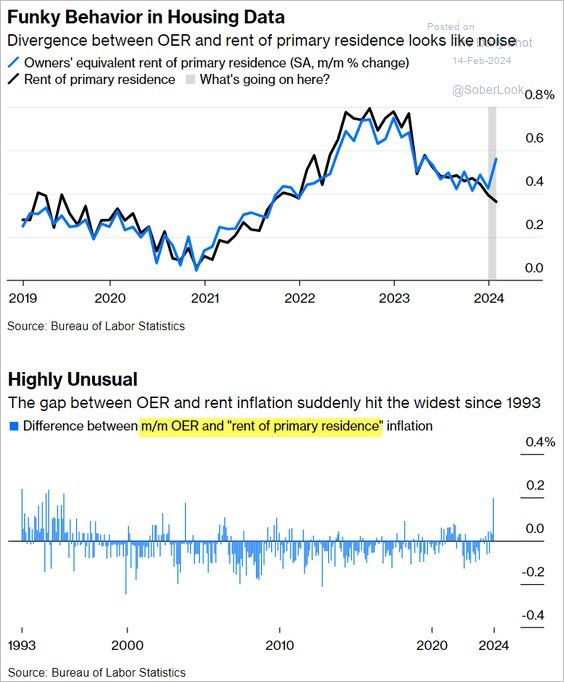
The most significant contributor to CPI is shelter costs, accounting for over a third of the index calculation. That input rose unexpectedly by 0.2% to .06% for the month. Notably, that component lags real-time housing/rent data by at least six months. While actual rent prices fell, the imputed rent increased based on a survey. As shown in the chart below, that divergence is quite significant and the widest since 1993 and will most likely be revised downward over the next few months.
While the shelter divergence was the most significant driver of hotter inflation in January, there were other factors. Per Goldman Sachs:
The increase largely reflected start-of-year price increases for labor-reliant categories such as medical services, car insurance and repair, and daycare, and we assume inflation in these categories returns to the previous trend on net in February and March.
3-Measures Of Inflation
To wit, auto insurance rose 20.6%, the largest increase since 1976. Nonprescription drugs increased by 9.2%, its largest gain ever. Lastly, the repair of household items grew by 18.2%, also the largest ever. However, they are all much smaller inputs relative to overall inflation. As shown, the trend is still lower when we look at various measures of CPI.
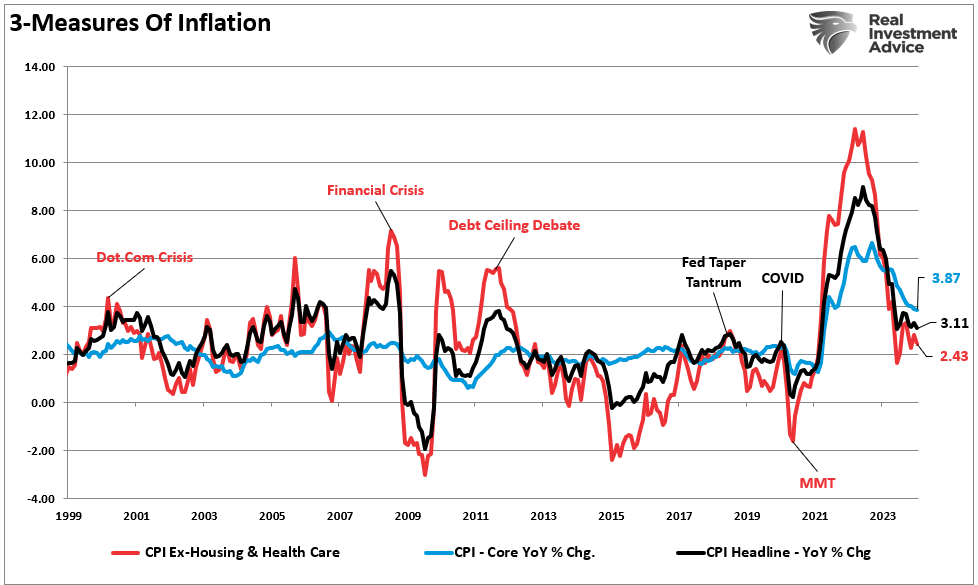
We look at CPI Less Healthcare and Shelter because it provides a better look at what impacts households month-to-month. For most, Shelter and Healthcare are fixed expenses for a contractual period. As such, everything else in price declined to a 2.43% annual rate last month, easing pressure on households.
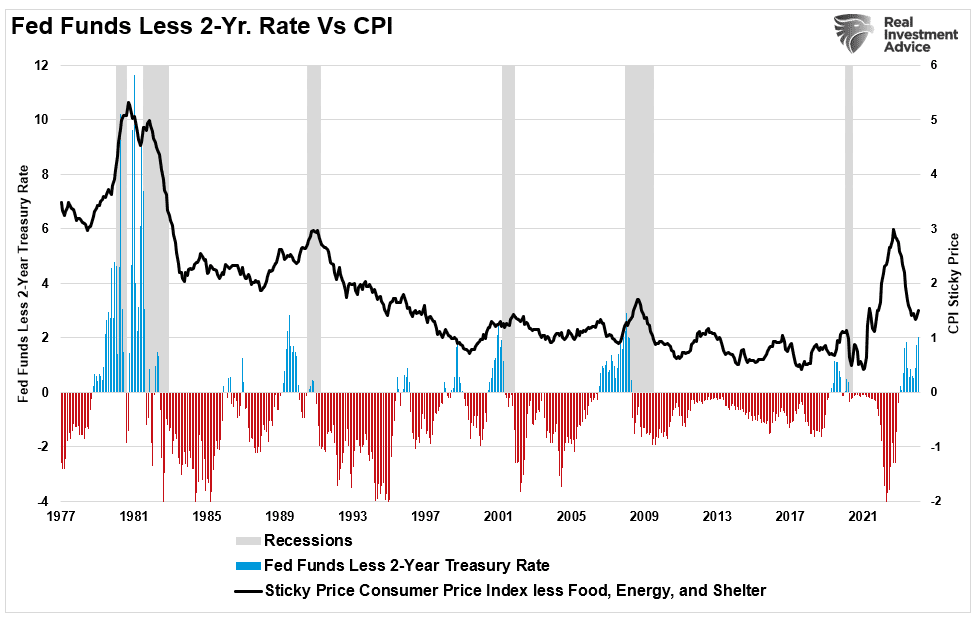
Stocks and bonds sold off significantly on the news as it implied that the Fed would stay on hold for longer. The Fed Funds market now thinks the first rate cut will be in July. Historically, when the Fed funds rate was significantly above the 2-year Treasury rate, and inflation was elevated, there were significant rate cuts following as inflation fell. Of course, these reversions were also coincident with a recession. That is something the current bull trend in stocks is not factoring in.
As noted, the factors that pushed CPI higher than expectations appear to be seasonal and temporary issues. While inflation rates may stay sticky for a while, we still think the overall direction of inflation will be lower. If the Fed remains on hold, that should help the overall inflation picture as tighter monetary constraints slow economic growth.
And that brings us to why bonds are back to attractive levels again.
Bonds Look Attractive Again
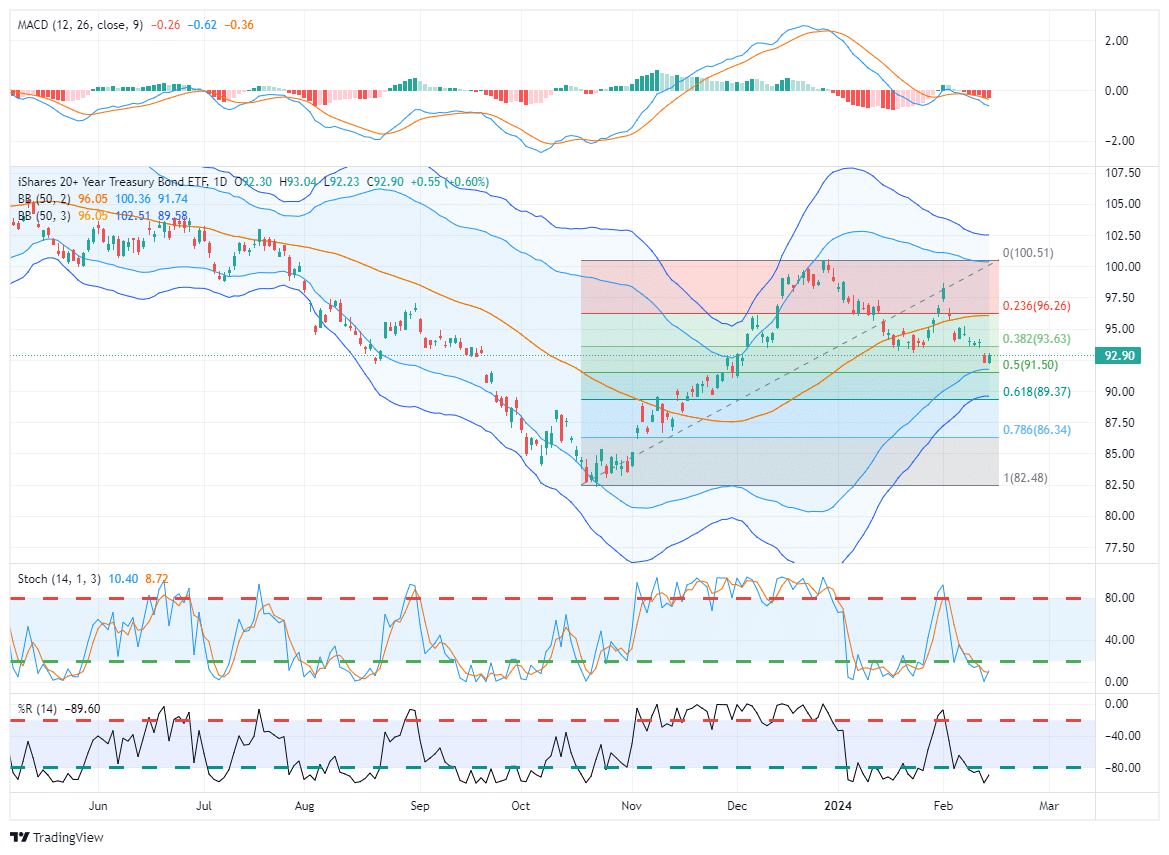
In 2023, I discussed that I was adding to my bond holdings as yields rose. Such was to both lock in higher yields and lower prices. Beginning in November, yields dropped sharply and became overbought short-term. From a technical perspective, the setup for bonds, over the long term, remains very compelling. The recent pullback reversed the previous overbought condition and retraced 50% of the previous gain.
While the technical setup for bonds is bullish, there are two fundamental reasons why the bull trend in bonds will likely continue.
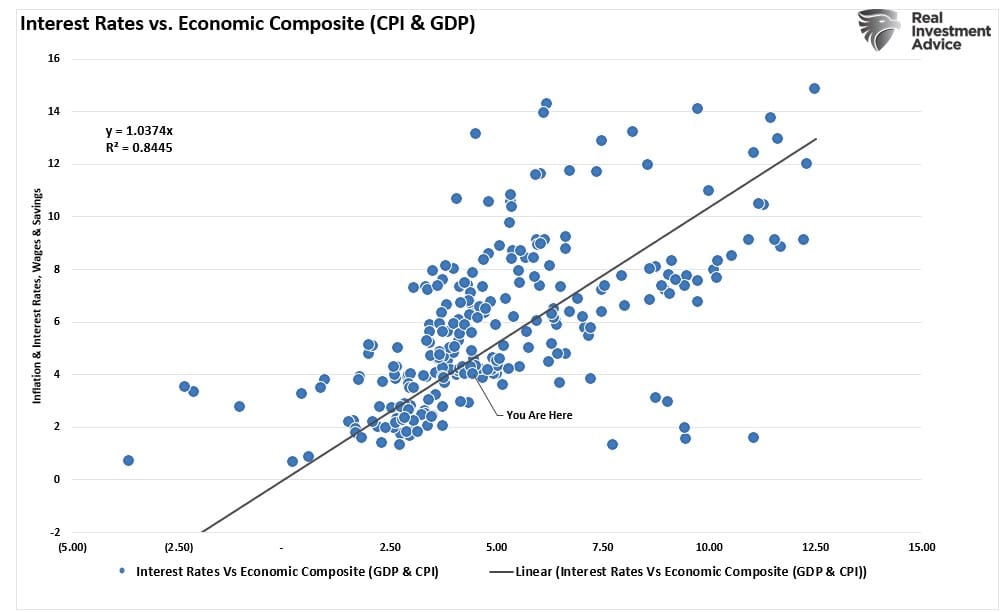
First, the relationship between interest rates, inflation, and economic growth suggests lower rates. If inflation and economic growth are going to slow, as the Federal Reserve wants, then yields will follow. The composite index below shows a long historical relationship.
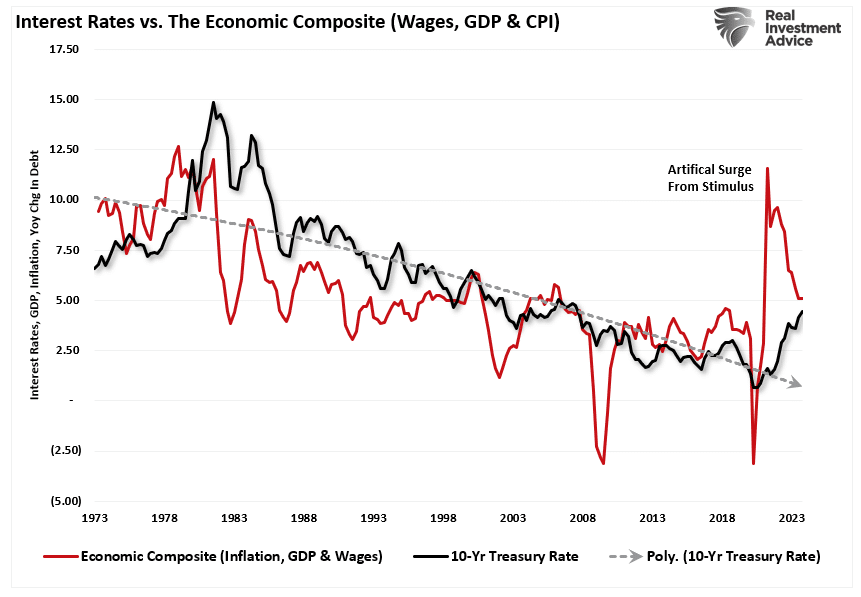
The reason is that bond yields reflect economic activity. As we explained previously:
“Bond investors have a fixed rate of return. Therefore, the fixed return rate is tied to forward expectations. Otherwise, capital is damaged due to inflation and lost opportunity costs.“
That is why there is such a high correlation between interest rates, economic growth, and inflation.
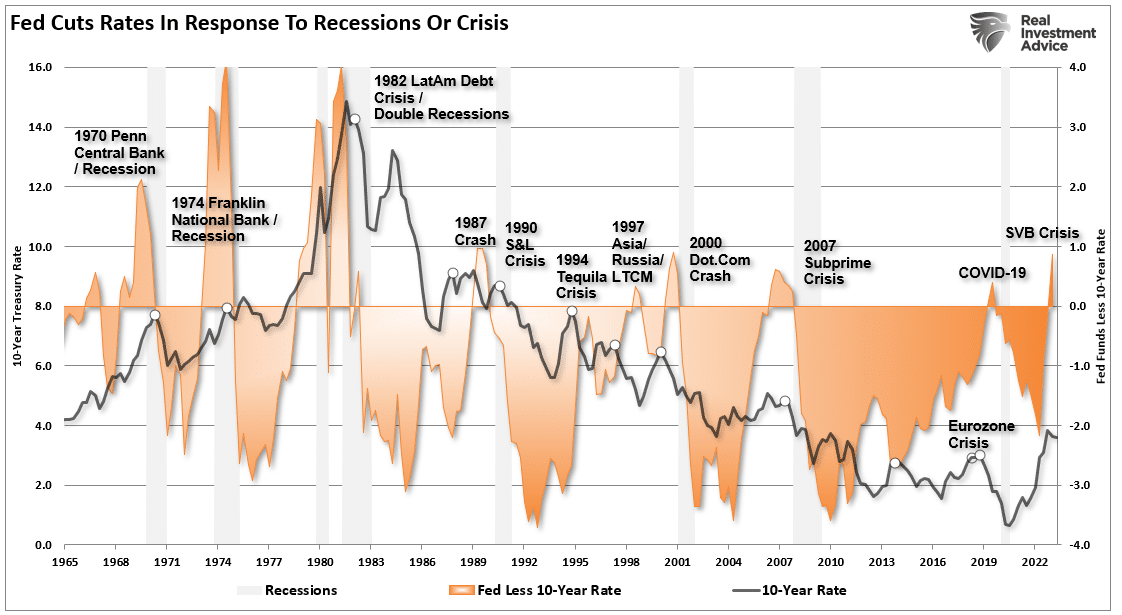
Furthermore, if the Federal Reserve cuts rates, it is likely trying to offset weaker economic growth and inflation rates or contain some financial risk. As shown, whenever the Fed funds rate was above the 10-year rate, financial and economic events led to a rapid reversal in Fed policy and lower interest rates.
Over the last couple of weeks, I have discussed bonds and why the many concerns of higher, sustained interest rates are not likely. I hope this week’s newsletter better clarifies why I am willing to place a longer-term bet on that outcome.
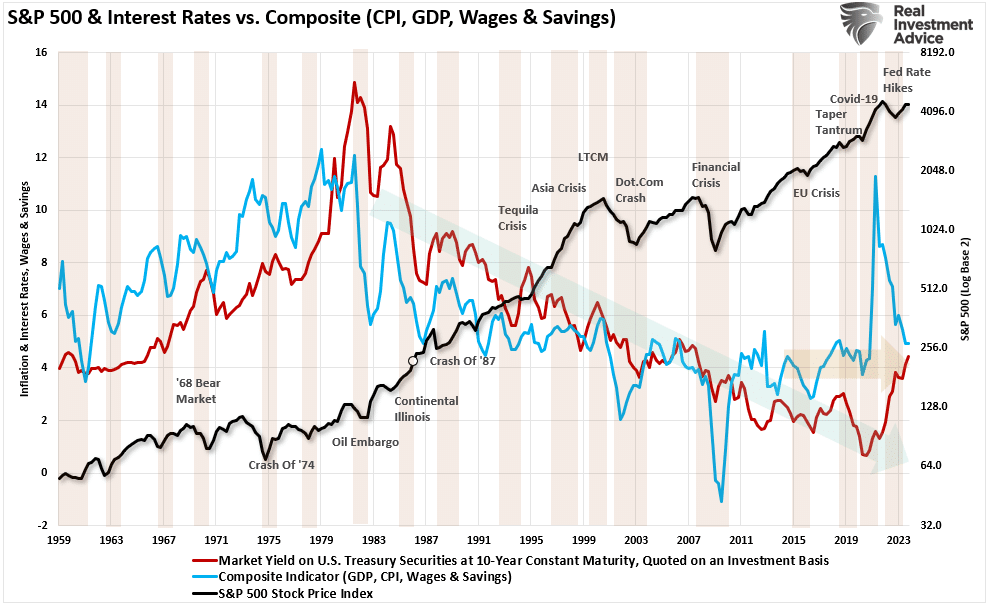
Also, if you didn’t make the connection, a reversion in interest rates is not great for currently overvalued stocks.
How We Are Trading It
As noted last week:
“What causes the market to break its bullish trajectory is entirely unknown. The 10% correction last year didn’t have an overwhelming catalyst other than just disappointment the Federal Reserve might keep rates “higher for longer” than Wall Street wanted. That disappointment could be the Fed not cutting rates fast enough this year.
Whatever trigger causes a reversal in the bullish signals, we will act accordingly to reduce risk and rebalance exposures. But one thing is certain: investor sentiment is extremely bullish, which has almost always been a good “bearish signal” to be more cautious.”
While we have warned of a potential correction over the past couple of weeks, it reminds us much of June and July last year, where similar warnings for a 10% correction went unheeded. As such, we rebalanced exposures on Monday by taking profits in some positions with significant gains for the year and adding to current positions where we are underweight. We will likely do this again next week if the bull trend continues. We are now seeing many individuals “jumping into the pool” in some of the most speculative areas of the market. Such is usually a sign we are closer to a market peak than not. As such, we want to make adjustments before the correction comes.
While it is not time to be overly bearish, continue basic portfolio management rules to reduce risks.
- Trim Winning Positions back to their original portfolio weightings. (ie. Take profits)
- Sell Those Positions That Aren’t Working. If they don’t rally with the market during a bounce, they will decline when it sells off again.
- Move Trailing Stop Losses Up to new levels.
- Review Your Portfolio Allocation Relative To Your Risk Tolerance. If you have an aggressive allocation to equities, consider raising cash levels and increasing fixed income accordingly to reduce relative market exposure.
Have a great week.
Research Report

Subscribe To “Before The Bell” For Daily Trading Updates
We have set up a separate channel JUST for our short daily market updates. Please subscribe to THIS CHANNEL to receive daily notifications before the market opens.
Click Here And Then Click The SUBSCRIBE Button
Subscribe To Our YouTube Channel To Get Notified Of All Our Videos
Bull Bear Report Market Statistics & Screens

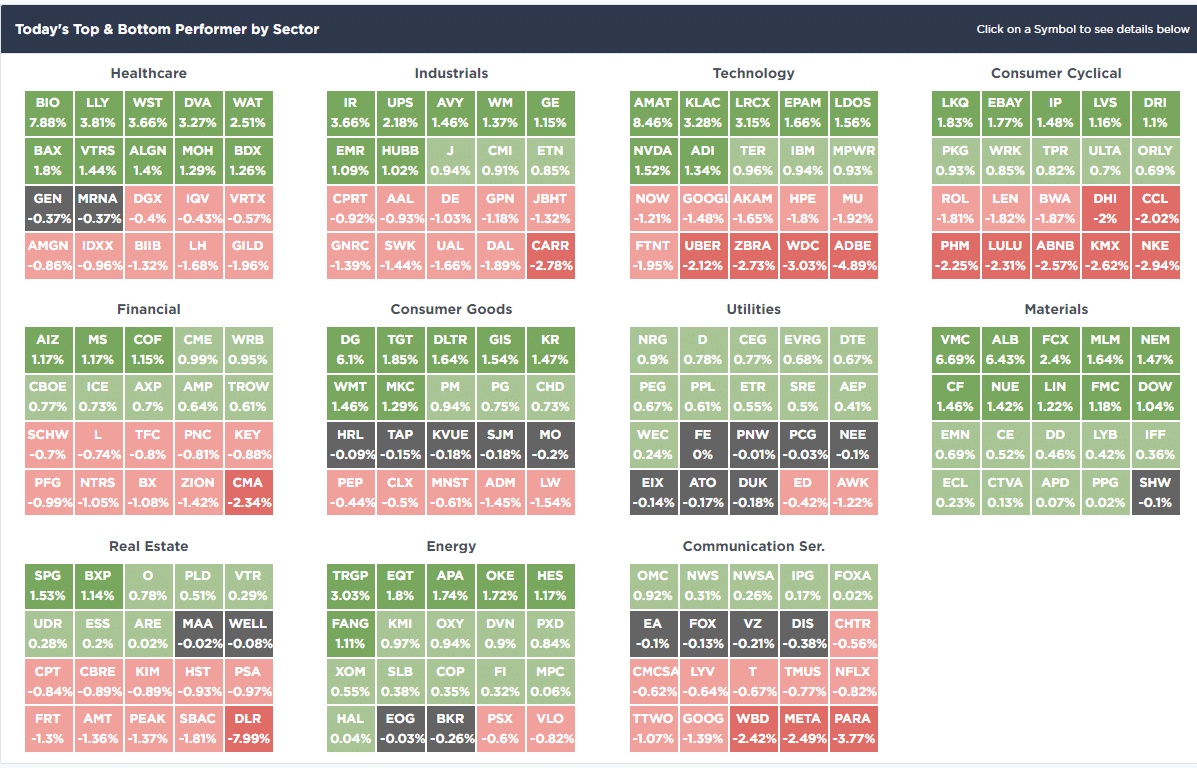
SimpleVisor Top & Bottom Performers By Sector
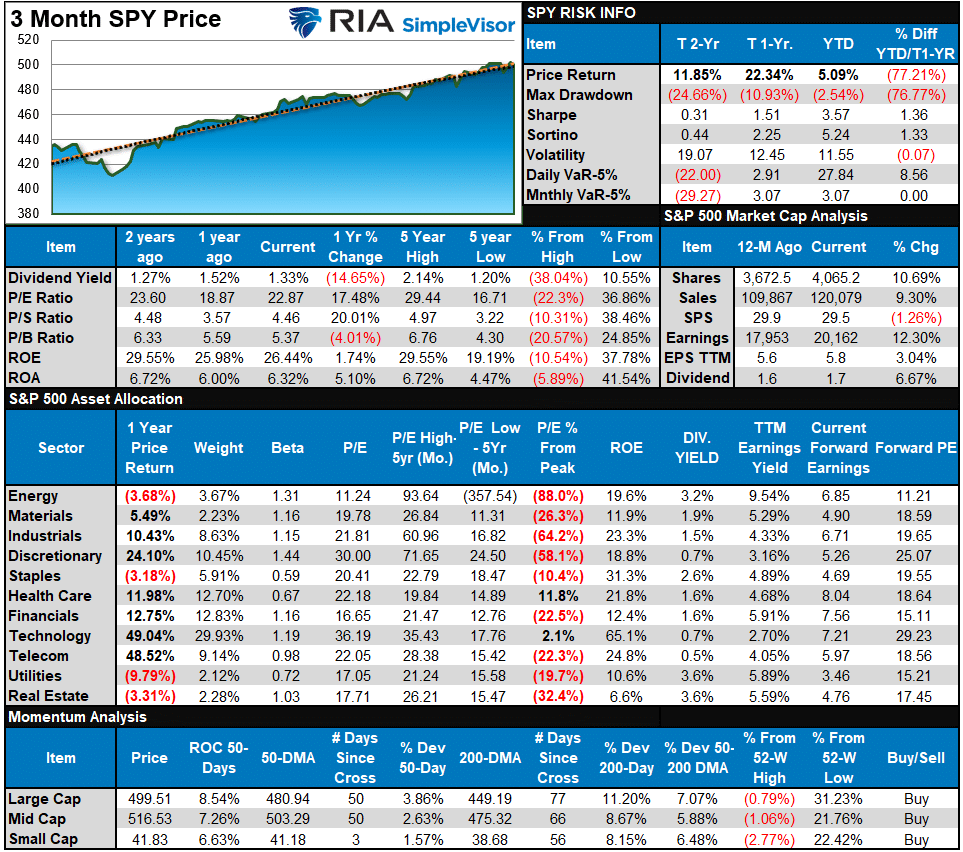
S&P 500 Weekly Tear Sheet
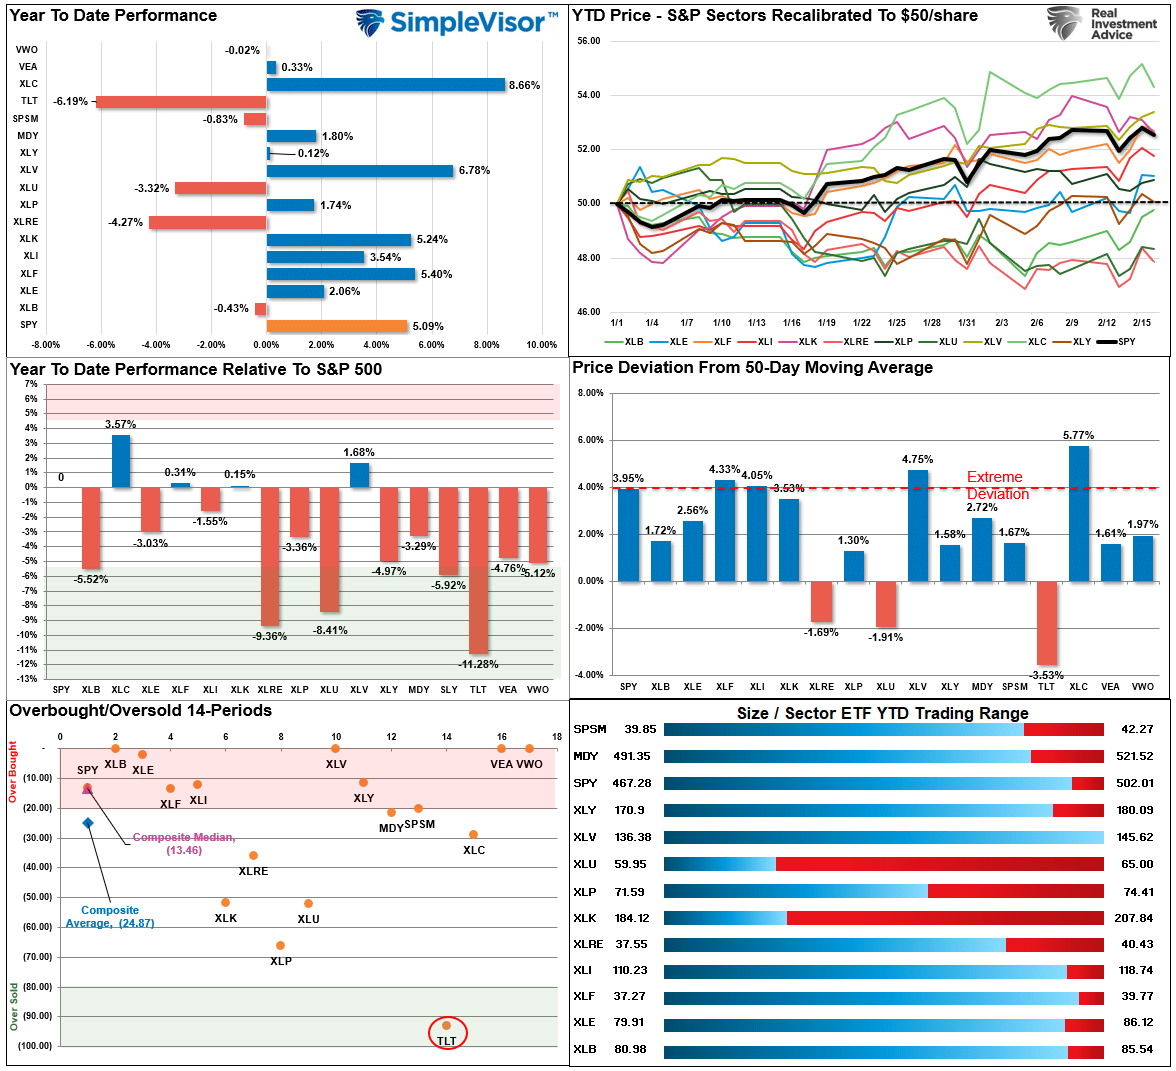
Relative Performance Analysis
The bull trend in stocks remained uninterrupted this past week. While the market did sell off on inflation reports, it did not violate the 20-DMA. The good news is that more sectors and markets are now beginning to join the broad market, with the exception of bonds, which are deeply oversold. The rotation from the mega-cap names to industrials, materials, small and midcap stocks, and financials will continue to support the bull trend in stocks for now. However, with the market extending above its 200-DMA, we continue to suggest some caution in the near term and use pullbacks to support levels to increase equity risk.
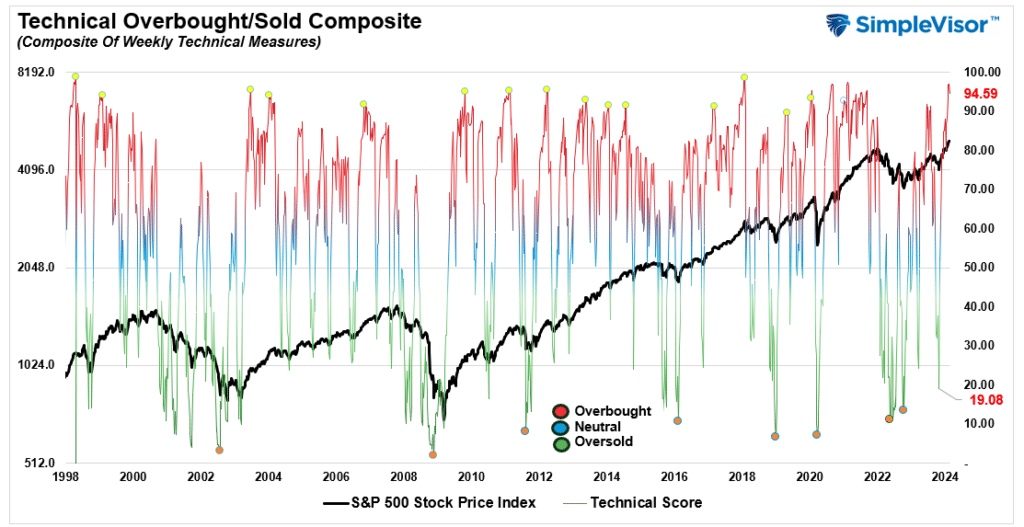
Technical Composite
The technical overbought/sold gauge comprises several price indicators (R.S.I., Williams %R, etc.), measured using “weekly” closing price data. Readings above “80” are considered overbought, and below “20” are oversold. The market peaks when those readings are 80 or above, suggesting prudent profit-taking and risk management. The best buying opportunities exist when those readings are 20 or below.
The current reading is 94.59 out of a possible 100.
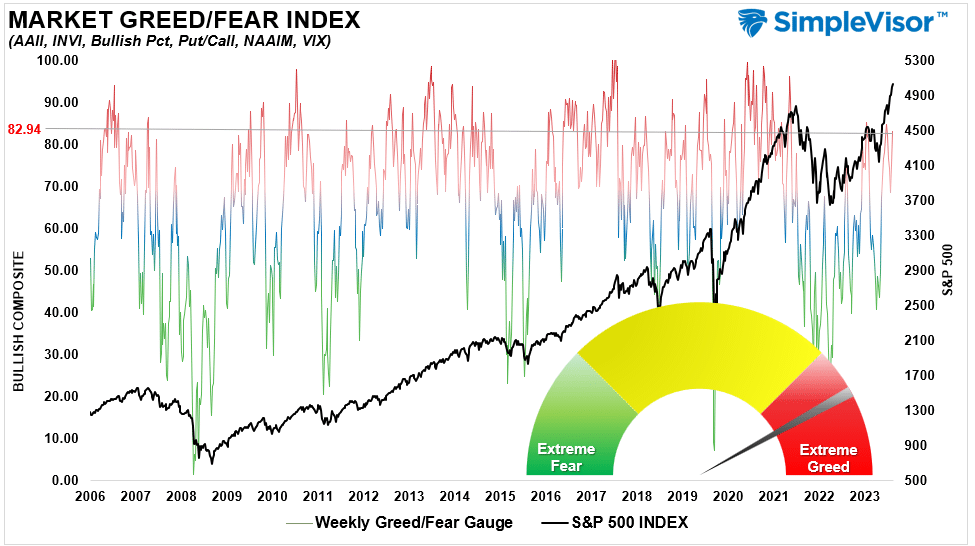
Portfolio Positioning “Fear / Greed” Gauge
The “Fear/Greed” gauge is how individual and professional investors are “positioning” themselves in the market based on their equity exposure. From a contrarian position, the higher the allocation to equities, the more likely the market is closer to a correction than not. The gauge uses weekly closing data.
NOTE: The Fear/Greed Index measures risk from 0 to 100. It is a rarity that it reaches levels above 90. The current reading is 82.94 out of a possible 100.
Relative Sector Analysis
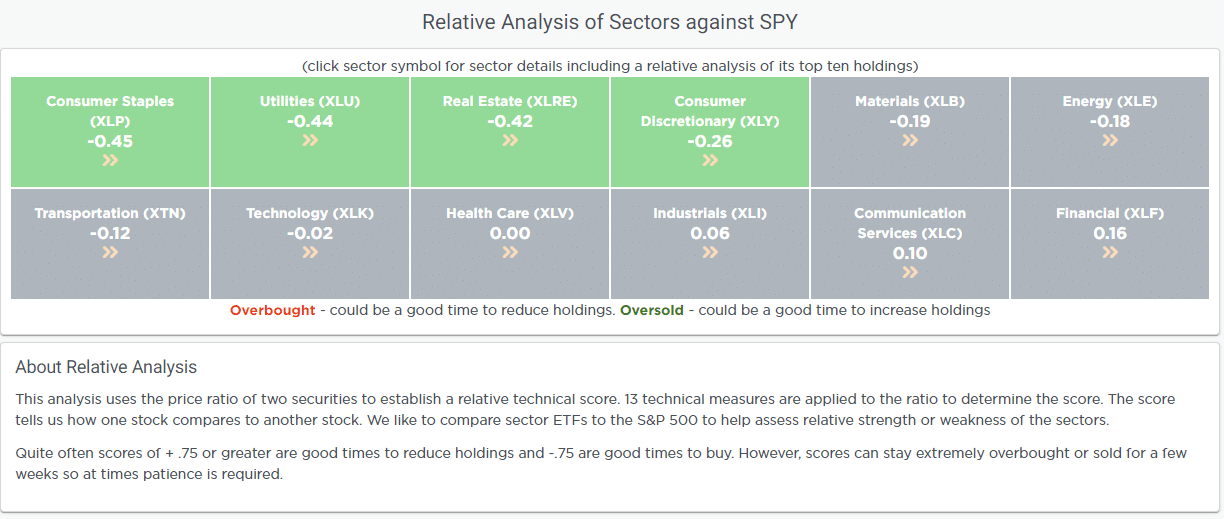
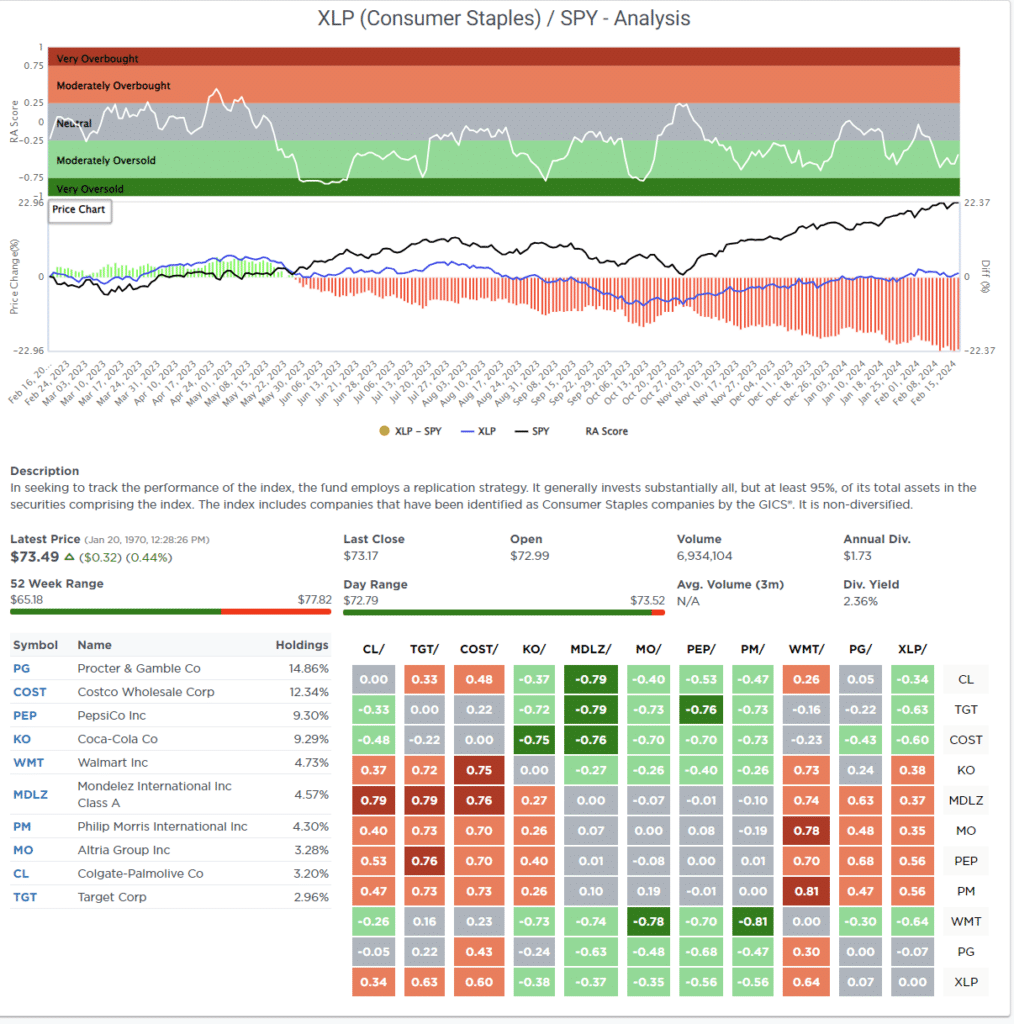
Most Oversold Sector Analysis
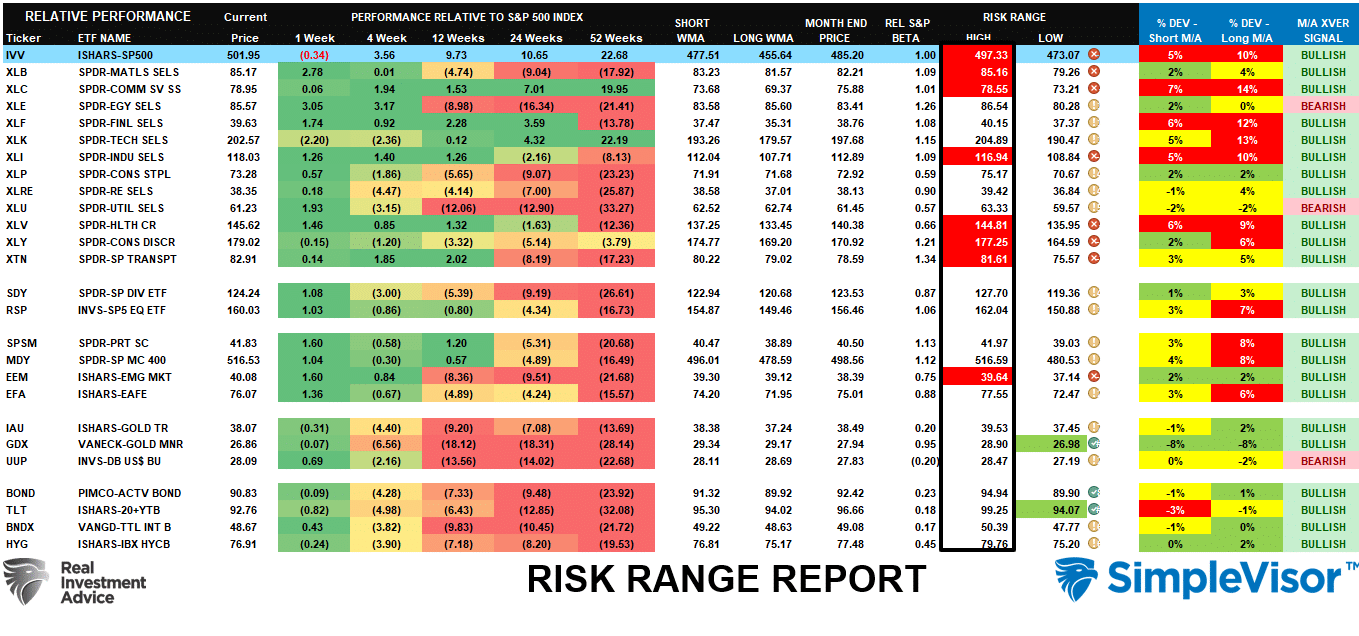
Sector Model Analysis & Risk Ranges
How To Read This Table
- The table compares the relative performance of each sector and market to the S&P 500 index.
- “MA XVER” (Moving Average Crossover) is determined by the short-term weekly moving average crossing positively or negatively with the long-term weekly moving average.
- The risk range is a function of the month-end closing price and the “beta” of the sector or market. (Ranges reset on the 1st of each month)
- The table shows the price deviation above and below the weekly moving averages.
As noted last week:
“The deviations of those leading sectors are becoming significantly deviated from their long-term moving averages. The last time we saw double-digit deviations like this was heading into 2022. However, most sectors and markets have bullish trends with moving-average crossovers. Such suggests higher prices for now, but realize that eventually this will reverse.”
The bullish momentum continued this past week, with the market holding above the 20-DMA. While the market did pull back on Wednesday and Friday, it did little to reverse the market trading well outside its normal risk range. Such was again a function of the mega-capitalization stocks, which are also well outside their ranges and deviated above long-term moving averages. Basic Materials, Industrials, Utilities, Healthcare Transportation, and Emerging Markets joined the fray last week. As noted, the bull trend is on firm footing, but short-term corrections should be expected.
Weekly SimpleVisor Stock Screens
We provide three stock screens each week from SimpleVisor.
This week, we are searching for the Top 20:
- Relative Strength Stocks
- Momentum Stocks
- Fundamental & Technical Strength W/ Dividends
(Click Images To Enlarge)
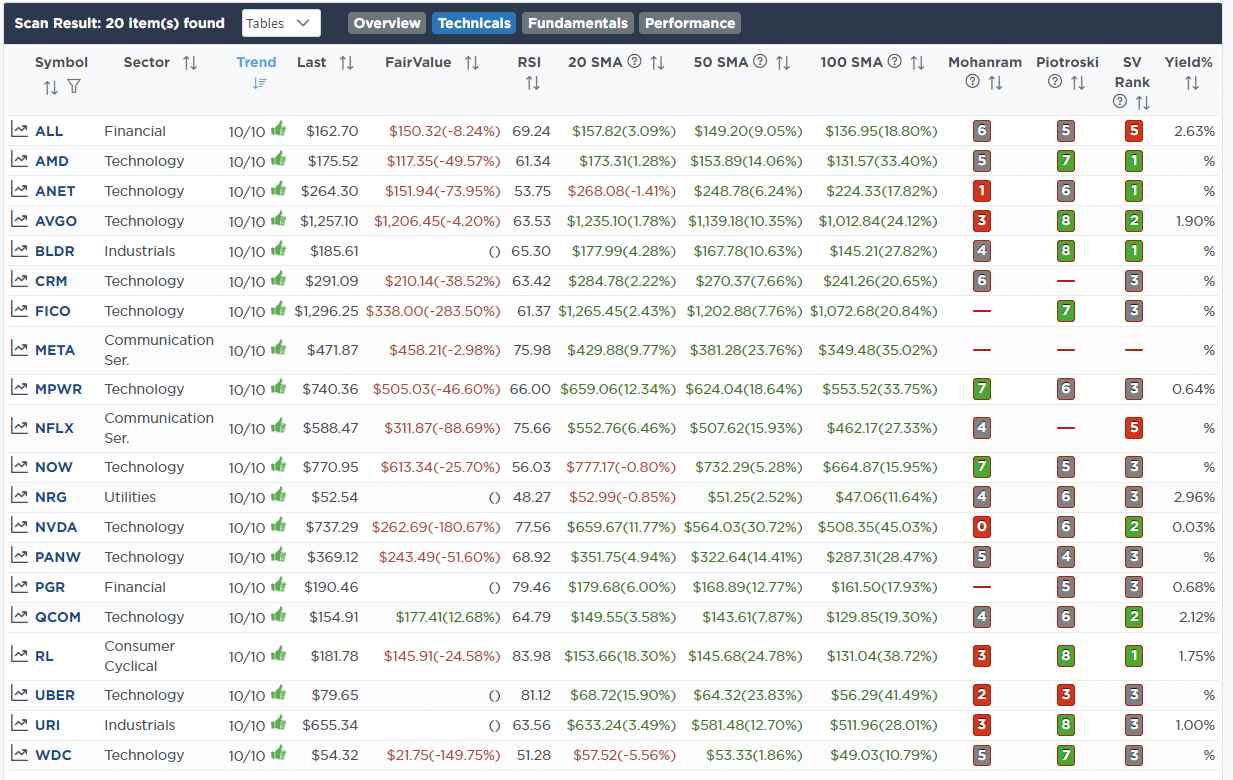
R.S.I. Screen
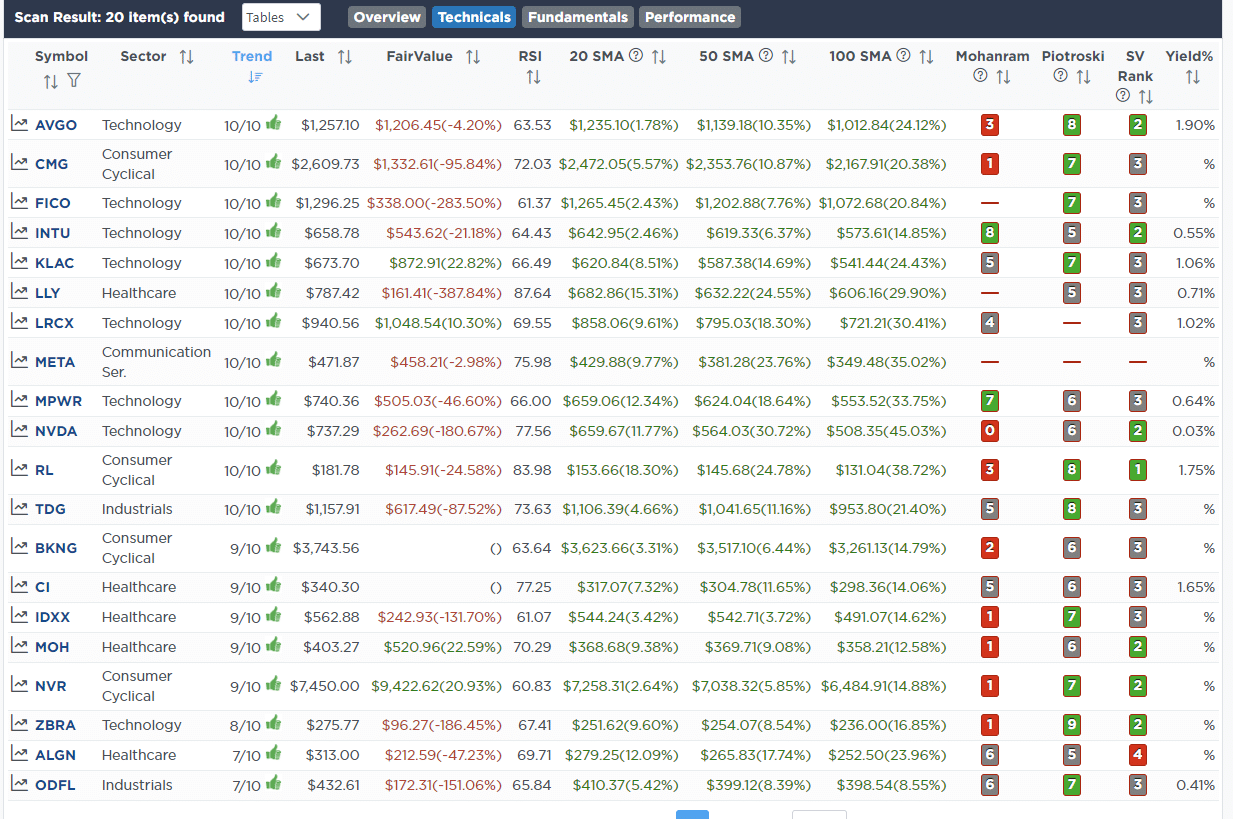
Momentum Screen
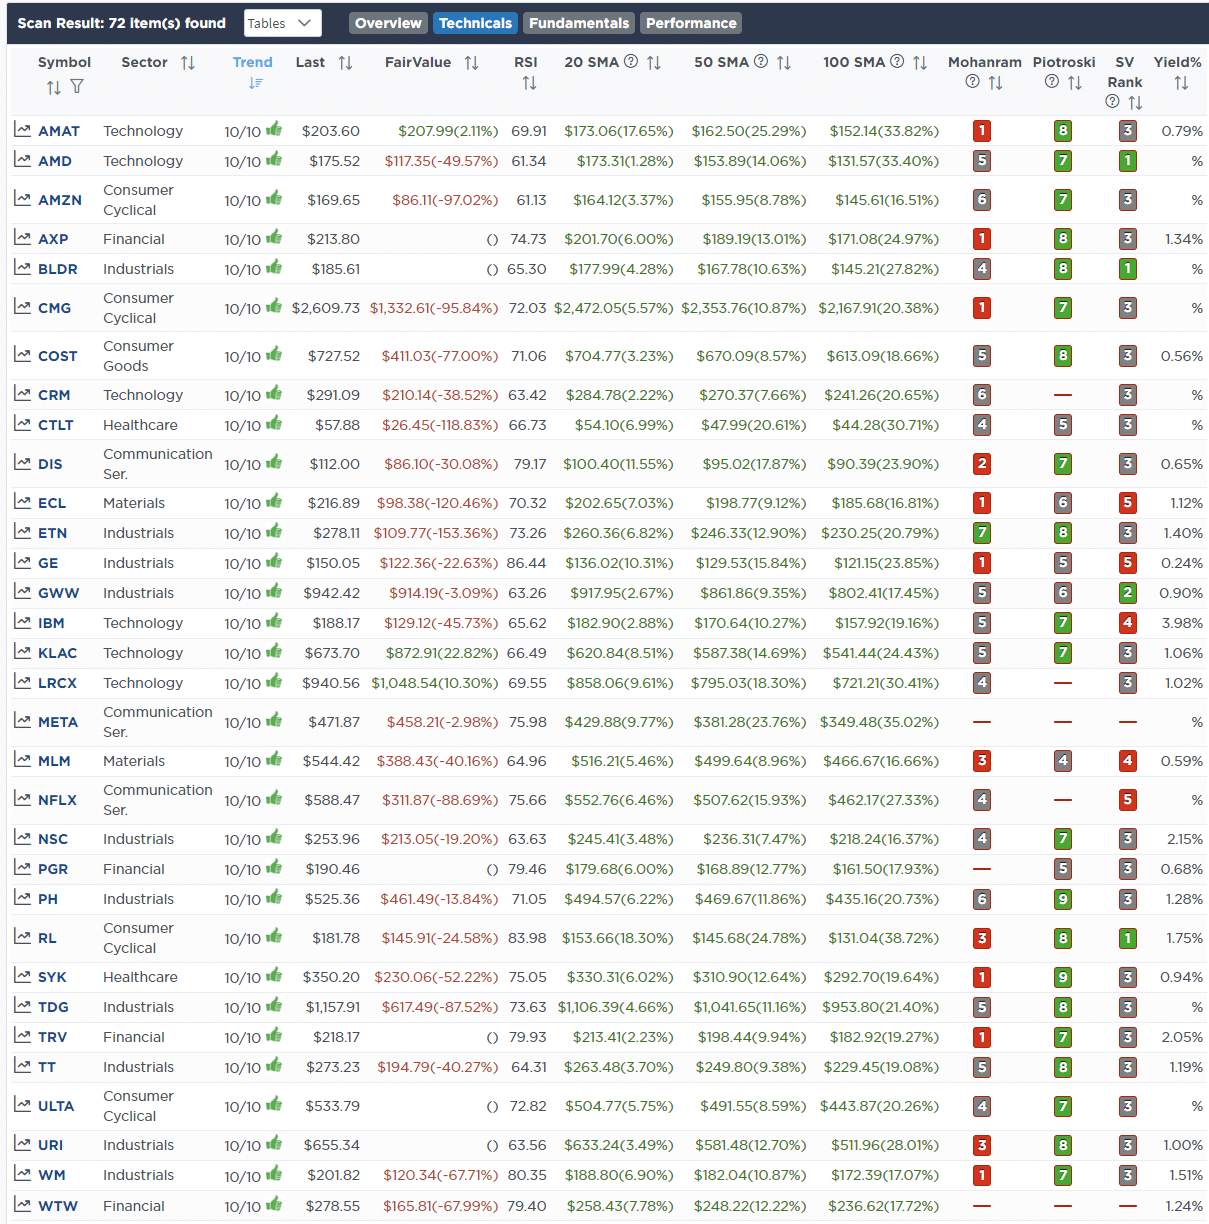
Fundamental & Technical Strength
SimpleVisor Portfolio Changes
We post all of our portfolio changes as they occur at SimpleVisor:
Feb 12th
“As discussed in this past weekend’s newsletter, sentiment is getting extremely bullish, and markets are overbought and extended. We are due for a short-term correction or consolidation, with the market up 14 of the last 15 weeks. As we wrote:
“While we have warned of a potential correction over the past couple of weeks, it reminds us much of June and July last year, where similar warnings for a 10% correction went unheeded. As such, we will rebalance exposures next week by taking profits in some positions with significant gains for the year and adding to current positions where we are underweight. We suspect the current environment is much the same as 2022, and the bullish rally will go further to suck the last of the holdouts in. However, we want to make adjustments before the correction comes.”
That is the process we are starting today with the following trades.”
Equity Model
- Take profits and rebalance to the following positions: ABBV, NVDA, MSFT, GOOG, and PG.
- Add to both CMCSA and DUK to bring those positions back to target weights.
ETF Model
- Reduce XLC and XLK back to target weights.

Lance Roberts, C.I.O.
Have a great week!


