
Inside This Week’s Bull Bear Report
- Market Review & Update
- Is “Artificial Intelligence” The New Dot.com
- How We Are Trading It
- Research Report – Monetary Conditions Working Against The Fed
- Youtube – Before The Bell
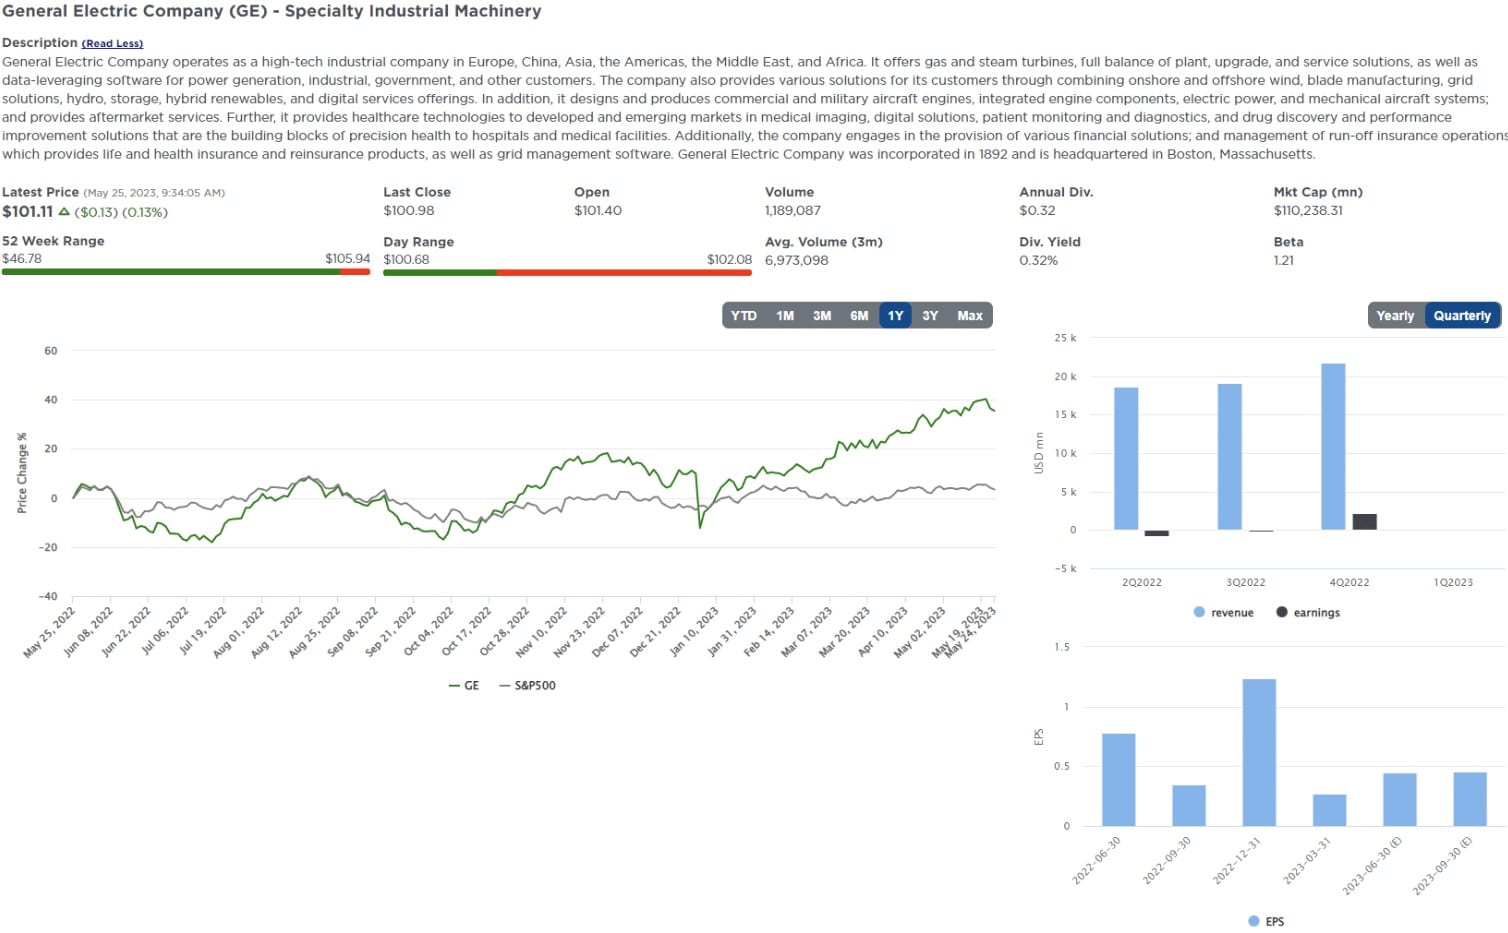
- Stock Of The Week
- Daily Commentary Bits
- Market Statistics
- Stock Screens
- Portfolio Trades This Week
Market Review & Update
You can’t turn on the media or pick up the newspaper without a headline discussing “artificial intelligence.” It is certainly reminiscent of the 1999 “Dot.com” chase if you remember that experience.
However, before we dig into that this week, Friday’s employment report was another upside shocker, with 339,000 jobs created. There is no evidence of a near-term recession, but the robust employment number also pushes out any potential for a Fed rate cut. While such should have been read as a bearish note, stocks rallied sharply out of the gate on Friday, pushing the S&P 500 above its previous resistance level and setting a new high in this rally from the October lows. As noted last week:
“This breakout is very bullish for two reasons. First, the market has completed a 50% retracement of the 2022 decline, which sets the stage for a further advance. Secondly, the breakout confirms the bullish trend that started from the October lows. While many reasons exist to bearish, the market suggests those concerns are misplaced for now.
The next resistance level for the market is the 61.8% Fibonacci retracement level at 4332 which is slightly above the July 2022 high of 4306. A break above those levels, and there is only some minor resistance to fully recovering from the 2022 decline.
The market surge on Friday pushed the market toward that initial target.
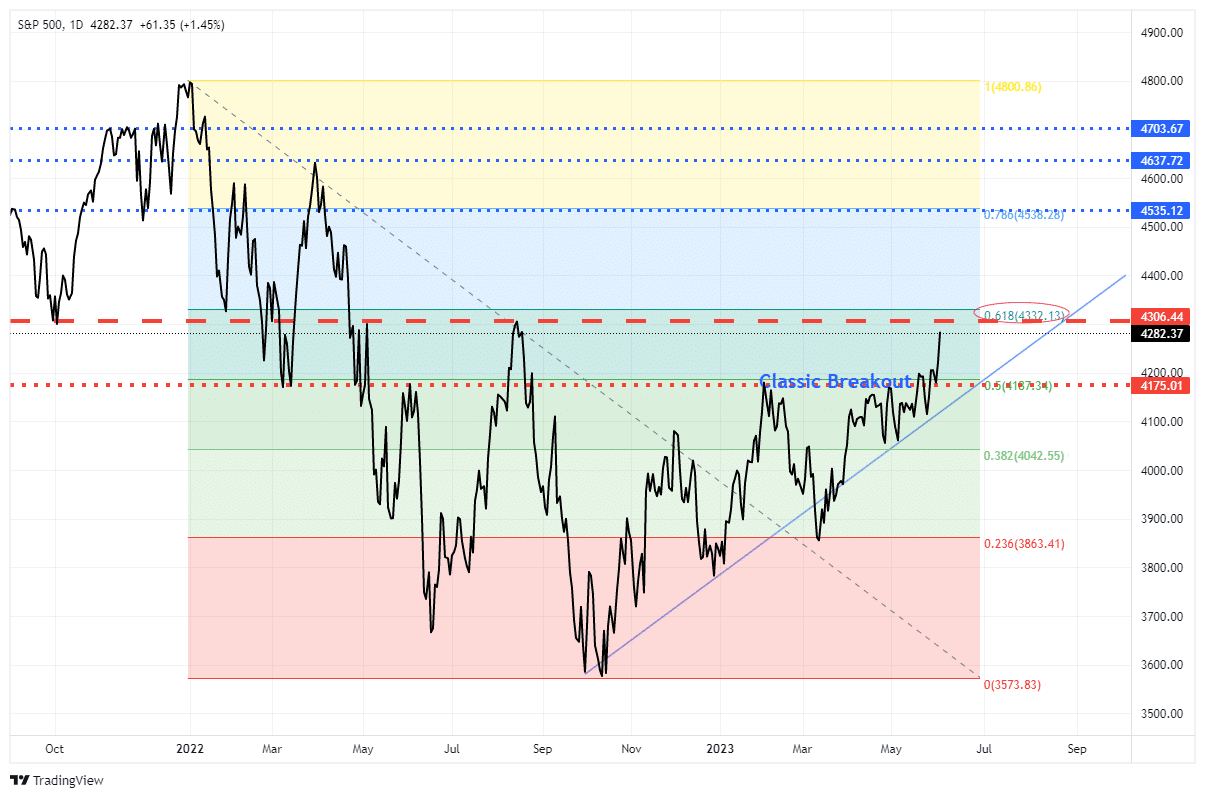
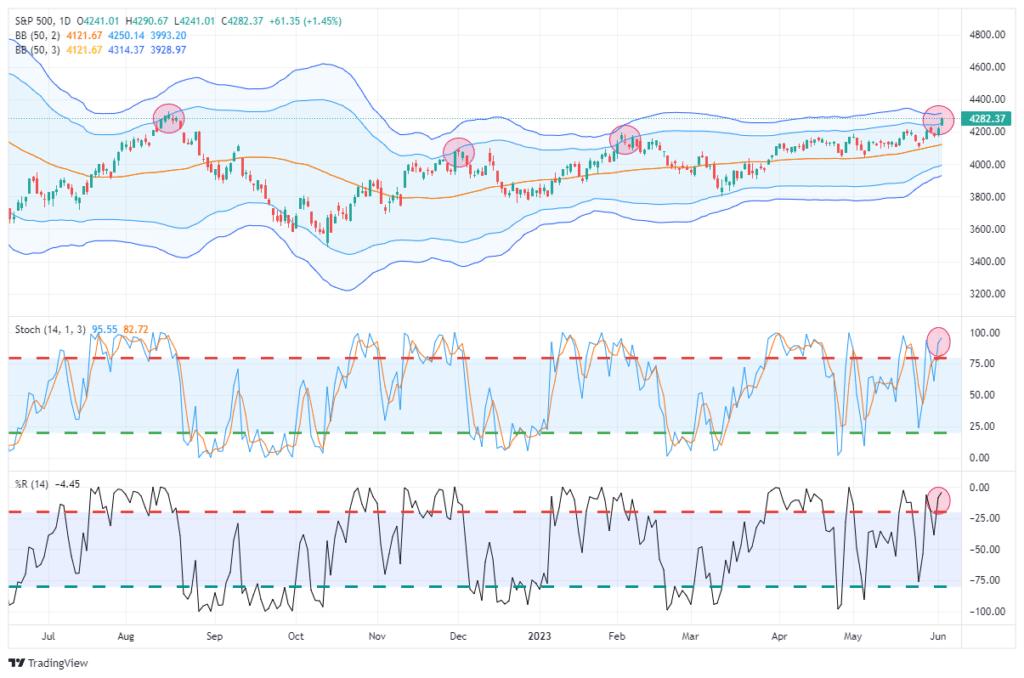
While the market advance is getting technically overbought short-term, as shown below, pullbacks to support should be used to increase exposure accordingly.
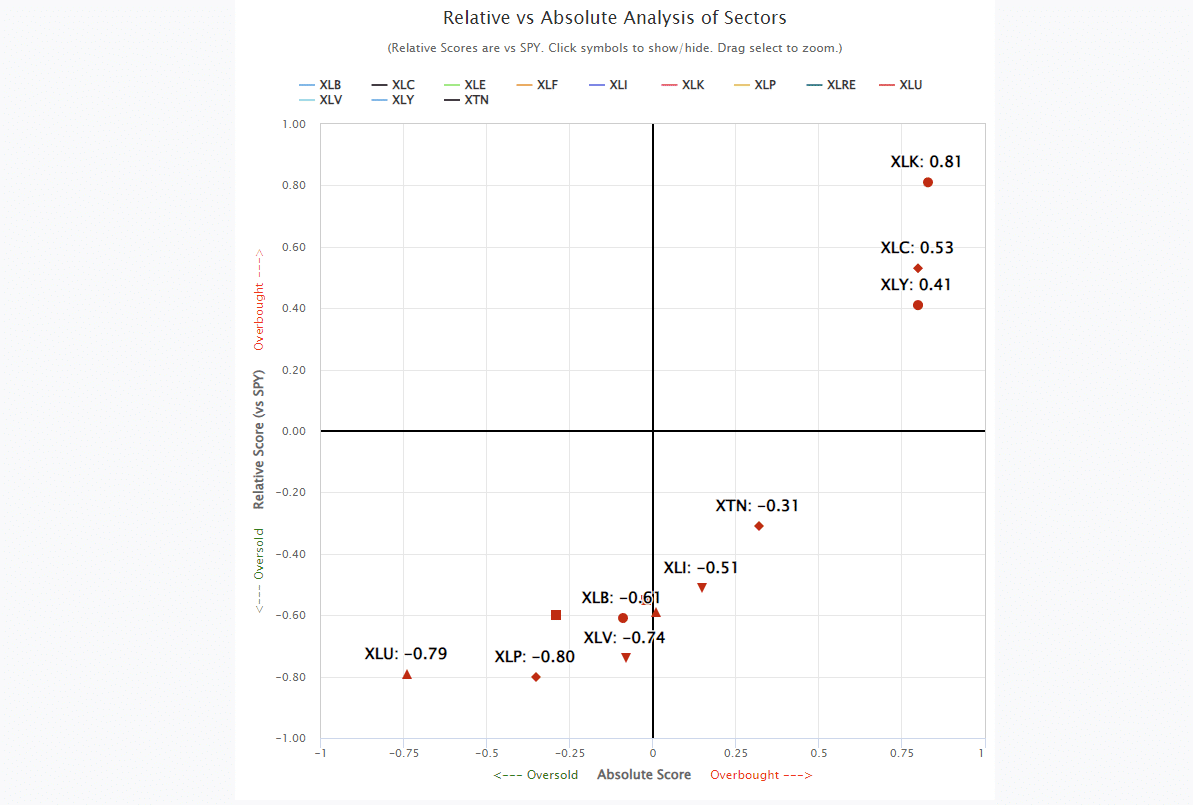
Furthermore, while the market has been chasing technology stocks lately, the market remains bifurcated between the cyclical and defensive sectors. As such, the rotation to Energy, Financials, Materials, and Staples on Friday was not surprising. The question is whether more of that rotation will come near term. Such extreme deviations in performance from the overall index tend not to last indefinitely.
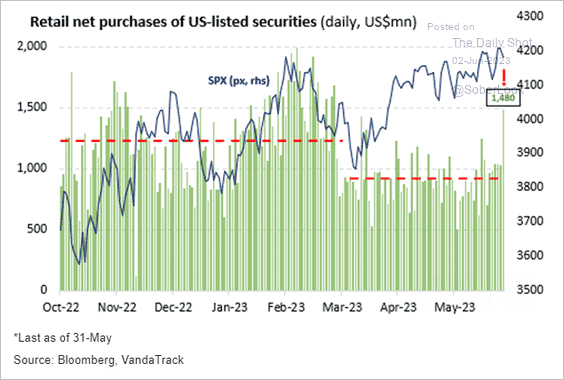
However, the current chase for stocks related to “artificial intelligence” has undoubtedly grabbed everyone’s attention. Retail investors are jumping back into the markets with both feet for the first time since last year.
This brings us to today’s discussion of artificial intelligence and the Dot.com bubble.
Need Help With Your Investing Strategy?
Are you looking for complete financial, insurance, and estate planning? Need a risk-managed portfolio management strategy to grow and protect your savings? Whatever your needs are, we are here to help.

Is “Artificial Intelligence” The New “Dot.Com?”
You can’t turn on a television or pick up a newspaper without a mention of “artificial intelligence.” Most importantly, there is a clear “F.O.M.O.” (Fear Of Missing Out) chase in stocks closely associated with the development and implementation of artificial intelligence.
Moreover, companies also jumped on the bandwagon to make sure they mention “artificial intelligence” in earnings reports and press releases to excite investors. As shown below, the number of mentions of artificial intelligence has soared in recent months.
“Of these companies, 110 cited the term “AI” during their earnings call for the first quarter. This number is well above the 5-year average of 57 and the 10-year average of 34.
In fact, this is the highest number of S&P 500 companies citing “AI” on earnings calls going back to at least 2010 (using current index constituents going back in time). The previous record was 78, which occurred in the prior quarter (Q4 2022).
At the sector level, the Information Technology (38), Industrials (17), and Communication Services (15) sectors have the highest number of S&P 500 companies citing “AI” on Q1 earnings calls, while the Communication Services (75%) and Information Technology (66%) sectors have the highest percentages of companies citing “AI” on Q1 earnings calls.” – FactSet

It is interesting because we saw much the same in 1999 as companies rushed to jump into the “internet boom” that would change the world.

The difference versus today was that companies would advance regardless of actual revenue, earnings, or valuations. It only mattered if they were on the cutting edge of the internet revolution. Today, the companies racing higher on artificial intelligence have actual revenues and income. However, I am sure there will be an explosion of new companies coming to market to jump on the “A.I.” train.
What remains the same is that analysts, and investors, once again believe that “trees can grow to the sky.” The internet craze in 1999 sucked in retail and professionals alike. Then, Jim Cramer published his famous list of “winners” for the decade in March 2000.

Such is unsurprising, as endless possibilities existed of how the internet would change our lives, the workplace, and futures. While the internet did indeed change our world, the reality of valuations and earnings growth eventually collided with the fantasy.
A Voice Of Reason
The artificial intelligence craze is likely no different. In a recent interview on CNBC with Roger McNamee, a Silicon Valley investing legend, he made some salient points (via Herb Greenberg):
- Today’s things they’re calling A.I., particularly the generative A.I.s – these are just B.S. generators, they have no verified content in them, and the results totally unreliable.
- The notion we will apply these to things like searches will result in one lousy outcome after another.
- The guys at OpenAI [the company behind ChatGPT] are trying to create the illusion that their actions are inevitable. Yet there is no way to monetize this other than surveillance capitalism – [monetizing user data] – and we know from social media how much harm that causes.
- What you’re looking at is a battle between the OpenAI guys trying to create this sense of inevitability and the market saying, “Wait, interest rates are now 5%, it costs half a billion dollars in parts [the cost of Nvidia’s A.I. Chips] to do each training session. That’s too high in a 5% interest rate environment when you have a business with no obvious business model.”
- [Using chatbots] You have to do fact-checking on a search engine that defeats the purpose of a search engine. That isn’t progress.
- While A.I. has enormous potential, the trick is you need to change the incentives. Executives who lead these projects are incentivized to protect those who use them and ensure that the content produces accurate results. Until you see those things driving the industry, the products will suck.
His bottom line, however, is the best…
“There are corporations and journalists that have completely bought into this. Before investors buy into this we should just ask: How are you going to get paid? How are you going to get a return on something that is effectively a half million dollars each time you do a training set… in a 5% environment.”
While none of that matters now, as long as prices are going up, these were the same, or at least similar, problems that faced the Dot.com companies.
The F.O.M.O. Chase Is On
As noted, the current boom of “artificial intelligence” stocks is just another in a series of “investment themes” over the market’s long term. As Herb noted in his commentary:
“But if we learned nothing else during the SPACs, the crypto, the meme stocks, and whatever else fueled the market’s last run – you know, the one when stocks were the only place to put your money because rates were so low – it’s that when this stuff reverses, it’s always brutal.”
And, as we noted previously:
“These booms provided great opportunities as the innovations offered great investment opportunities to capitalize on the advances. Each phase led to stellar market returns that lasted a decade or more as investors chased emerging opportunities.”
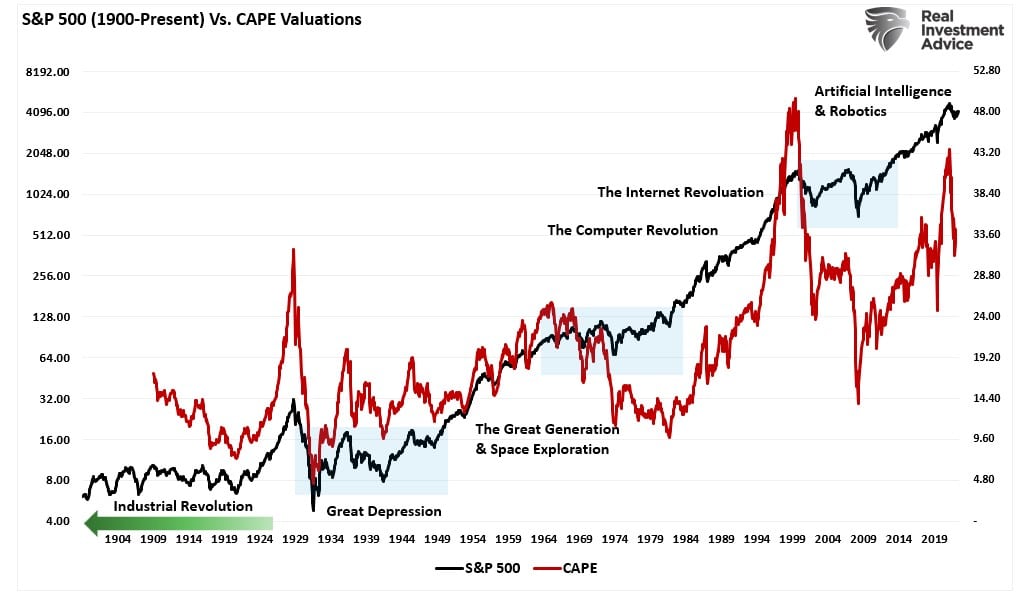
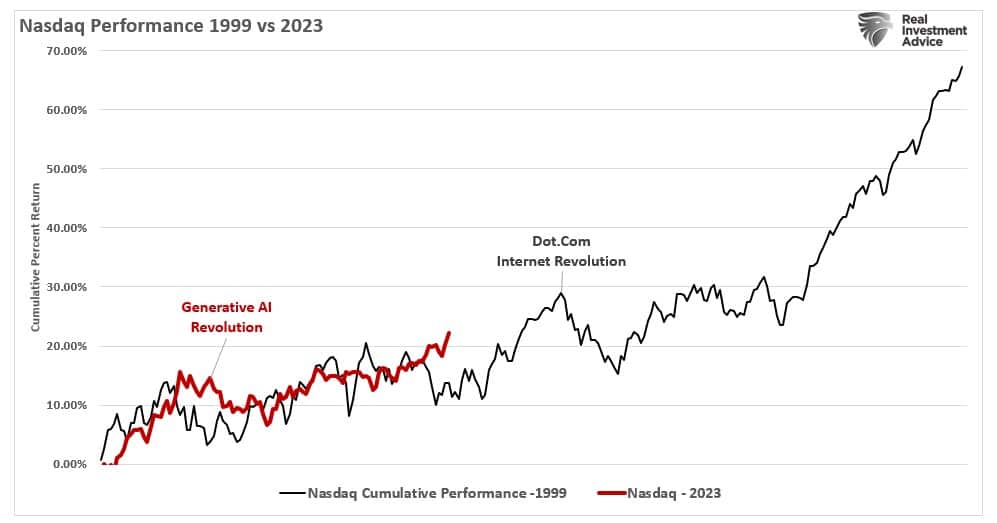
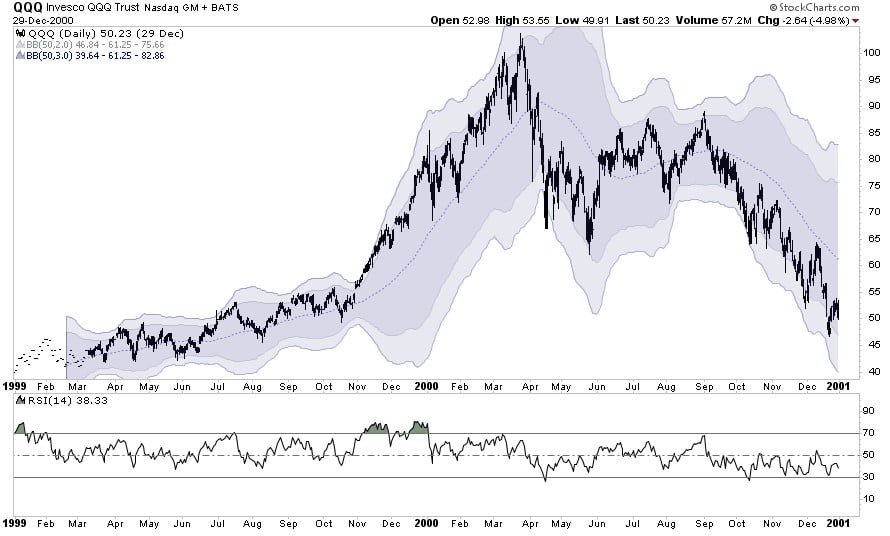
We are experiencing another of these speculative “booms” as anything “artificial intelligence” grips investors’ imaginations. The chart below compares the 1999 “Dot.com/Internet Revolution” in the Nasdaq composite versus the 2023 “A.I.” revolution.
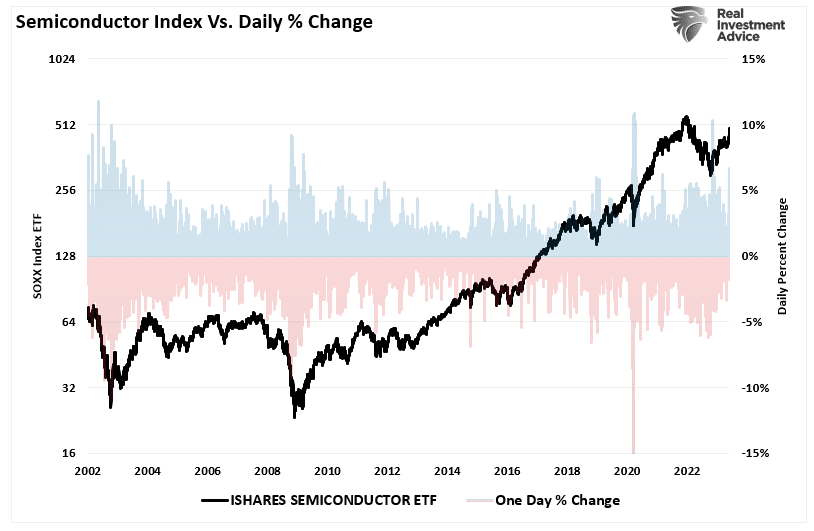
The Semiconductor Index ETF (S.O.X.X.) recently had one of the most significant daily percentage changes as investors piled into semiconductor stocks linked to artificial intelligence.
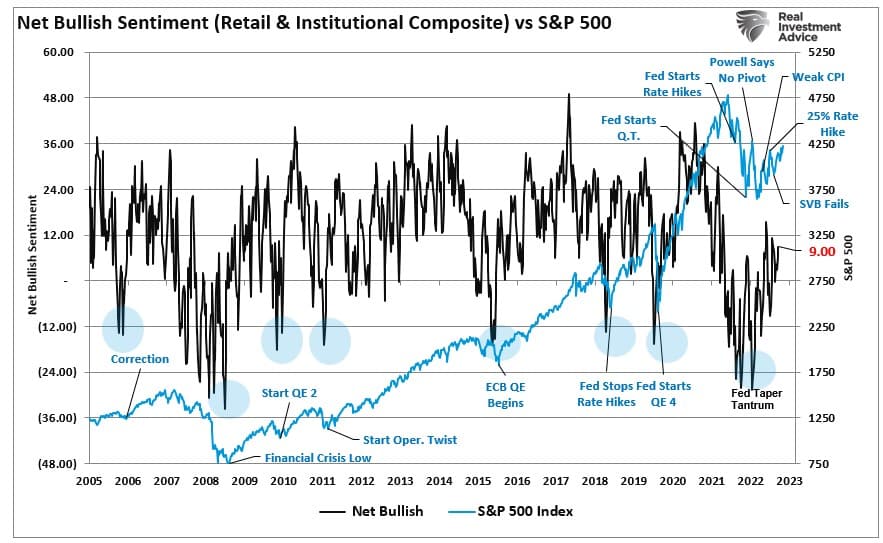
Of course, the conversion of bearishly positioned investors into bulls is needed to propel the F.O.M.O. trade higher. Both professional and retail investor sentiment remains more bearishly biased. Such leaves much buying power to move stocks higher as those investors eventually capitulate and chase the market higher.
Furthermore, as we noted last week, there is still an enormous short position against the S&P 500 as well:
“Since 2009, large net short positioning has denoted market bottoms. Each of the periods where the COT net short positioning became more extreme, such provided the “fuel” for the ongoing advance as traders were forced to cover their short-positioning as markets rose.”
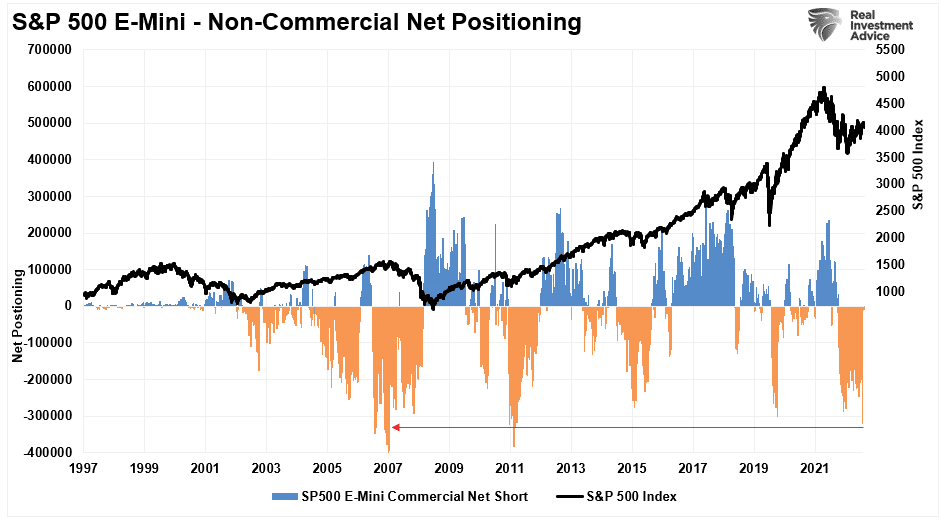
While the still pessimistic view, and massive short position, will provide the “fuel” needed to propel the markets higher near term, such doesn’t mean the market won’t have some minor corrections along the way. As we witnessed in 1999, those corrections are potential buying opportunities until fundamental reality prevails.
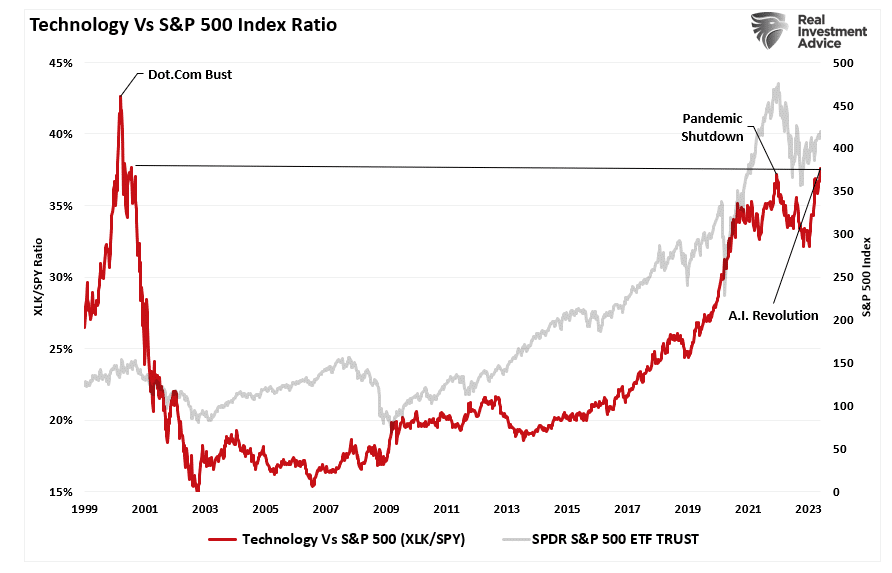
Follow The Technicals
The Nasdaq, and artificial intelligence-related stocks, are pushing more extreme levels. As shown, the ratio between the Technology sector and the rest of the S&P 500 index has already exceeded the post-Pandemic Shutdown stimulus fueled, stock buying frenzy and continues to look more like 1999.
In 1999, the Nasdaq surged higher, repeatedly pushing into 3-standard deviation territory above the 50-DMA. While the overall trend persisted higher temporarily, the Nasdaq regularly corrected to the mean. (Note: The Nasdaq also repeatedly pushed 3-standard deviations below the 50-DMA during the subsequent bear market.)
The Nasdaq is once again doing the same.
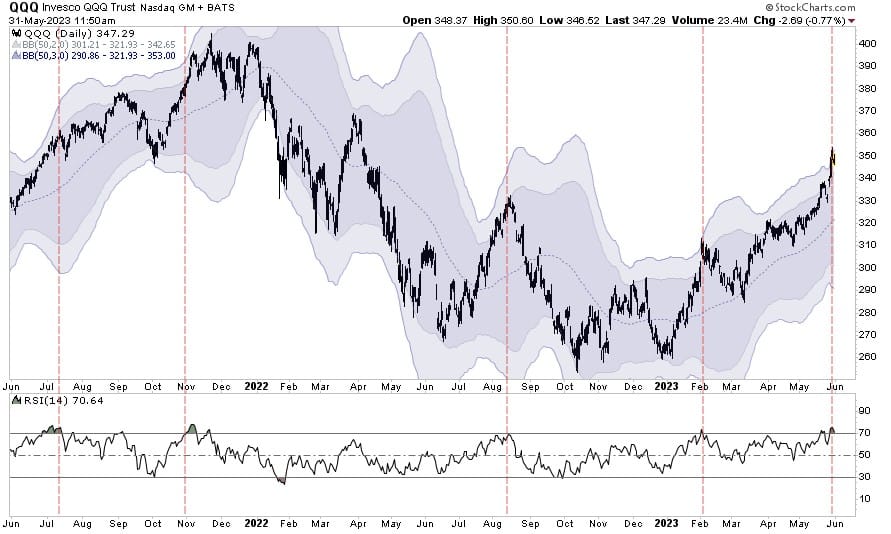
Of course, during a “mania,” markets do correct. This is why technical analysis becomes more helpful in determining entry and exit points. Over the last 6-years, the Nasdaq repeatedly deviated above its underlying moving average. In every case, a reversion occurred given enough time.
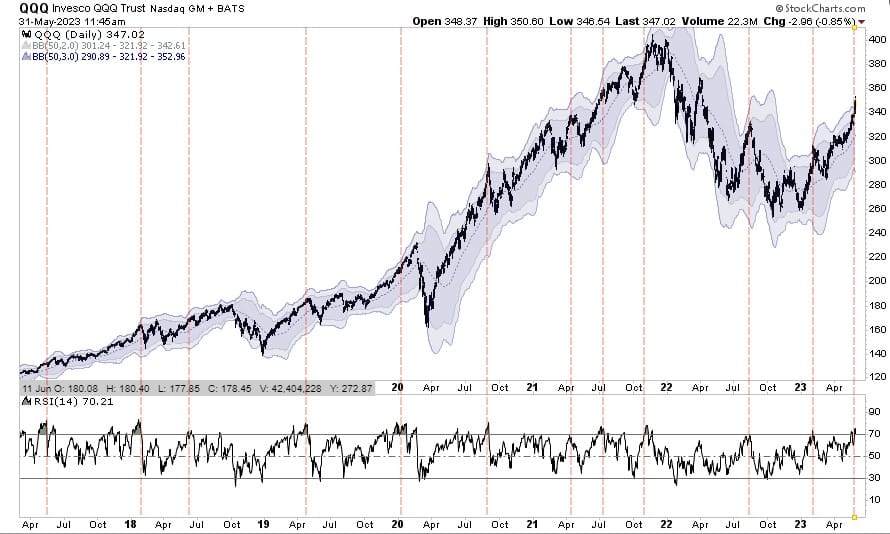
Most importantly, when QQQ trades more than two standard deviations above the 50-DMA and the Relative Strength Index (R.S.I.) is above 70, as it is currently, such typically denotes a short-term top. What will cause that correction is unknown, but a correction is expected.
Much like in 1999, the Nasdaq is trending higher. Therefore, corrections should continue to be contained to the 50-DMA. Such would suggest a correction toward 330 on the QQQs is likely. However, a correction could retrace to the bottom of the standard deviation ranges, bringing 300 into focus.
The critical point is that a correction will provide a better opportunity to enter technology stocks at better prices. Just understand that eventually, the trend higher will reverse, so it will be equally important to remember to “sell.”
Cisco Systems (CSCO.) was the Nvidia (NVDA) of the internet revolution. Those who bought CSCO in 1999, and forgot to sell, have never recovered.
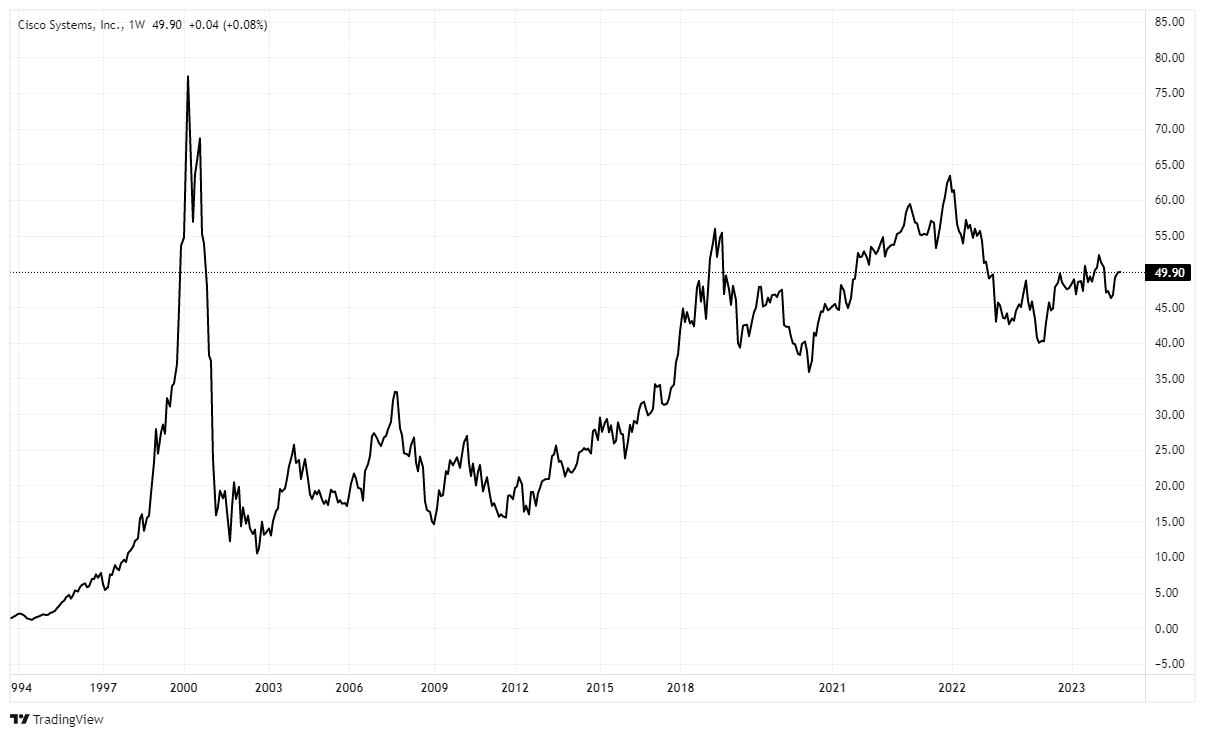
As is always the case during a mania, investors disregard the underlying fundamentals in the short term in the chase for riches.
However, in the long term, valuations will matter, and they will matter a lot.
But that is an article for when the F.O.M.O. eventually ends.
How We Are Trading It
As we stated last week:
“We are very skeptical of the current market environment, but given the market’s rally since the October lows, we must keep exposure to the equity market.”
The surge in the mega-capitalizations is making the overall market look more robust than it is. However, that is just a function of the massive influence of passive ETFs on the overall market. Such was a point we made previously:
“This concentration of risk, lack of liquidity, and a market increasingly driven by ‘robot trading algorithms,’ reversals are no longer a slow and methodical process but rather a stampede with little regard to price, valuation, or fundamental measures as the exit becomes very narrow.“
The passive index effect also works during stampeding bull markets as every dollar flowing into ETFs concentrates more than 30 cents of each invested dollar into just ten stocks. Such is why the breadth of the current rally remains narrow and is at risk of a reversal.
Overall, we continue to make tiny moves to align the risk profile of portfolios to the market. Given the recent buy signals from our indicators, we cautiously added needed exposure. However, we remain underweight in equities and overweight cash currently. The improvement in the overall price action confirms that downside risk is somewhat limited in the current environment.
Regardless, the bull market remains intact for now. Therefore, these investment rules, common with many of the greatest investors in history, will help you navigate the market we have.
- Cut Losers Short And Let Winners Run.
- Investing Without Specific End Goals Is A Big Mistake.
- Emotional And Cognitive Biases Are Not Part Of The Process.
- Follow The Trend.
- Don’t Turn A Profit Into A Loss.
- Odds Of Success Improve Greatly When Technical Analysis Supports Fundamental Analysis.
- Try To Avoid Adding To Losing Positions.
- In Bull Markets, You Should Be “Long.” In Bear Markets – “Neutral” Or “Short.”
- Invest First with Risk in Mind, Not Returns.
- The Goal Of Portfolio Management Is A 70% Success Rate.
Have a great week.
Research Report
Subscribe To “Before The Bell” For Daily Trading Updates (Formerly 3-Minutes)
We have set up a separate channel JUST for our short daily market updates. Please subscribe to THIS CHANNEL to receive daily notifications before the market opens.
Click Here And Then Click The SUBSCRIBE Button
Subscribe To Our Youtube Channel To Get Notified Of All Our Videos
Stock Of The Week In Review
Betting On This Year’s Bad Breadth
“Year to date, the S&P 500 is up about 8%. However, the gains are poorly distributed. In technical terms, one might say the market has bad breadth. To that point, over three-quarters of this year’s S&P 500 gains are attributable to only ten stocks. Apple, one of the ten stocks, now has a market cap greater than the entire Russell 2000! The graph below shows the Nasdaq (QQQ), with the most weighting toward the market leaders, has been in a nice uptrend all year. At the same time, the equal-weighted S&P 500 (RSP) has been trending lower since February.
Investors are questioning whether the market can continue to rally on the back of so few stocks.“
Login to Simplevisor.com to read the full 5-For-Friday report.
Daily Commentary Tidbits
CostCo Customers Send Recession Warning
In its recent earnings call, Costco’s CFO gave a unique warning about the potential for a slowdown or recession. As shown below, courtesy of The Transcript, Costco warns they are seeing shifts in what customers are buying. Such consumption shifts are similar to those Costco witnessed during the 2008 and 2000 recessions. In particular, Costco says customers are shifting purchases toward cheaper meats like pork or chicken and canned meats. Further, sales from Costco’s brand, Kirkland, rose 1.2% last quarter, much greater than prior Kirkland sales growth, as customers are seeking lower-cost alternatives to the more popular name brands. In another signal that customers seek to save money, Costco’s CFO said its customers are buying apparel “in a big way.” Again, some of its customers are likely shifting purchases to Costco from the more traditional and expensive stores and name brands.
From Costco’s view, it may appear consumers are struggling. But, it is also possible consumers’ spending habits are changing. For instance, per the Census Bureau’s latest retail sales report, total retail sales are only .15% higher this past April versus April 2022. However, spending at food services and drinking places is up 8%, while clothing stores are down 4.13%. Inflation and the odd spending habits which occurred during the pandemic are still wreaking havoc on economic data. Typical economic patterns and warnings are not proving, at least not yet, reliable.

Bull Bear Report Market Statistics & Screens

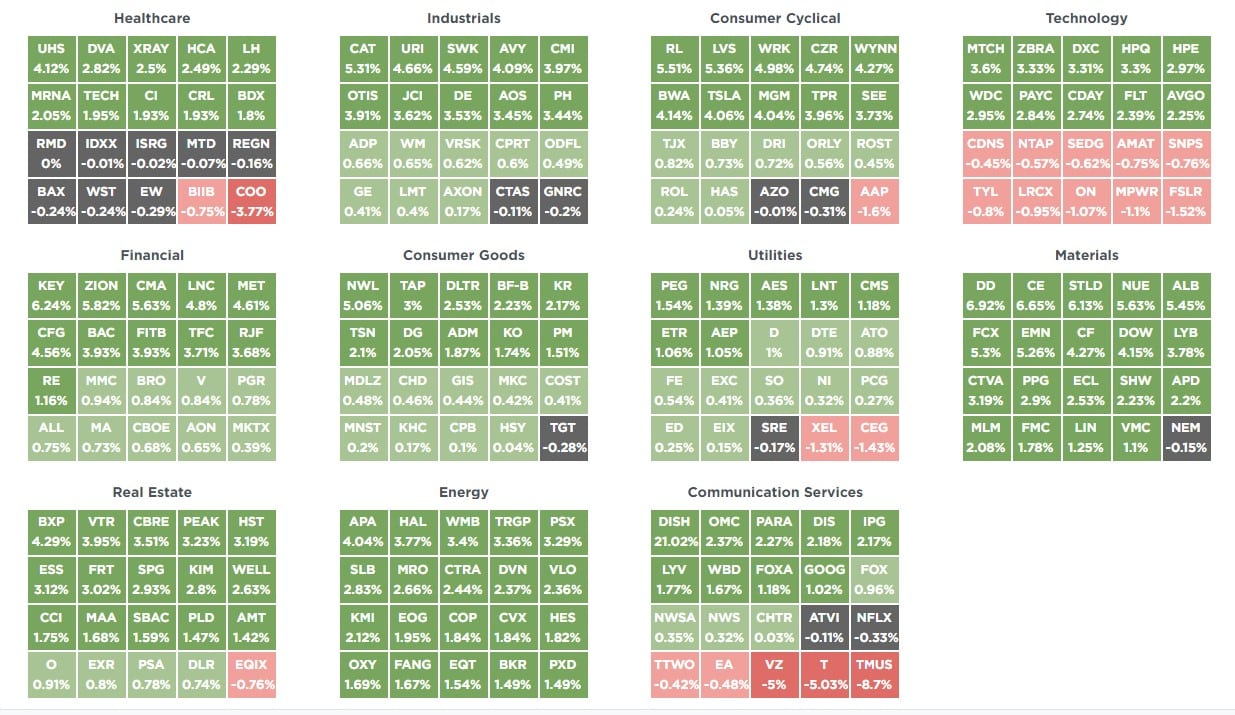
SimpleVisor Top & Bottom Performers By Sector
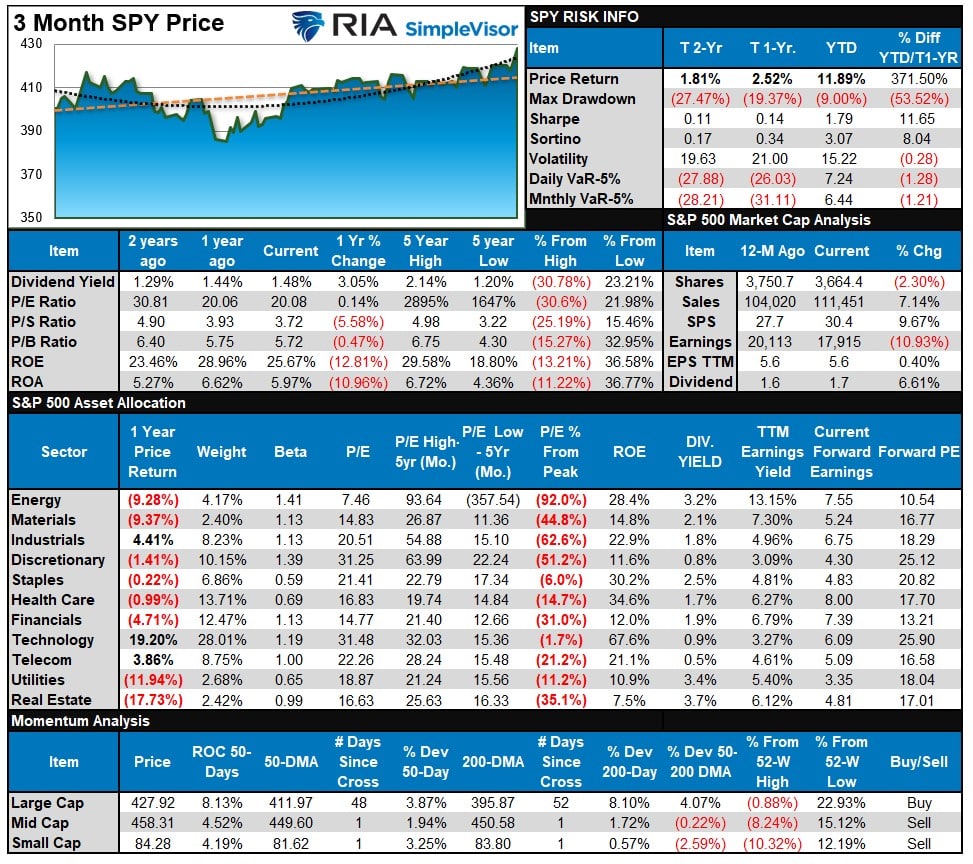
S&P 500 Weekly Tear Sheet
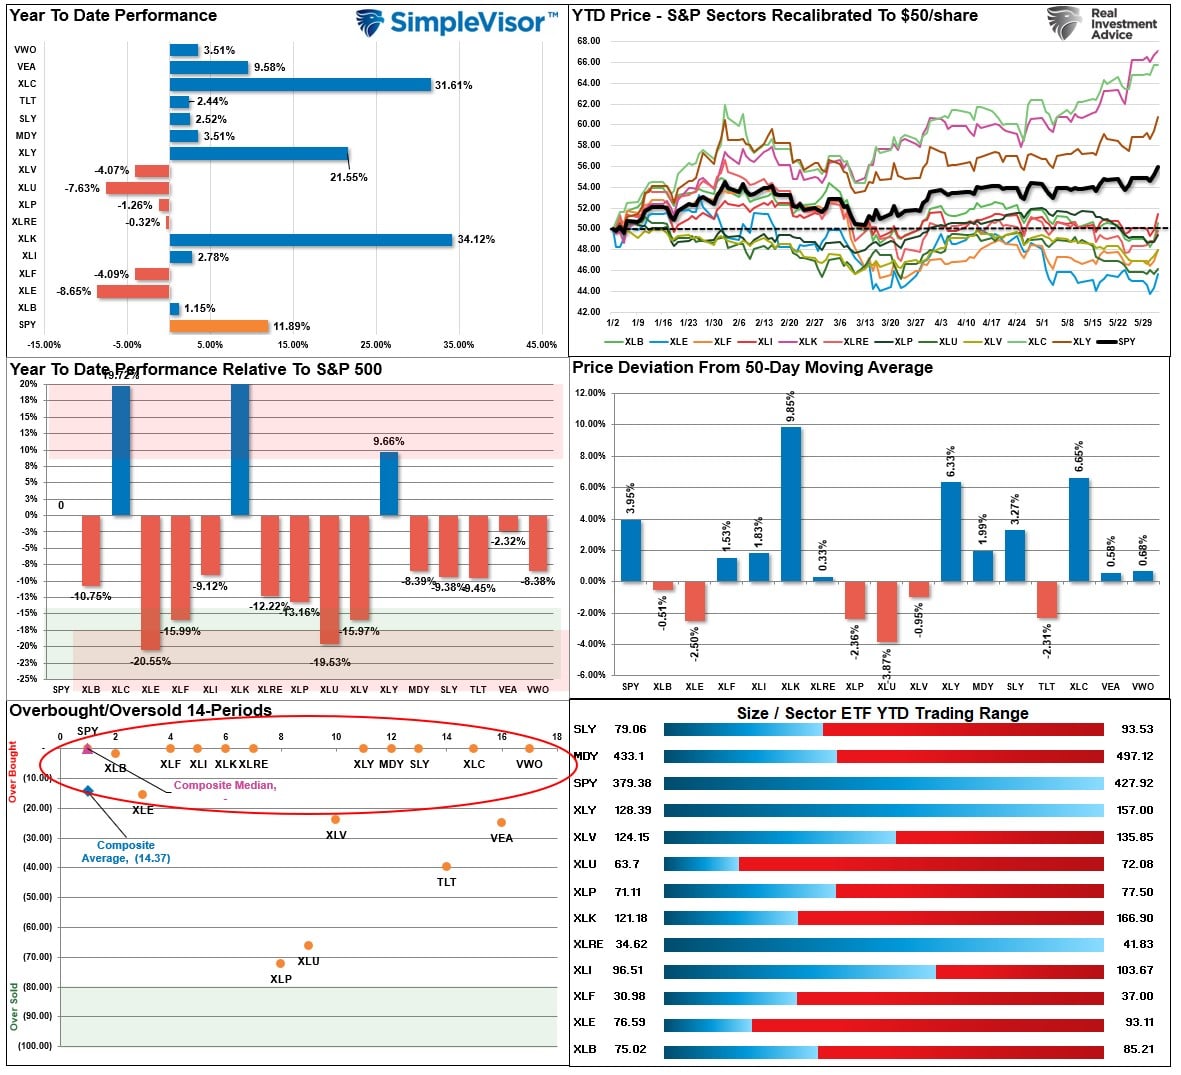
Relative Performance Analysis
Over the last couple of weeks, we have noted a clear divergence in performance. To wit:
“We continue to expect a short-term rotation between the overbought areas of the market and the oversold. With the S&P 500 now in highly overbought territory, relative to itself, along with Technology and Communications, we are in a good position for a bit of short-term rotation.”
That rotation may have started on Friday. We will see. However, the market is broadly overbought and needs a pullback after last week’s surge, and most sectors are now stretched above their moving averages. Performance is still highly bifurcated between Technology, Communications, Discretionary, and everything else. That won’t likely change soon, so use a rotation within the market to reduce defensive and increase cyclical stocks accordingly.
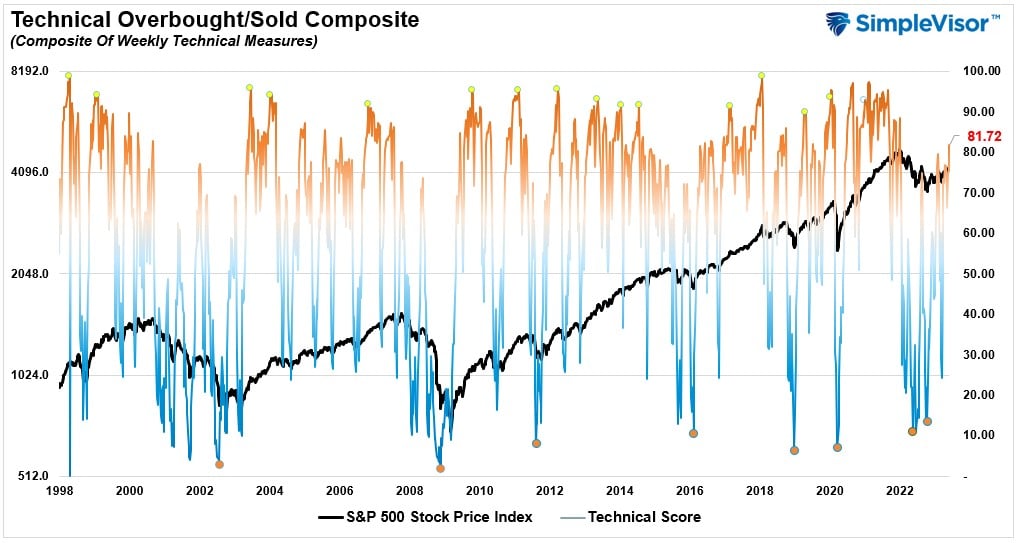
Technical Composite
The technical overbought/sold gauge comprises several price indicators (R.S.I., Williams %R, etc.), measured using “weekly” closing price data. Readings above “80” are considered overbought, and below “20” are oversold. The market peaks when those readings are 80 or above, suggesting prudent profit-taking and risk management. The best buying opportunities exist when those readings are 20 or below.
The current reading is 81.72 out of a possible 100.
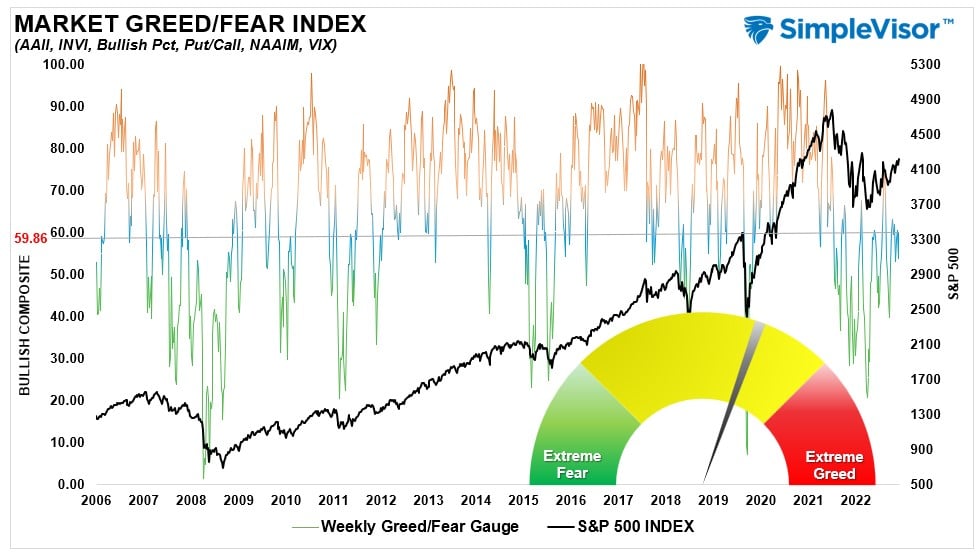
Portfolio Positioning “Fear / Greed” Gauge
The “Fear/Greed” gauge is how individual and professional investors are “positioning” themselves in the market based on their equity exposure. From a contrarian position, the higher the allocation to equities, the more likely the market is closer to a correction than not. The gauge uses weekly closing data.
NOTE: The Fear/Greed Index measures risk from 0 to 100. It is a rarity that it reaches levels above 90. The current reading is 59.86 out of a possible 100.
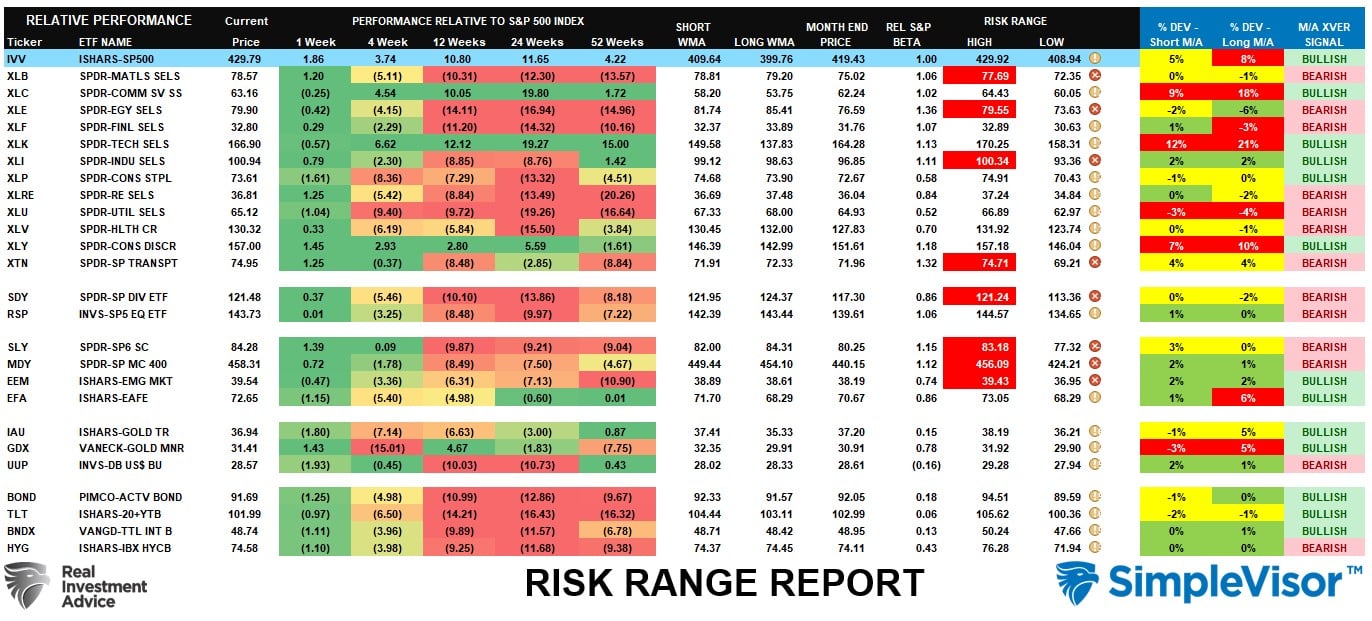
Sector Model Analysis & Risk Ranges
How To Read This Table
- The table compares the relative performance of each sector and market to the S&P 500 index.
- “MA XVER” (Moving Average Cross Over) is determined by the short-term weekly moving average crossing positively or negatively with the long-term weekly moving average.
- The risk range is a function of the month-end closing price and the “beta” of the sector or market. (Ranges reset on the 1st of each month)
- The table shows the price deviation above and below the weekly moving averages.
An interesting development has occurred as more sectors are triggering “bearish” crossovers, which isn’t a sign of a healthy market. However, due to Friday’s surge in the short-term, many sectors are now very overbought and are due for a pullback. This looks like a more panicked move to gain allocation to a market by managers, which may be short-lived. We continue to expect to see a bit of a rotation from cyclical to defensive, and we may have seen the start of that on Friday.
Weekly SimpleVisor Stock Screens
We provide three stock screens each week from SimpleVisor.
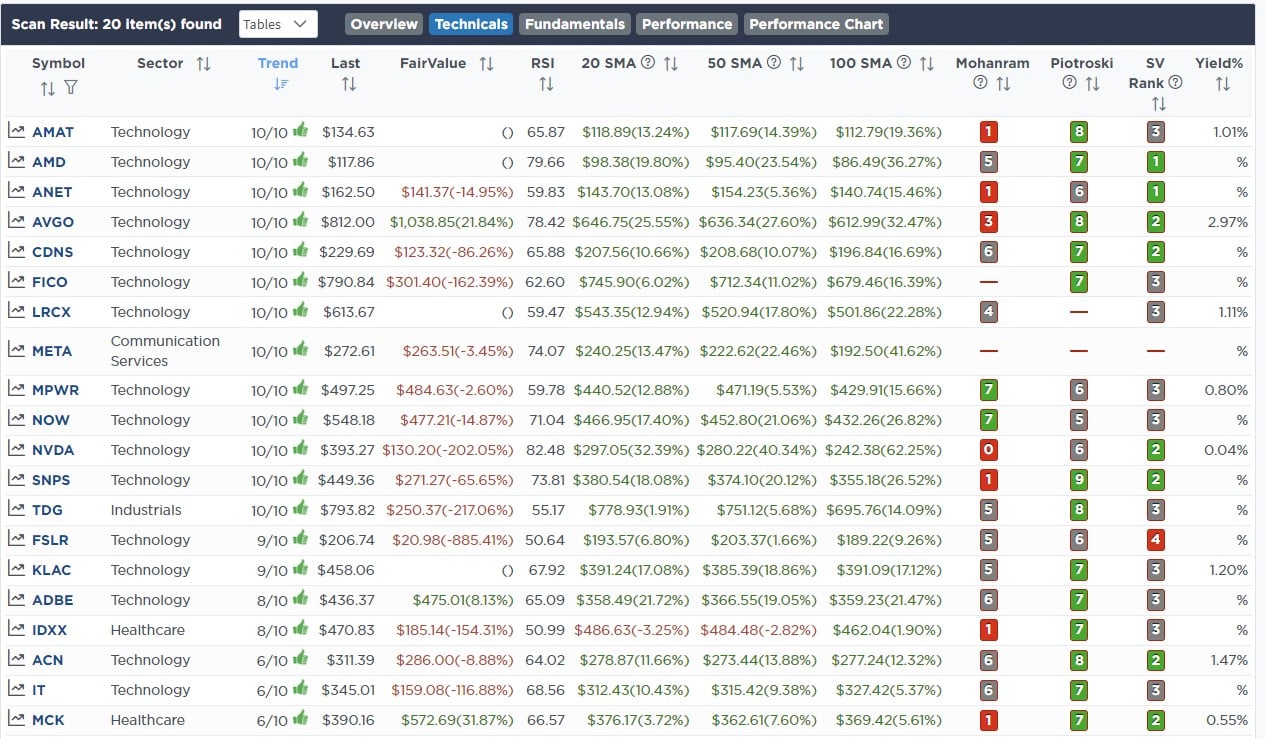
This week we are searching for the Top 20:
- Relative Strength Stocks
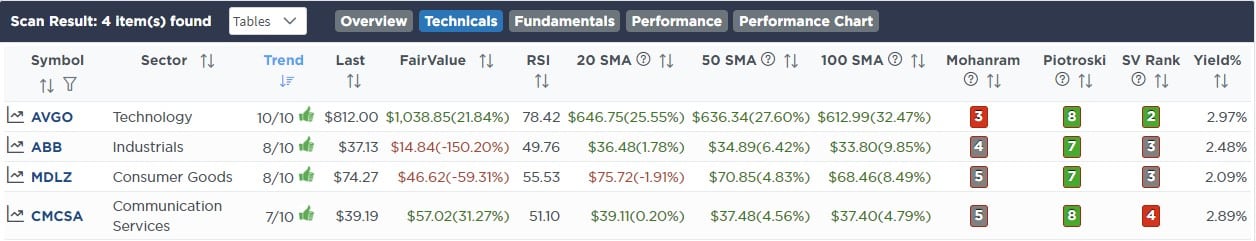
- Momentum Stocks
- Technically Strong Stocks With Dividends
(Click Images To Enlarge)
R.S.I. Screen
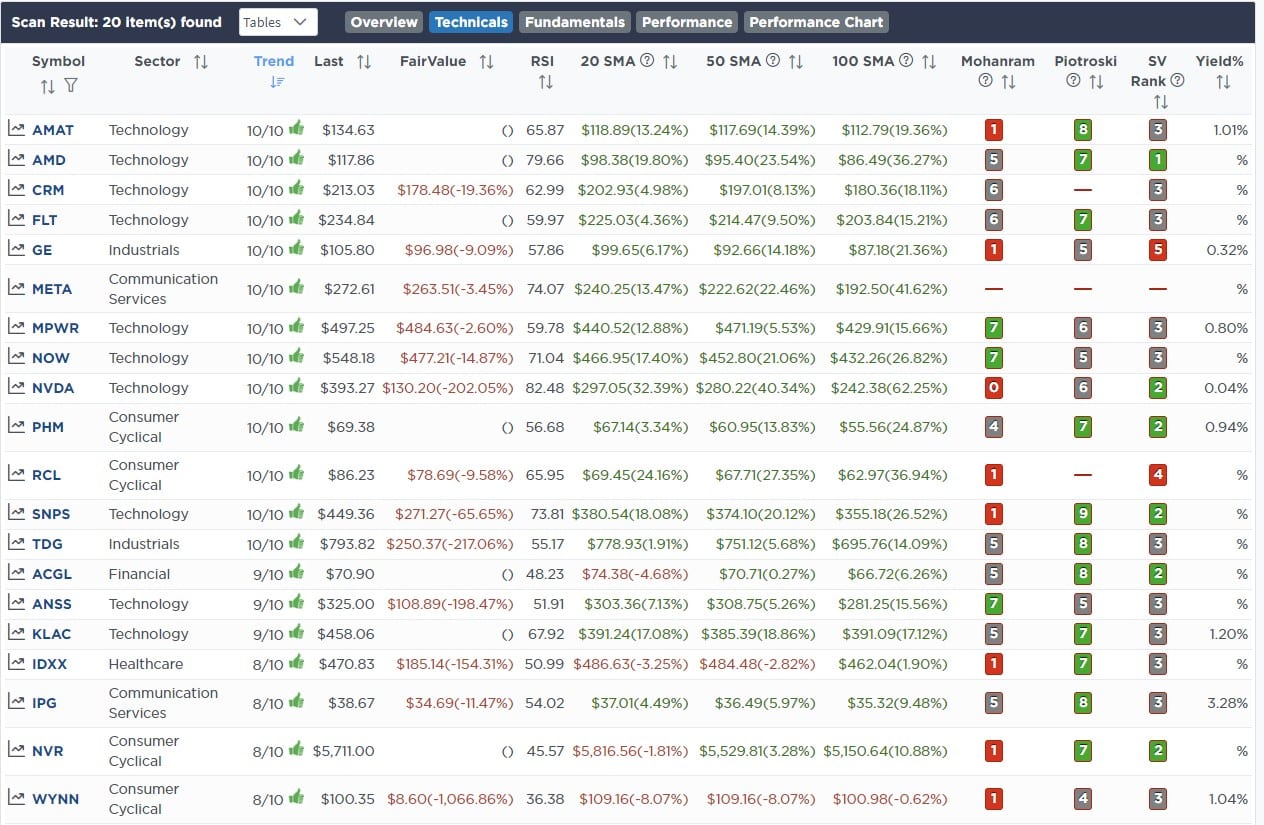
Momentum Screen
Technically Strong With Dividends
SimpleVisor Portfolio Changes
We post all of our portfolio changes as they occur at SimpleVisor:
June 1st
With the debt ceiling crisis behind us, the focus will turn toward slower economic growth and falling inflation, where interest rates are concerned. While rates could tick slightly higher with the coming debt issuance, we will use any price decline to add further to our longer-duration bond holdings.
Today we are increasing our position in the iShares 20-Year Treasury Bond ETF (TLT) by 1% of the portfolio.”
Both Models
- Increase the iShares 20-Year Treasury Bonds ETF (T.L.T.) by 1% of the portfolio.
June 2nd
“Over the last few years, we have repeatedly bought and sold portions of our long-term holdings. These companies pay a dividend, are regular dividend growers, and have a significant barrier to entry for their products.
We are adding to two of our core long-term holdings in the Equity model today after we took profits in these positions last year. We are adding 1/2 percent of the portfolio size to both Proctor & Gamble (PG) and Abbvie (ABBV).“
Equity Model Only
- Increase current portfolio position in Proctor & Gamble (PG) by 0.5%
- Add to current portfolio position in Abbvie (A.B.B.V.) by 0.5%

Lance Roberts, C.I.O.
Have a great week!

