Sentiment Is So Bearish, It’s Getting Bullish


In this 04-08-22 issue of “Sentiment Is So Bearish, It’s Getting Bullish.”
- Market Review & Trading Update
- Sentiment Is So Bearish It’s Bullish
- Portfolio Positioning
- Sector & Market Analysis
Follow Us On: Twitter, Facebook, Linked-In, Sound Cloud, Seeking Alpha
Need Help With Your Investing Strategy?
Are you looking for complete financial, insurance, and estate planning? Need a risk-managed portfolio management strategy to grow and protect your savings? Whatever your needs are, we are here to help.
Schedule your “FREE” portfolio review today.

Weekly Market Recap With Adam Taggart
Market Review & Update
We provide a daily trading update in our Daily Market Commentary (free pre-market email). During the past week, the message was consistent.
“The continued sloppy action over the last week is doing its job of working off the overbought condition while maintaining critical support about the 50-dma. With both of the technical sell-signals about 50% of the way through a normal reversion, a few more days of consolidation should open up the window for a tradeable opportunity.”
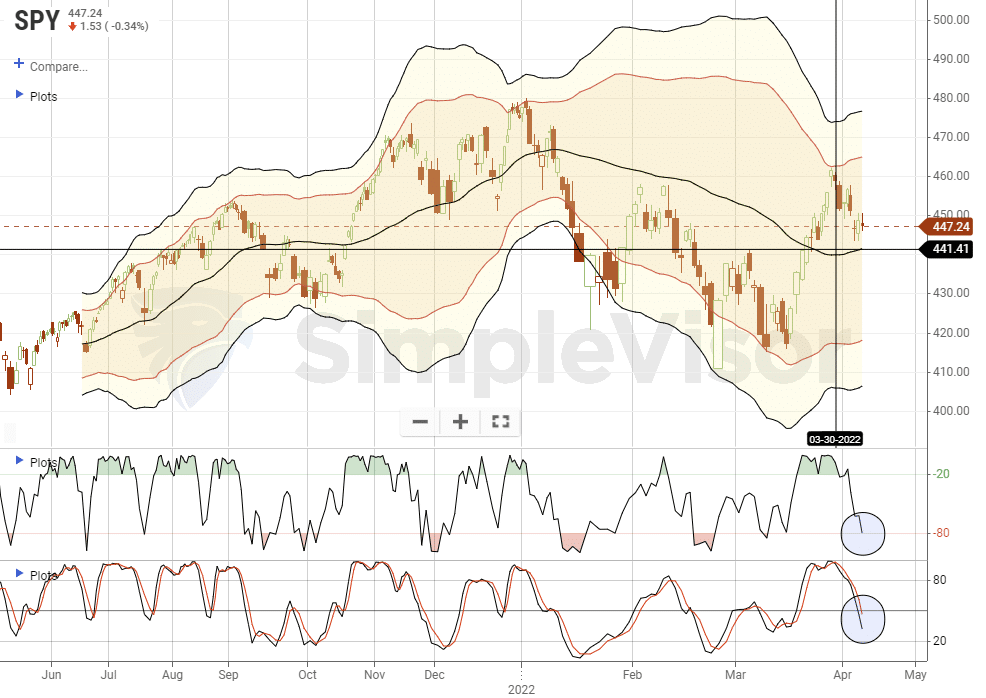
As of Friday, the sloppy action reversed most of the overbought conditions. There was a good bit of rotation between sectors. On Monday, money flows strongly favored the “deflation sectors,” with technology leading the way higher. That flipped later in the week, following the release of the FOMC minutes, with “inflation safety sectors,” like staples, healthcare, and energy outperforming.
However, over the last 10-weeks, there has been no discernible trend in most sectors, except for energy. Sectors have oscillated very tightly around the relative performance of the S&P 500.
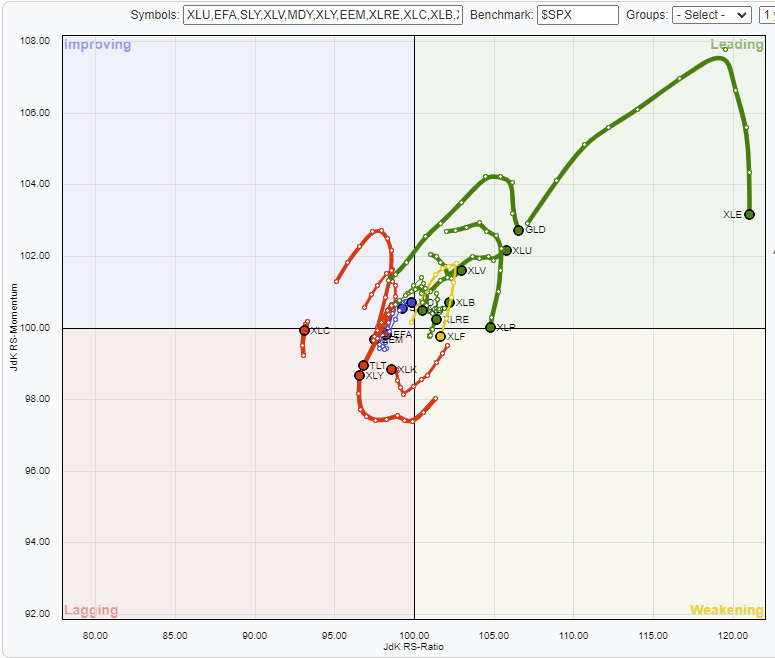
This “directionless” market trend makes navigating markets more difficult than usual. Oversold sectors tend to remain oversold, and overbought sectors remain overbought longer than expected. Such will eventually resolve itself when the market breaks out in one direction or the other. However, until that happens, almost any short-term decision will likely appear to be wrong.
Longer-term, we are likely at an essential juncture in the market. With the Fed tightening policy, interest rates and inflation crimping economic activity, and profit margins under pressure, we suspect the market will declare itself sooner than later.
Such is usually when contrarian investing will begin to reward those that can buy discounted assets that everyone hates.

Contrarian Investing
One of the hardest things to do is go “against” the prevailing bias when it comes to investing. Such is known as contrarian investing. One of the most famous contrarian investors is Howard Marks, who once stated:
“Resisting – and thereby achieving success as a contrarian – isn’t easy. Things combine to make it difficult; including natural herd tendencies and the pain imposed by being out of step, particularly when momentum invariably makes pro-cyclical actions look correct for a while. (That’s why it’s essential to remember that ‘being too far ahead of your time is indistinguishable from being wrong.’)
Given the uncertain nature of the future, and thus the difficulty of being confident your position is the right one – especially as price moves against you – it’s challenging to be a lonely contrarian.”
The critical point of his comment is that being too far ahead of a turning point (either bullish or bearish), even though ultimately being proved right, is still “indistinguishable from being wrong.”
However, there is a significant difference between making the right call early, particularly when the trend is changing from bullish to bearish, and making no call at all.
While hindsight is clear about what happens, the outcome will take months to develop, given the current environment of tighter monetary policy, inflation, and high valuations.
From a bullish view, the markets are currently “pricing in” the Fed, Russia, and valuations. The bearish outlook suggests there is more downside to come.
Which view is correct? We don’t know.
But being early will appear to be the same as being wrong.
This Week’s MacroView

Sentiment Is So Bearish; It’s Bullish Short-Term
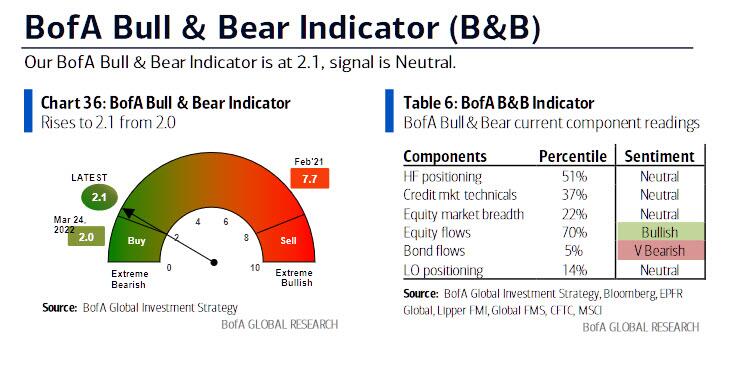
Currently, investor positioning a sentiment remains negative. As noted in Tuesday’s blog:
“Even after a 10% rally from the March lows, BofA’s sentiment indicator is still pushing more extreme bearish conditions.”
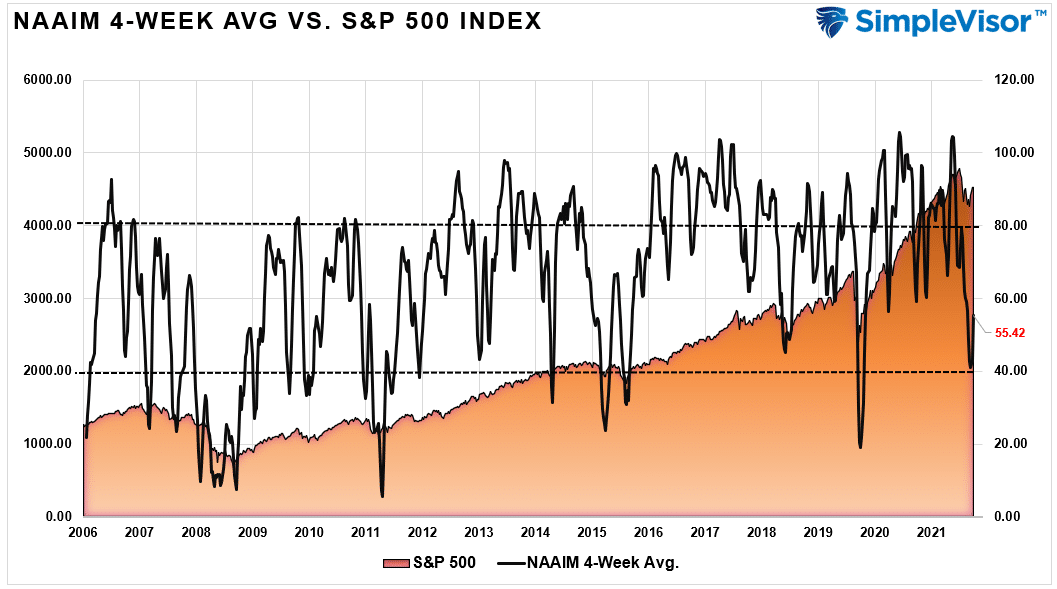
More importantly, investor allocations, particularly among professional investors, remain extremely light, suggesting a much higher level of caution. The following is the 4-week moving average of the National Association of Investment Managers equity exposure index. At a reading of 55, such is often coincident with short-term market bottoms.
Retail investors, or what is more typically known as “dumb money” as they tend to buy high and sell low, remain very negative even after the recent rally.
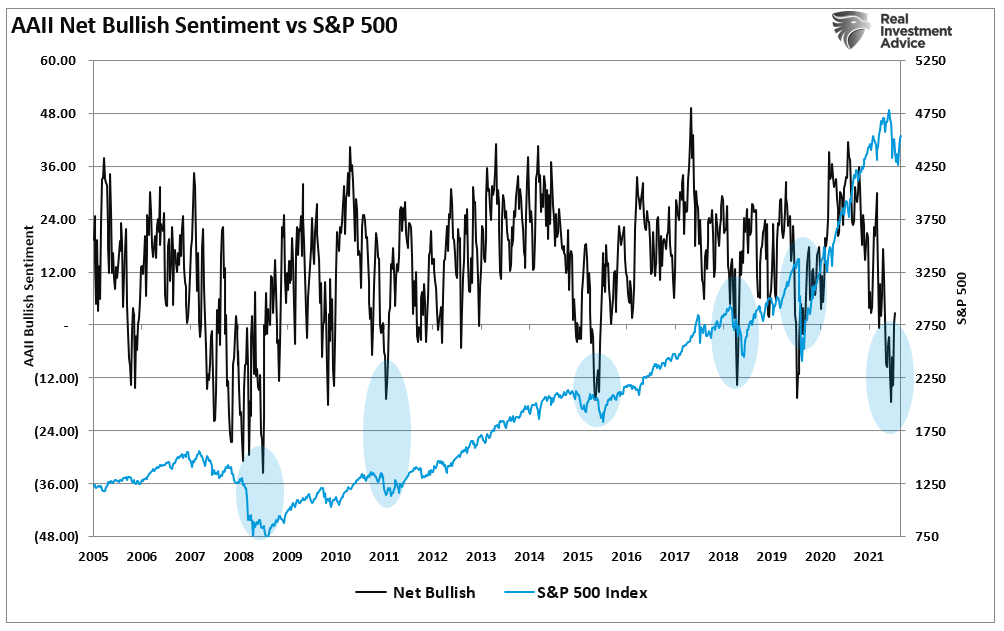
As shown, when levels of negativity have reached or exceeded current levels, such has historically been associated with short- to intermediate-term market bottoms. However, there are two critical points to note:
- During bull markets, negative sentiment was a clear buying opportunity.
- During bear markets (2008), negative sentiment stays negative while markets decline.
Such raises the vital question: Are we still in a bull market, or are we in the early stages of a bear market?
Long-Term The Outlook Remains Bearish
While the negative sentiment is “bearish” currently enough to be “bullish,” the longer-term fundamental and technical dynamics suggest a continued correction is possible. As noted above, the negative sentiment levels could support a rally over the next couple of months. Such would lure investors into the market just as the more bearish fundamental and technical backdrop unfolds.
That wouldn’t be the first time such an outcome occurred.

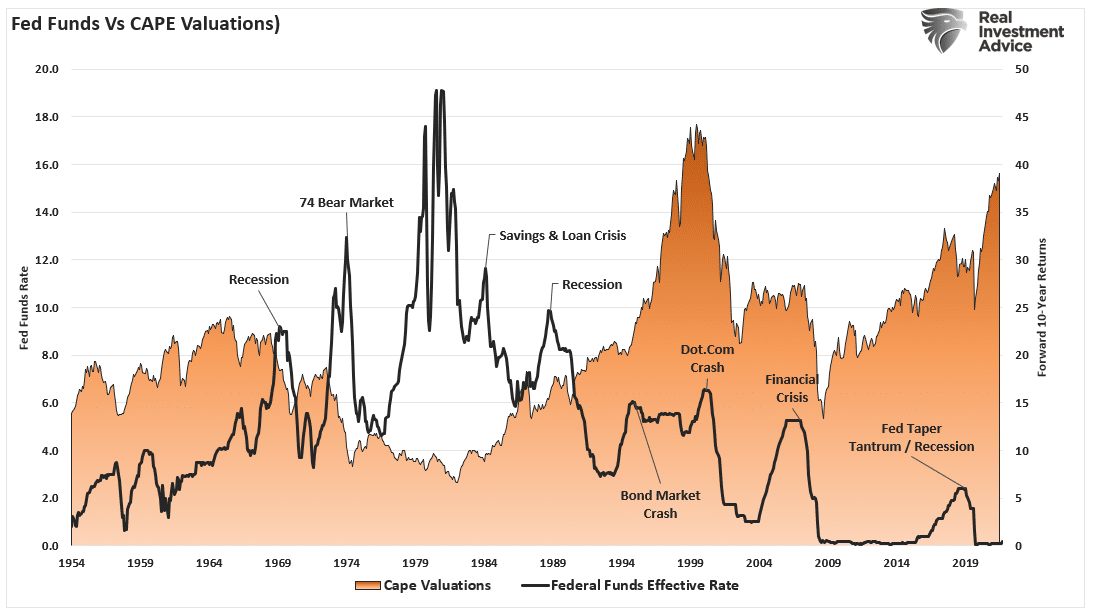
More importantly, like in 2008, 2000, and 1929, valuations on stocks are incredibly high. While the bullish mantra over the last decade was “low rates justify high valuations,” rates are rising, which puts valuations at risk. The Fed historically hikes rates until “something breaks,” which drastically lowers valuations (i.e., prices fall sharply.)
The market is exceptionally overbought in terms of both standard deviations from long-term means and relative strength (RSI) from a long-term technical perspective.

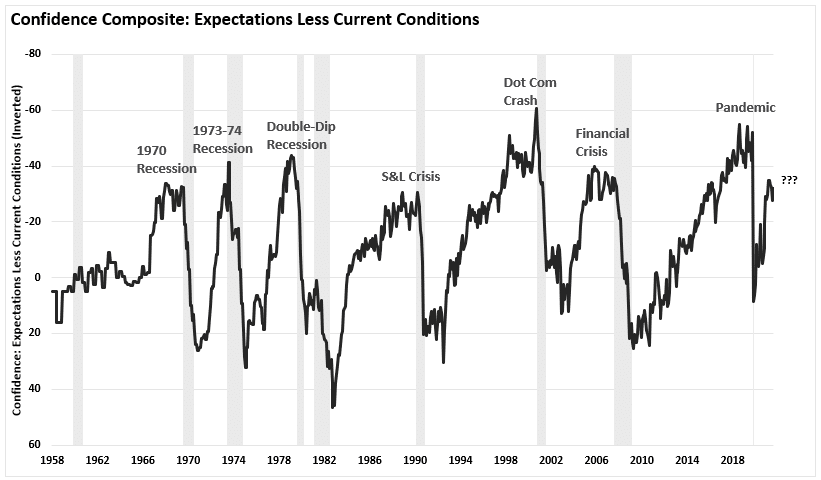
Notably, consumer confidence is also at levels that historically align with more substantial mean-reverting events. (The chart below is the consumer confidence composite index of UofM and Conference Board measures.)
These fundamental and technical measures can take long periods before they matter. Positioning for adverse outcomes today can both appear wrong in the short-term and cost capital appreciation opportunities.
However, these measures will likely prove beneficial in limiting capital losses in the longer term. The trick will be recognizing when they start to matter.
But when they do matter, they tend to matter a lot.

Portfolio Update
The takeaway from this weekend’s commentary is not to let long-term concerns over valuations, economics, or geopolitical events overweight decision-making in your portfolio. Our job as investors is to capitalize on available opportunities but avoid the present risks. Like navigating a ship, a good captain knows the reefs and rocks and can safely maneuver into the open ocean.
There are plenty of reasons to be very concerned about the market over the next few months. However, markets can often defy logic in the short term despite the apparent weight of evidence to the contrary. As I noted last week:
“It is always important to never discount the unexpected turn of events that can undermine a strategy. While we continue to err on the side of caution momentarily, it does not mean we will remain wed to that view.”
The next few weeks, and even the next couple of months, will likely be frustrating. Markets are likely to remain rangebound with little progress made for either the bulls or the bears. We are maintaining our exposures to higher-than-normal levels of cash and underweight both equities and bonds.

Due to fund managers’ negative sentiment, seasonality, and high cash levels, we remain more optimistic about the markets. However, we remain cautious due to the broader macro risks.
There is little value in trying to predict market outcomes. The best we can do is recognize the environment for what it is, understand the associated risks, and navigate cautiously.
Leave being “bullish or bearish” to the media.
See you next week.
Market & Sector Analysis
S&P 500 Tear Sheet
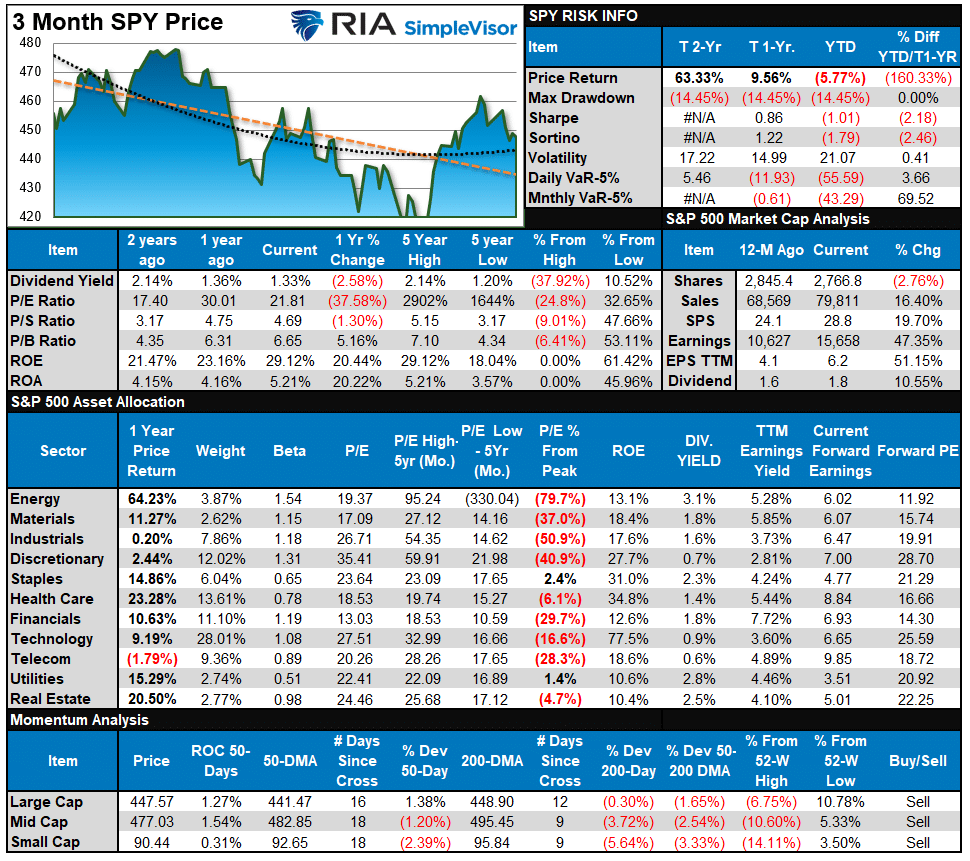
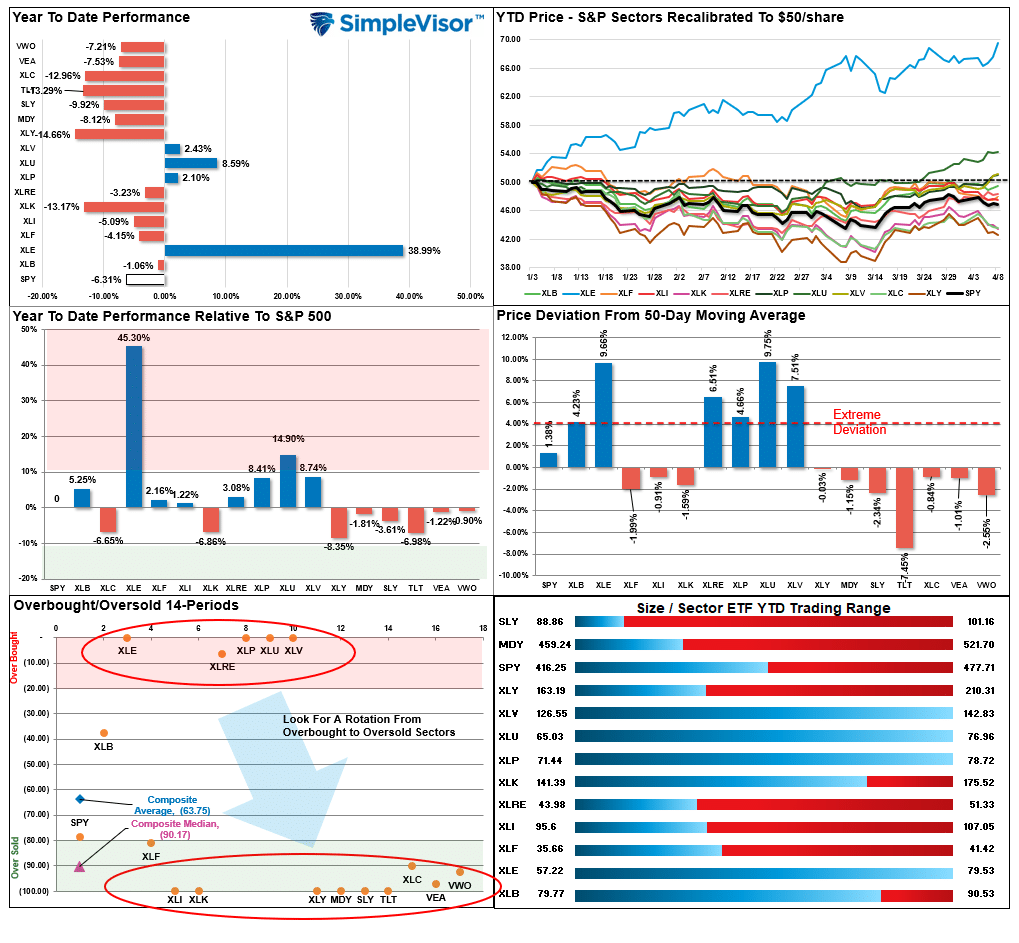
Relative Performance Analysis
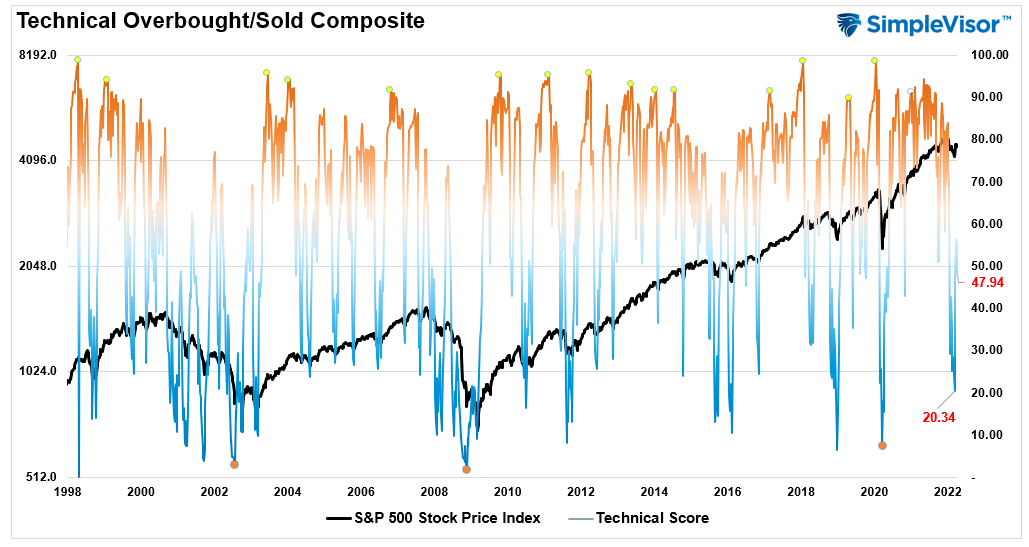
Technical Composite
The technical overbought/sold gauge comprises several price indicators (RSI, Williams %R, etc.), measured using “weekly” closing price data. Readings above “80” are considered overbought, and below “20” are oversold. The current reading is 47.94 out of a possible 100.
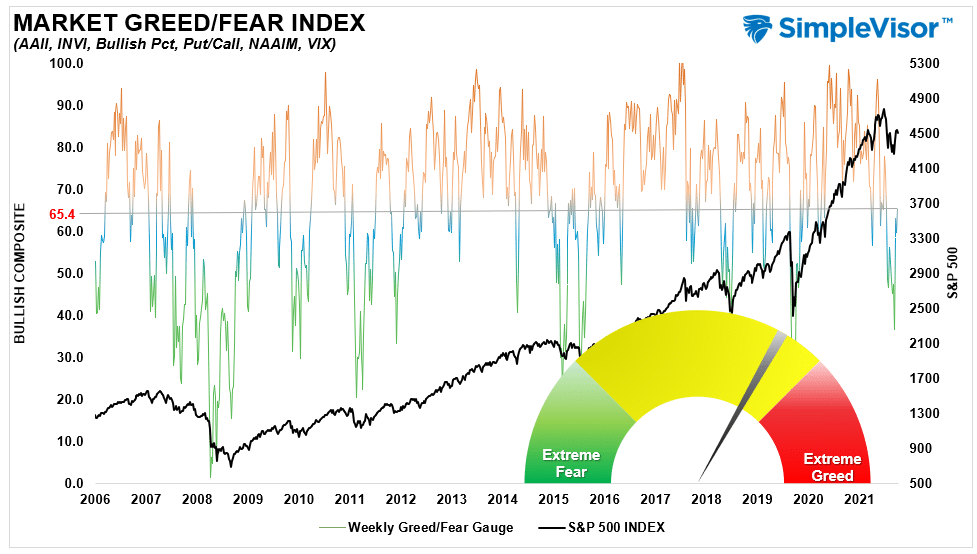
Portfolio Positioning “Fear / Greed” Gauge
The “Fear/Greed” gauge is how individual and professional investors are “positioning” themselves in the market based on their equity exposure. From a contrarian position, the higher the allocation to equities, to more likely the market is closer to a correction than not. The gauge uses weekly closing data.
NOTE: The Fear/Greed Index measures risk from 0 to 100. It is a rarity that it reaches levels above 90. The current reading is 65.4 out of a possible 100.
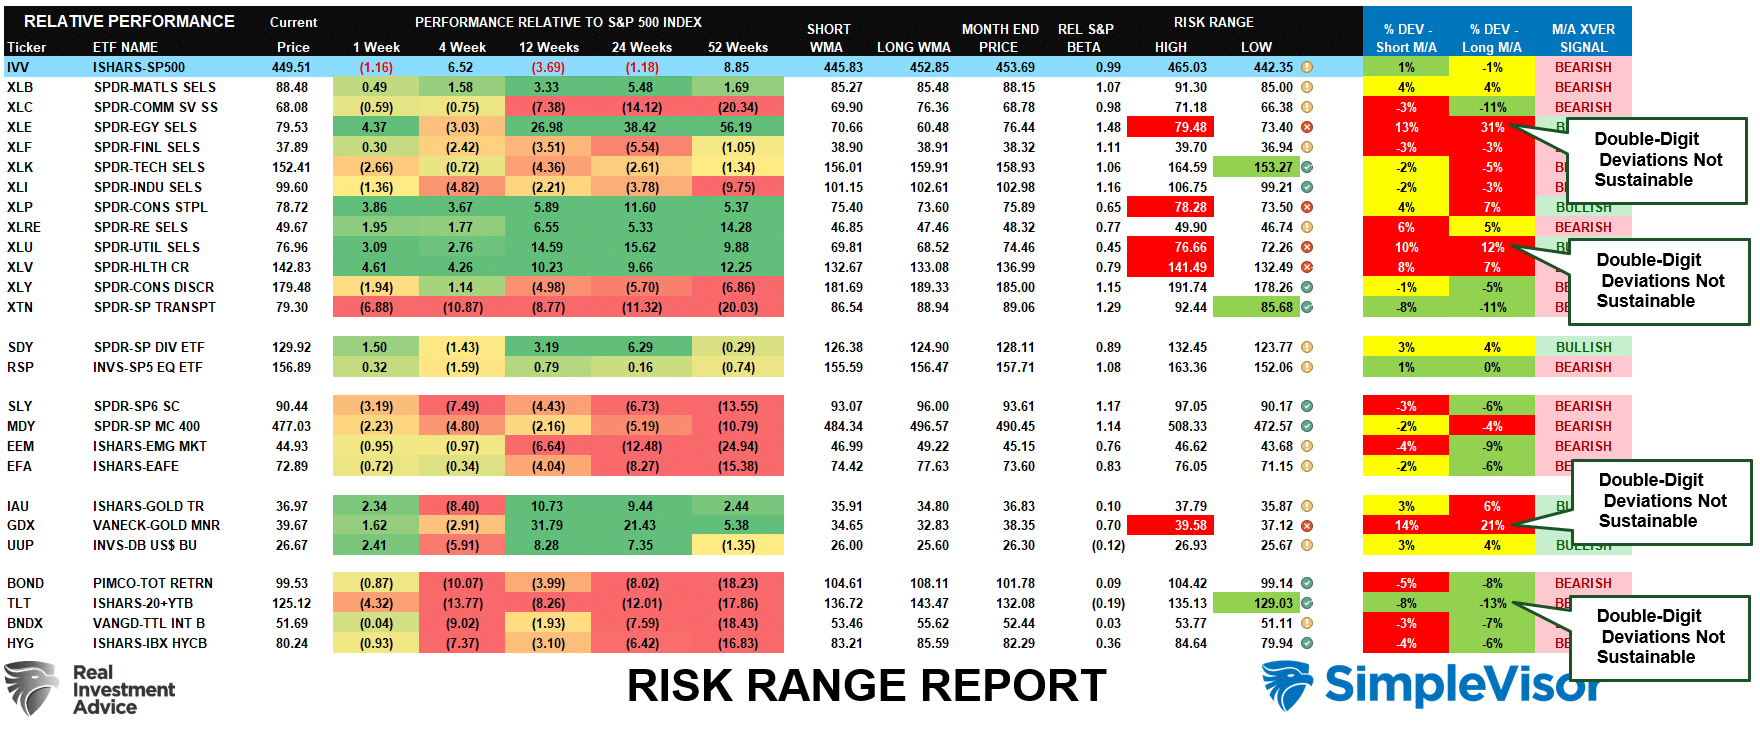
Sector Model Analysis & Risk Ranges
How To Read This Table
- The table compares the relative performance of each sector and market to the S&P 500 index.
- “M/A XVER” is determined by whether the short-term weekly moving average crosses positively or negatively with the long-term weekly moving average.
- The risk range is a function of the month-end closing price and the “beta” of the sector or market. (Ranges reset on the 1st of each month)
- The table shows the price deviation above and below the weekly moving averages.
- The complete history of all sentiment indicators is under the Dashboard/Sentiment tab at SimpleVisor.
Weekly Stock Screens
Each week we will provide three different stock screens generated from SimpleVisor: (RIAPro.net subscribers use your current credentials to log in.)
This week we are scanning for the Top 20:
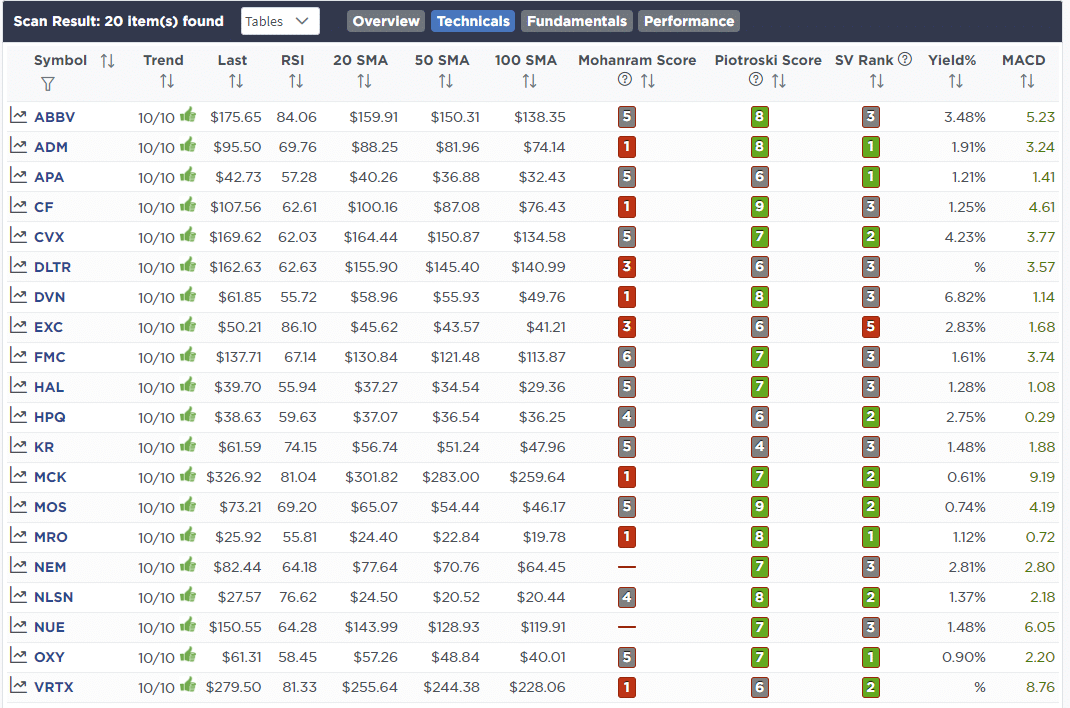
- Relative Strength Stocks
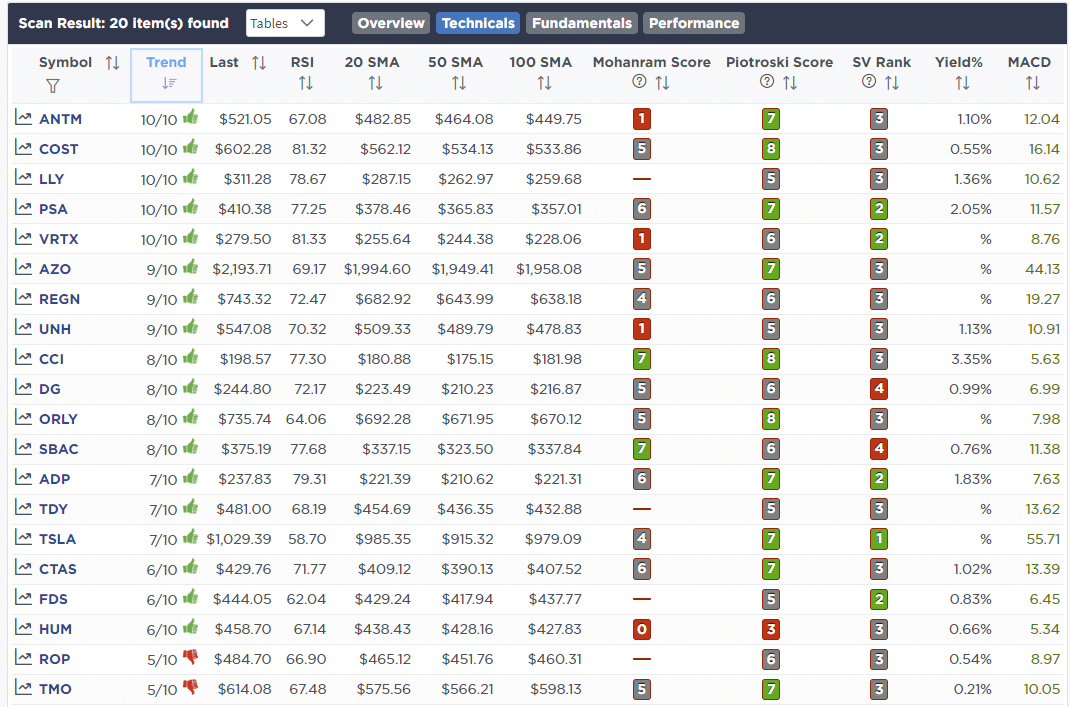
- Momentum Stocks
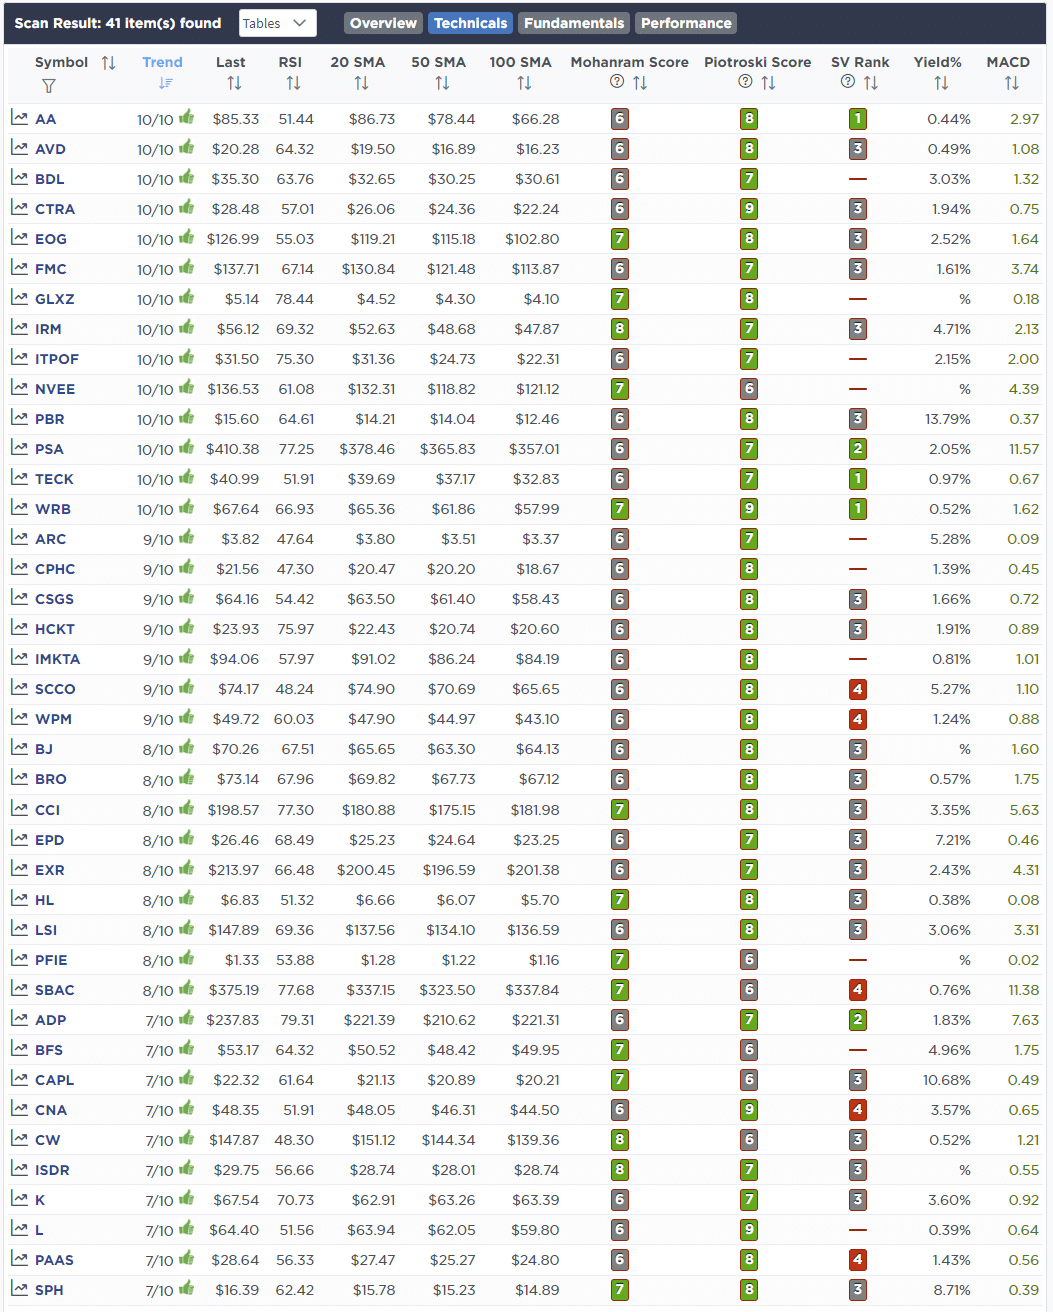
- Technically Strong With Strong Fundamentals
These screens generate portfolio ideas and serve as the starting point for further research.
(Click Images To Enlarge)
RSI Screen
Momentum Screen
Technical & Fundamental Strength Screen
SimpleVisor Portfolio Changes
We post all of our portfolio changes as they occur at SimpleVisor:
No portfolio changes this week.

Lance Roberts, CIO
Have a great week!


