Profit Growth And Stock Returns – The End Of An Era?


Inside This Week’s Bull Bear Report
- Market Review & Update
- Profit Growth And Stock Returns – End Of An Era?
- How We Are Trading It
- Research Report – Market Cycles And Why The Bull Isn’t Dead
- Youtube – Before The Bell
- Market Statistics
- Stock Screens
- Portfolio Trades This Week
Market Review & Update
As we enter Q2 earnings season, we will discuss profits, earnings, and stock market returns in greater detail in the coming weeks. However, the big news this past week was the drop in the CPI inflation gauge, which sent stocks higher, breaking out of the recent trading range over the last couple of weeks.
As noted last week:
“With bullish optimism quickly returning to the market, the pressure to chase performance from the ‘Fear Of Missing Out’ will continue to provide a ‘bid’ under stocks.”
This past week, that bullish sentiment expanded further as softer-than-expected readings of both CPI and PPI provided the “hope” that the Fed will now be “one and done” following the upcoming July FOMC meeting. However, while the bulls are hopeful that the end of rate hikes will support the bullish rally, the disinflation in both CPI and PPI suggests earnings will be weaker than analysts’ current expectations.
The problem for the bulls in the future is that falling inflation eats into both revenue and earnings. Such will make it more difficult for the market to continue to run higher if earnings and profits remain under pressure. The other problem with earnings and profits going forward, long term, is the topic of today’s message.
Technical Update
However, before we get to that, in the short term, the technical backdrop of the market remains bullish. As we kick off earnings season, there will be a high beat rate of estimates, given the deep preceding cuts, which will support the bullish view. The market is back to overbought levels in the short term and remains well extended above longer-term moving averages. A correction back to the 200-DMA would entail a 10.5% decline. With the MACD “buy signal” triggered, albeit at an elevated level, it continues to suggest higher prices in the near term, although likely somewhat more limited.
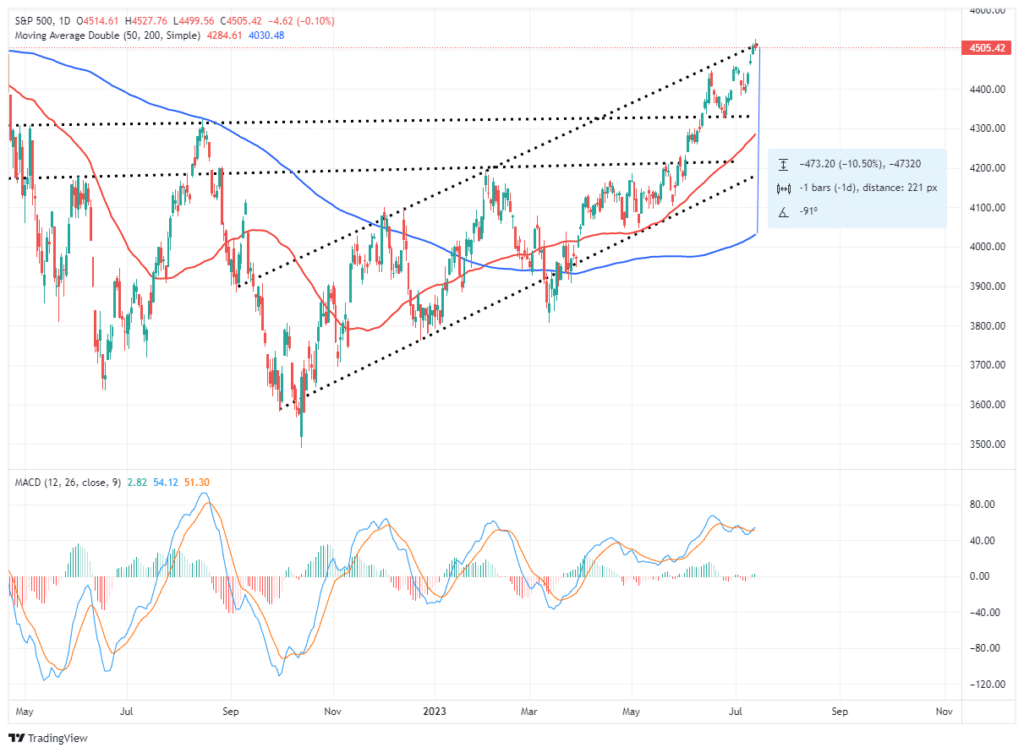
With the bullish F.O.M.O. increasing, analysts are now eyeing new “all-time highs” by year-end. While such an outcome is becoming much more probable, it is still likely we will see a 3-5% correction first to allow a better entry risk-reward entry point to add exposure. The problem is the “being patient” part when the market seems as if “it just won’t stop going up.”
Such is usually about the time that it does.
Need Help With Your Investing Strategy?
Are you looking for complete financial, insurance, and estate planning? Need a risk-managed portfolio management strategy to grow and protect your savings? Whatever your needs are, we are here to help.

Profit Growth & Future Stock Returns
This past week, Michael Lebowitz, CFA, wrote a compelling piece discussing a recent white paper by the Federal Reserve warning of “significantly lower profit growth and stock returns in the future.” In the Fed’s article, End of an Era: The coming long-run slowdown in corporate profit growth and stock returns, Michael Smolyansky analyzed how the interest rate and corporate tax rate trends for the last 30 years provided a strong tailwind for corporate profits. The unsurprising result of lower interest and tax rates was that stocks performed better than would have otherwise been the case.
As Michael Lebowitz noted in his latest article:
“Understanding why corporate profits and stock prices outperformed in the past is important. However, more critical for investors is the future and assessing how interest rates and tax rates will affect earnings growth and stock prices.“
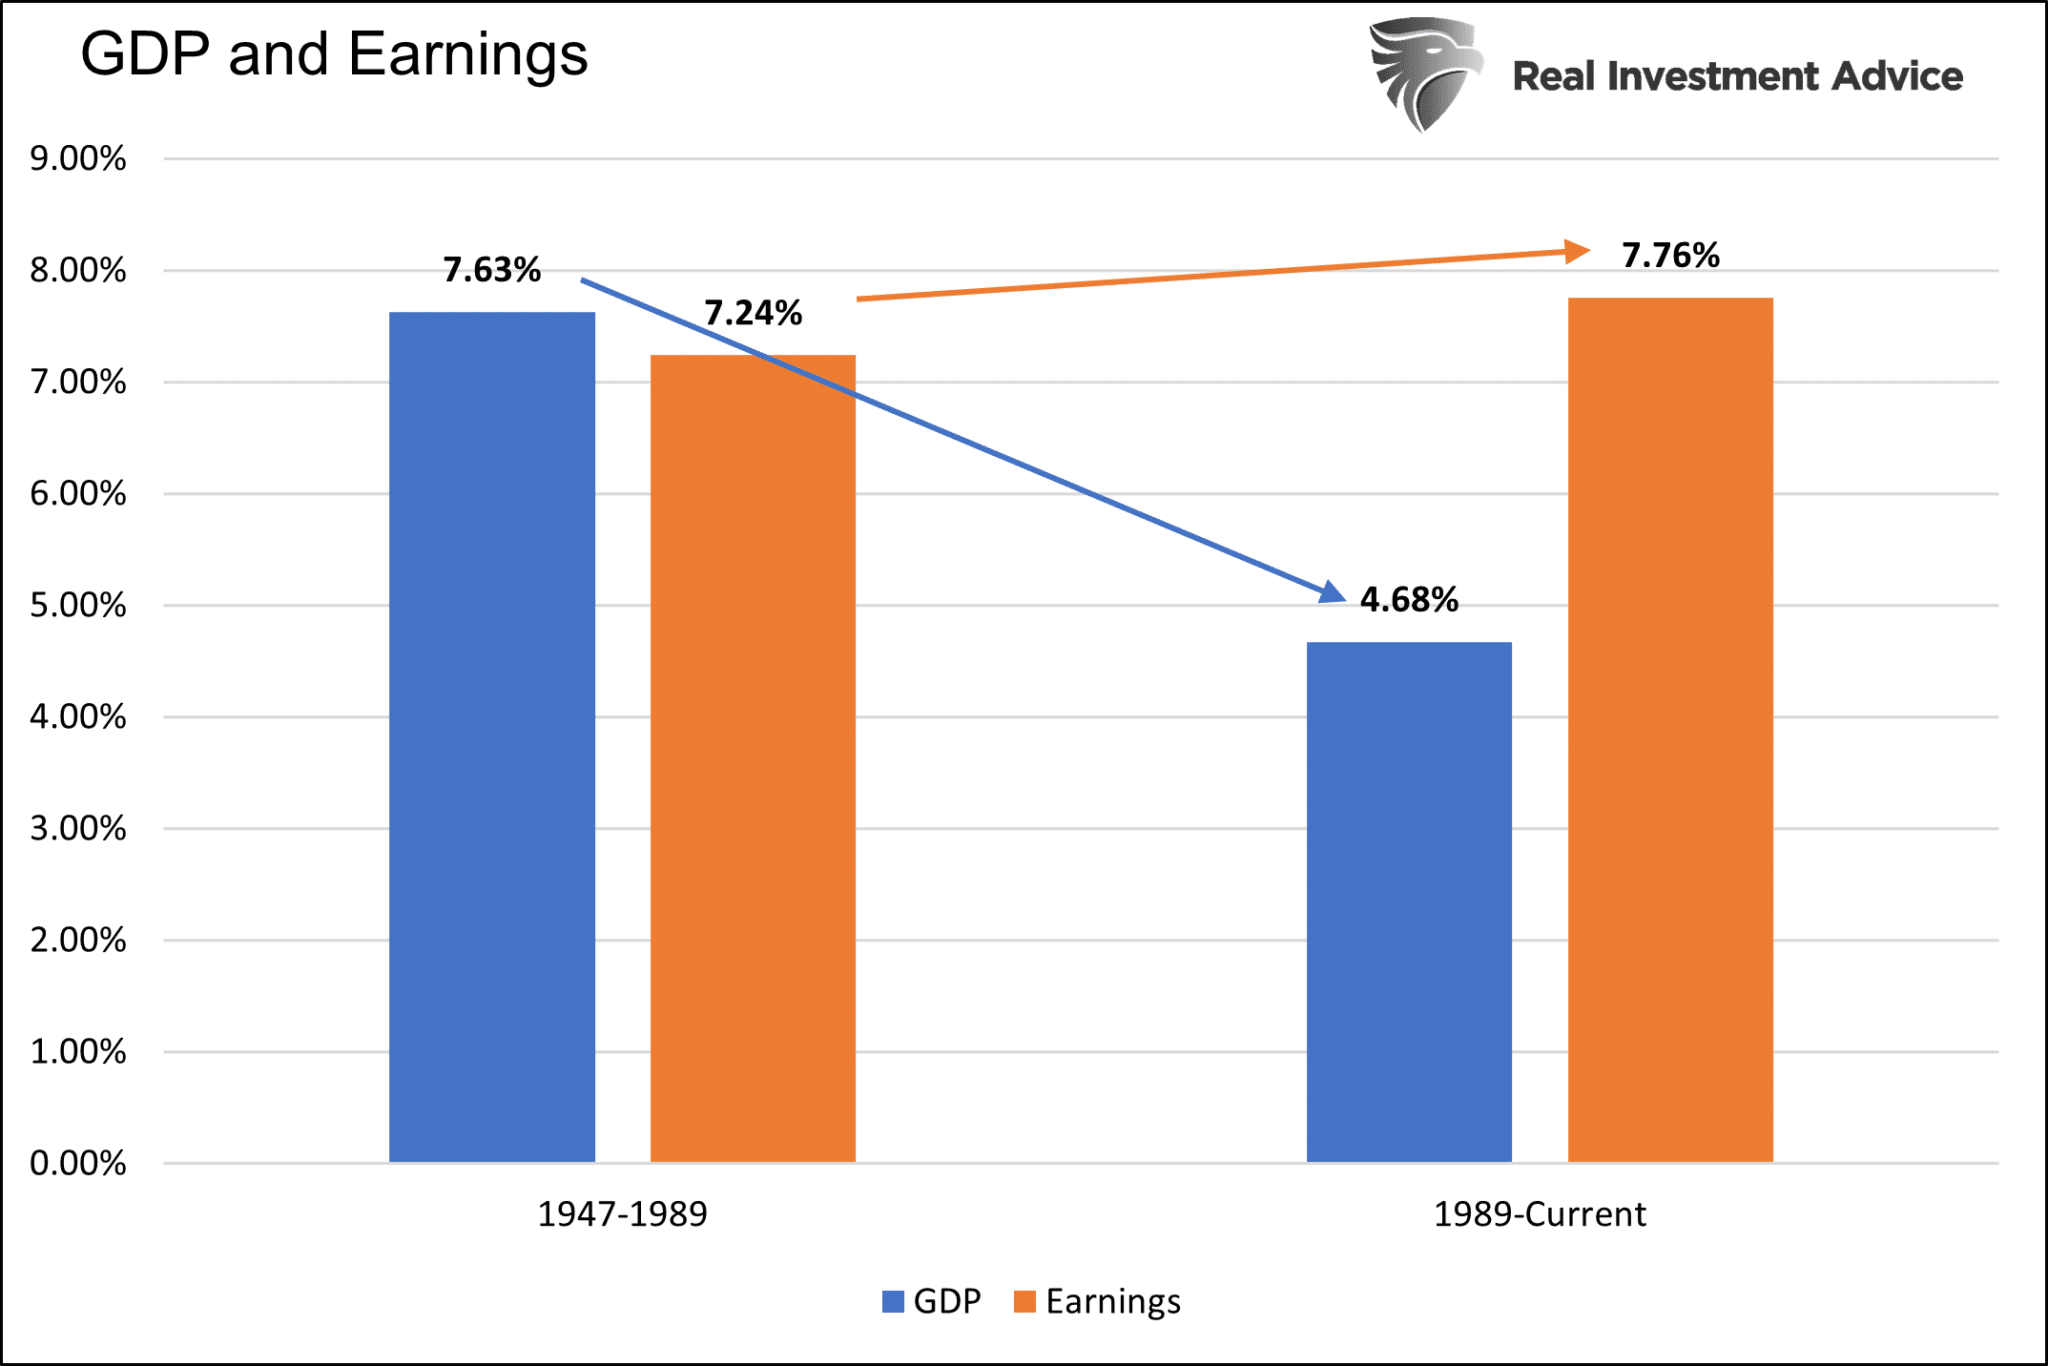
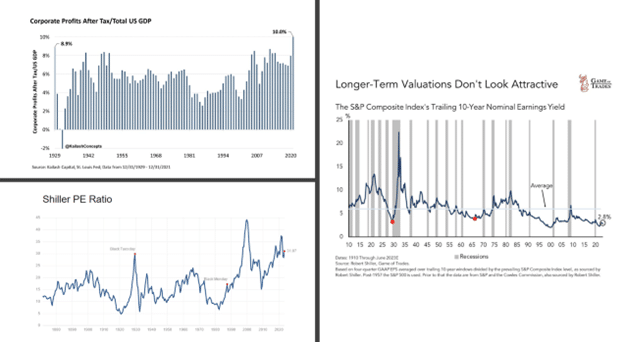
The obvious question, which Michael Lebowitz analyzes, is whether or not corporate profits can maintain recent growth trajectories without the benefit of lower interest and tax rates. The graph below shows that corporate earnings have grown faster over the last 30 years than in the 40 years before. The robust earnings growth occurred despite economic growth shrinking markedly.
The Fed’s article attributes two key factors to explain the significant disconnect between the two growth rates. Per the article:
My central finding is that the 30-year period prior to the pandemic was exceptional. During these years, both interest rates and corporate tax rates declined substantially. This had the mechanical effect of significantly boosting corporate profit growth. Specifically, I find that the reduction in interest and corporate tax rates was responsible for over 40 percent of the growth in real corporate profits from 1989 to 2019.
As Michael notes:
“Corporate profits would have grown by 4.50%, not 7.76% annually, without the boost from interest rates and taxes, assuming his 40% contribution calculation is correct. Such would be on par with GDP growth for the last thirty years. As we share later, it appears 40% is a reasonable estimate.”
The 40% differential is explained by lower interest and corporate tax rates.
Lower Rates & Taxes
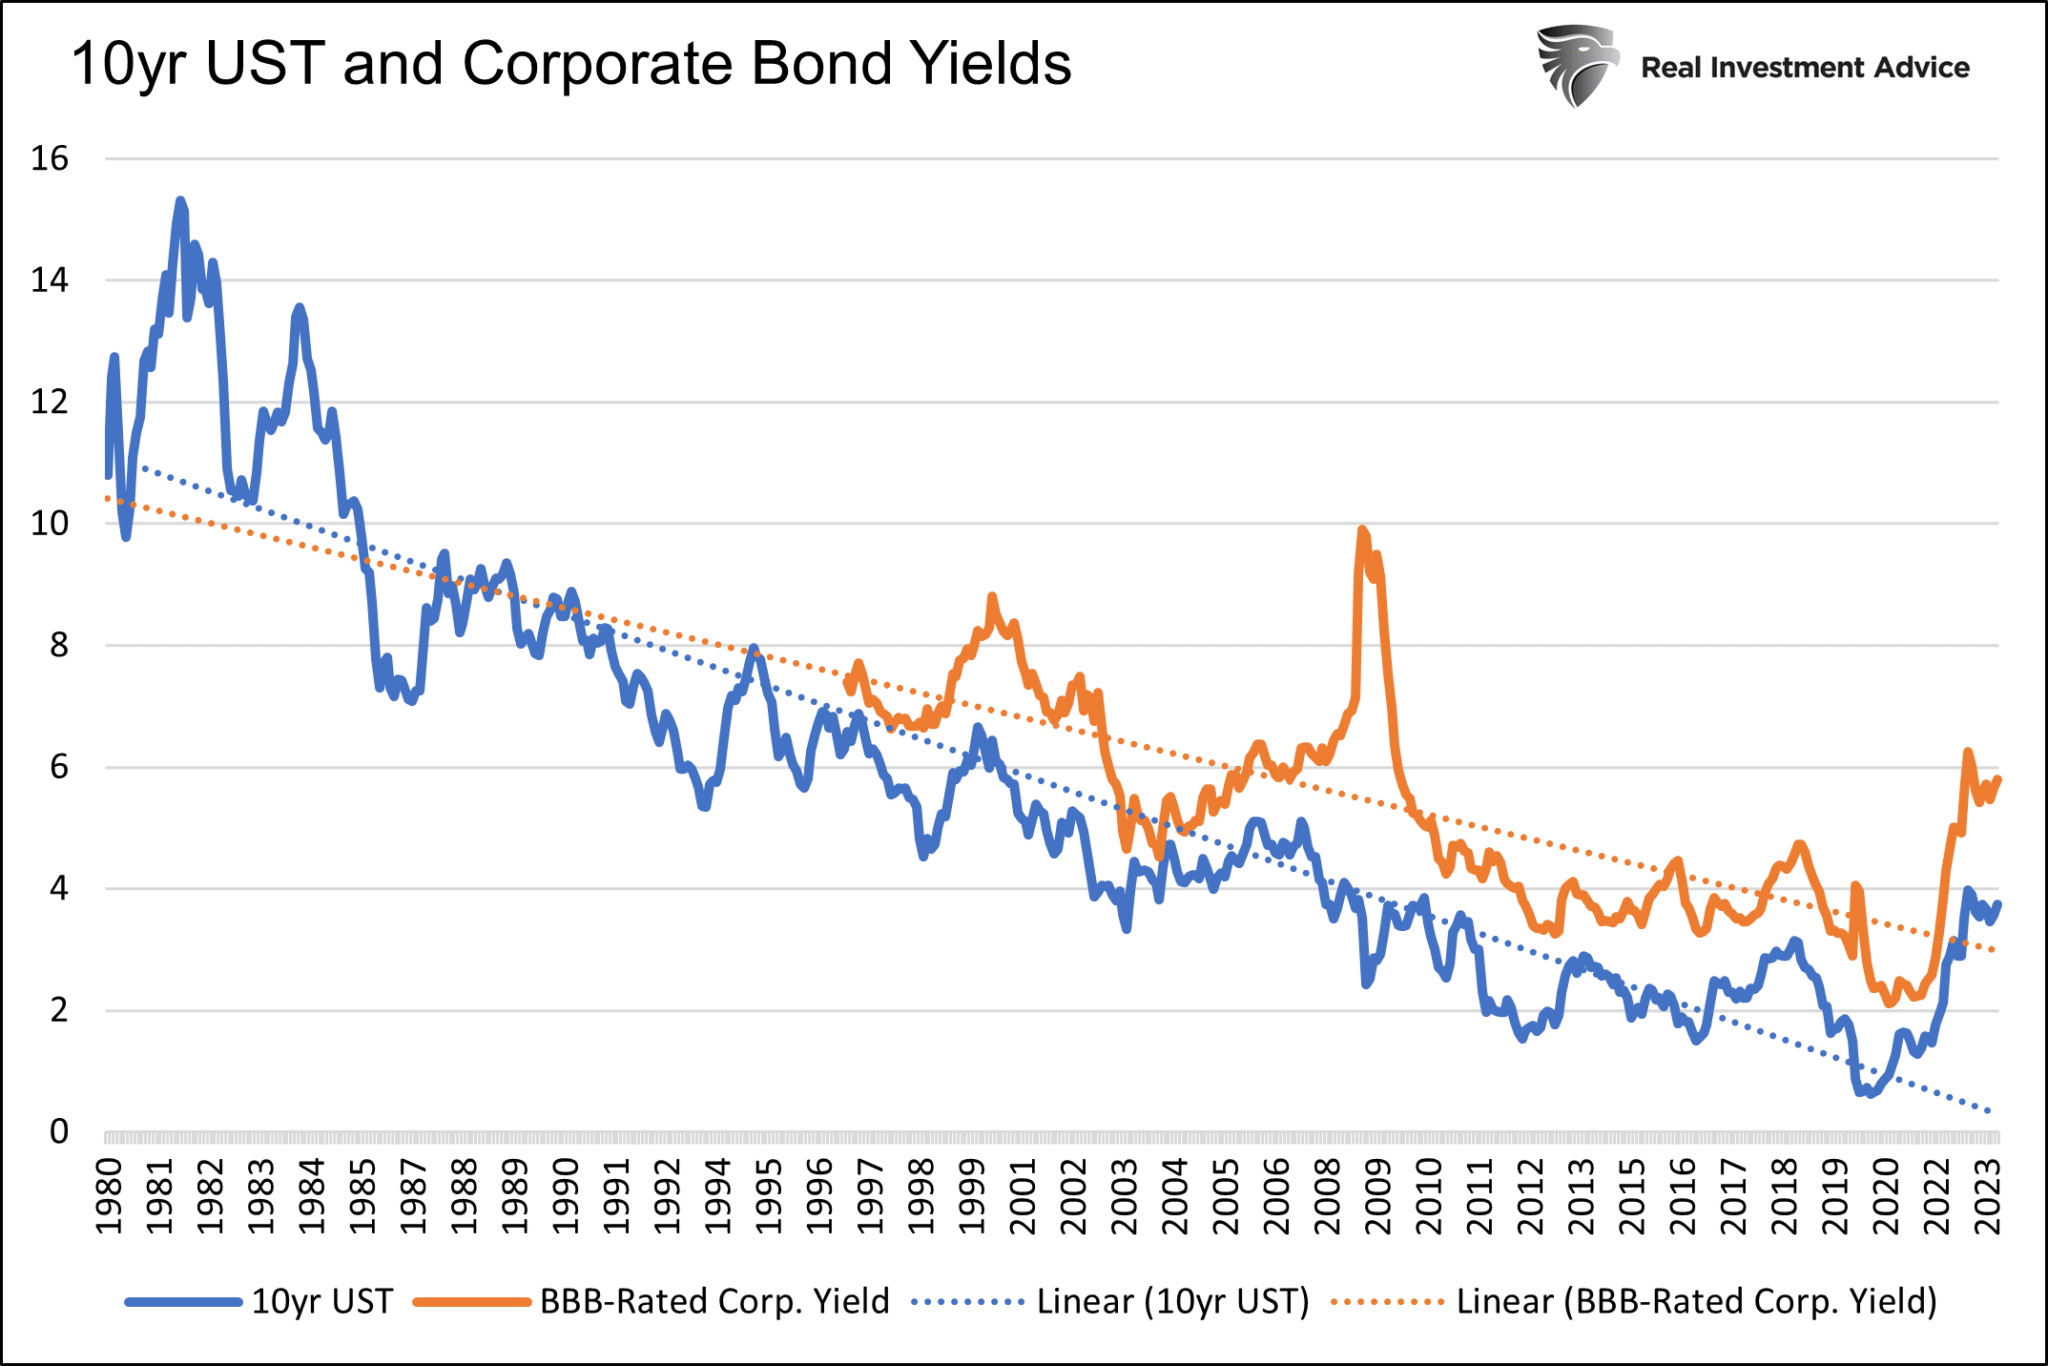
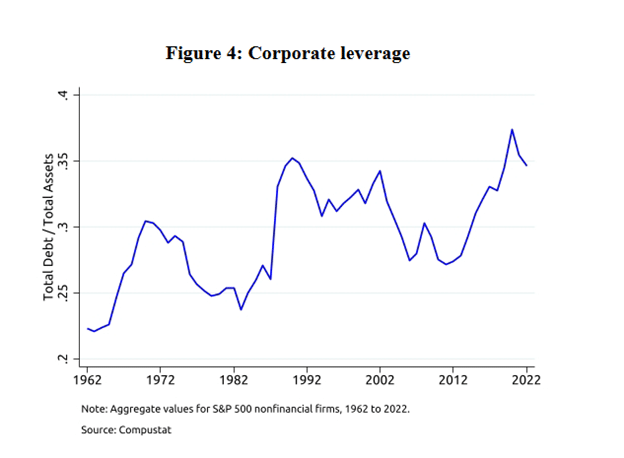
As shown below, Treasury and corporate interest rates have fallen steadily over the last thirty years. As a result of cheap financing, corporate leverage, per the second graph below, has risen substantially to record highs. More leverage and reduced interest costs are a bona fide way to boost profits.
Per the Fed’s article:
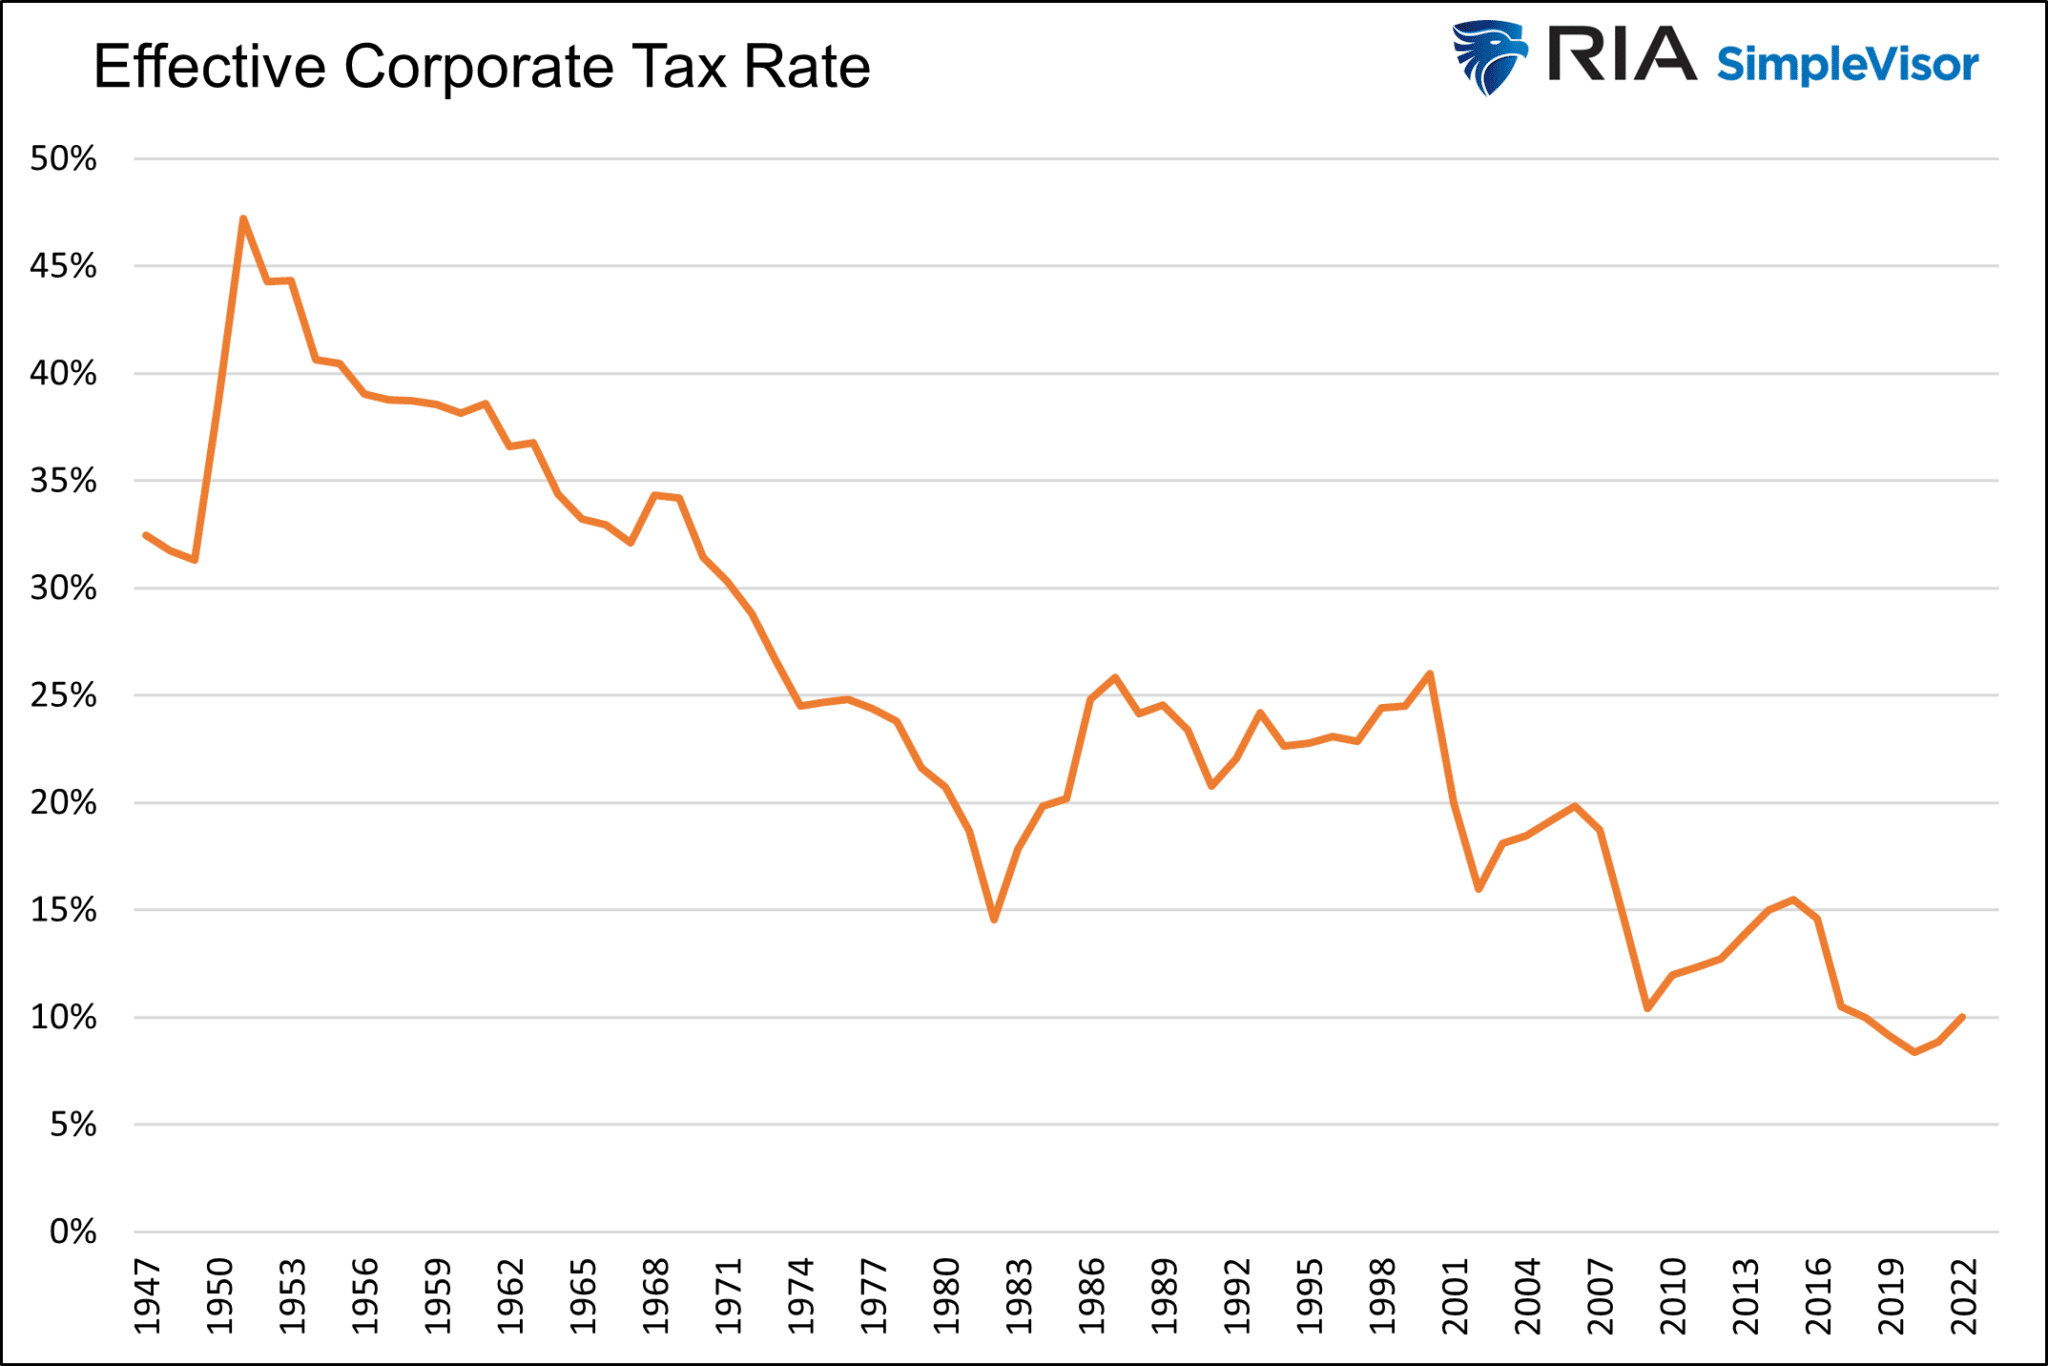
By 1989, the effective corporate tax rate—measured as aggregate tax expenses divided by aggregate pre-tax income—stood at 34 percent, having fallen from an average of 44 percent over the period 1962 to 1982. From 1989 to 2007, ending just prior to the financial crisis, effective corporate tax rates averaged 32 percent. They then drifted somewhat lower in the years immediately following the financial crisis. The next major step down occurred following the passage of the Tax Cuts and Jobs Act of 2017, which cut the statutory corporate tax rate from 35 percent to 21 percent. With this reform, effective corporate tax rates fell from 23 percent in 2016 to 15 percent in 2019.
The graph below shows effective corporate tax receipts as a percentage of pre-tax income are now around 10% versus 25% in the late 1980s.
Unsurprisingly, cheaper financing costs and lower tax rates lead to a substantial boost in corporate profitability. Michael Lebowitz profiles three high-profile, blue-chip companies to prove the Fed’s analysis.
Proof Is In The Pudding
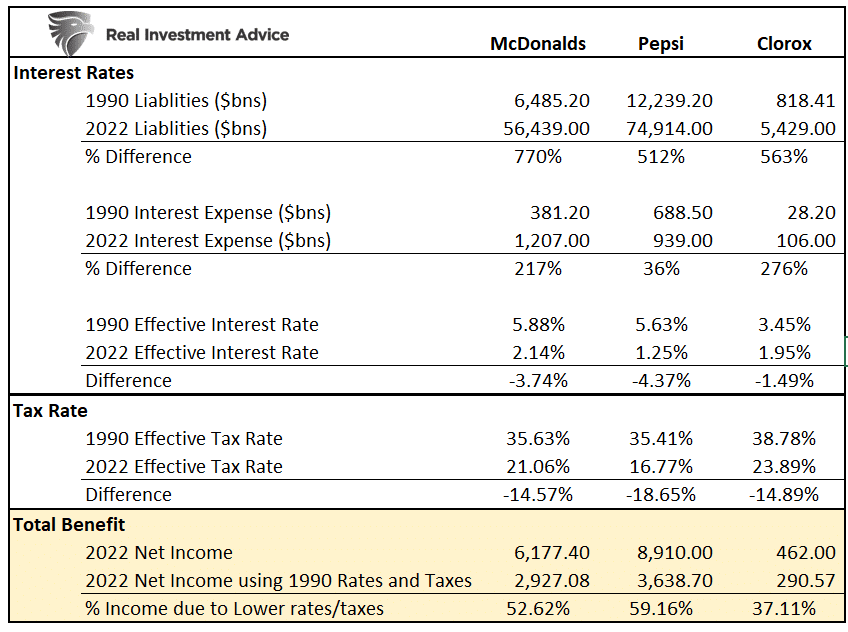
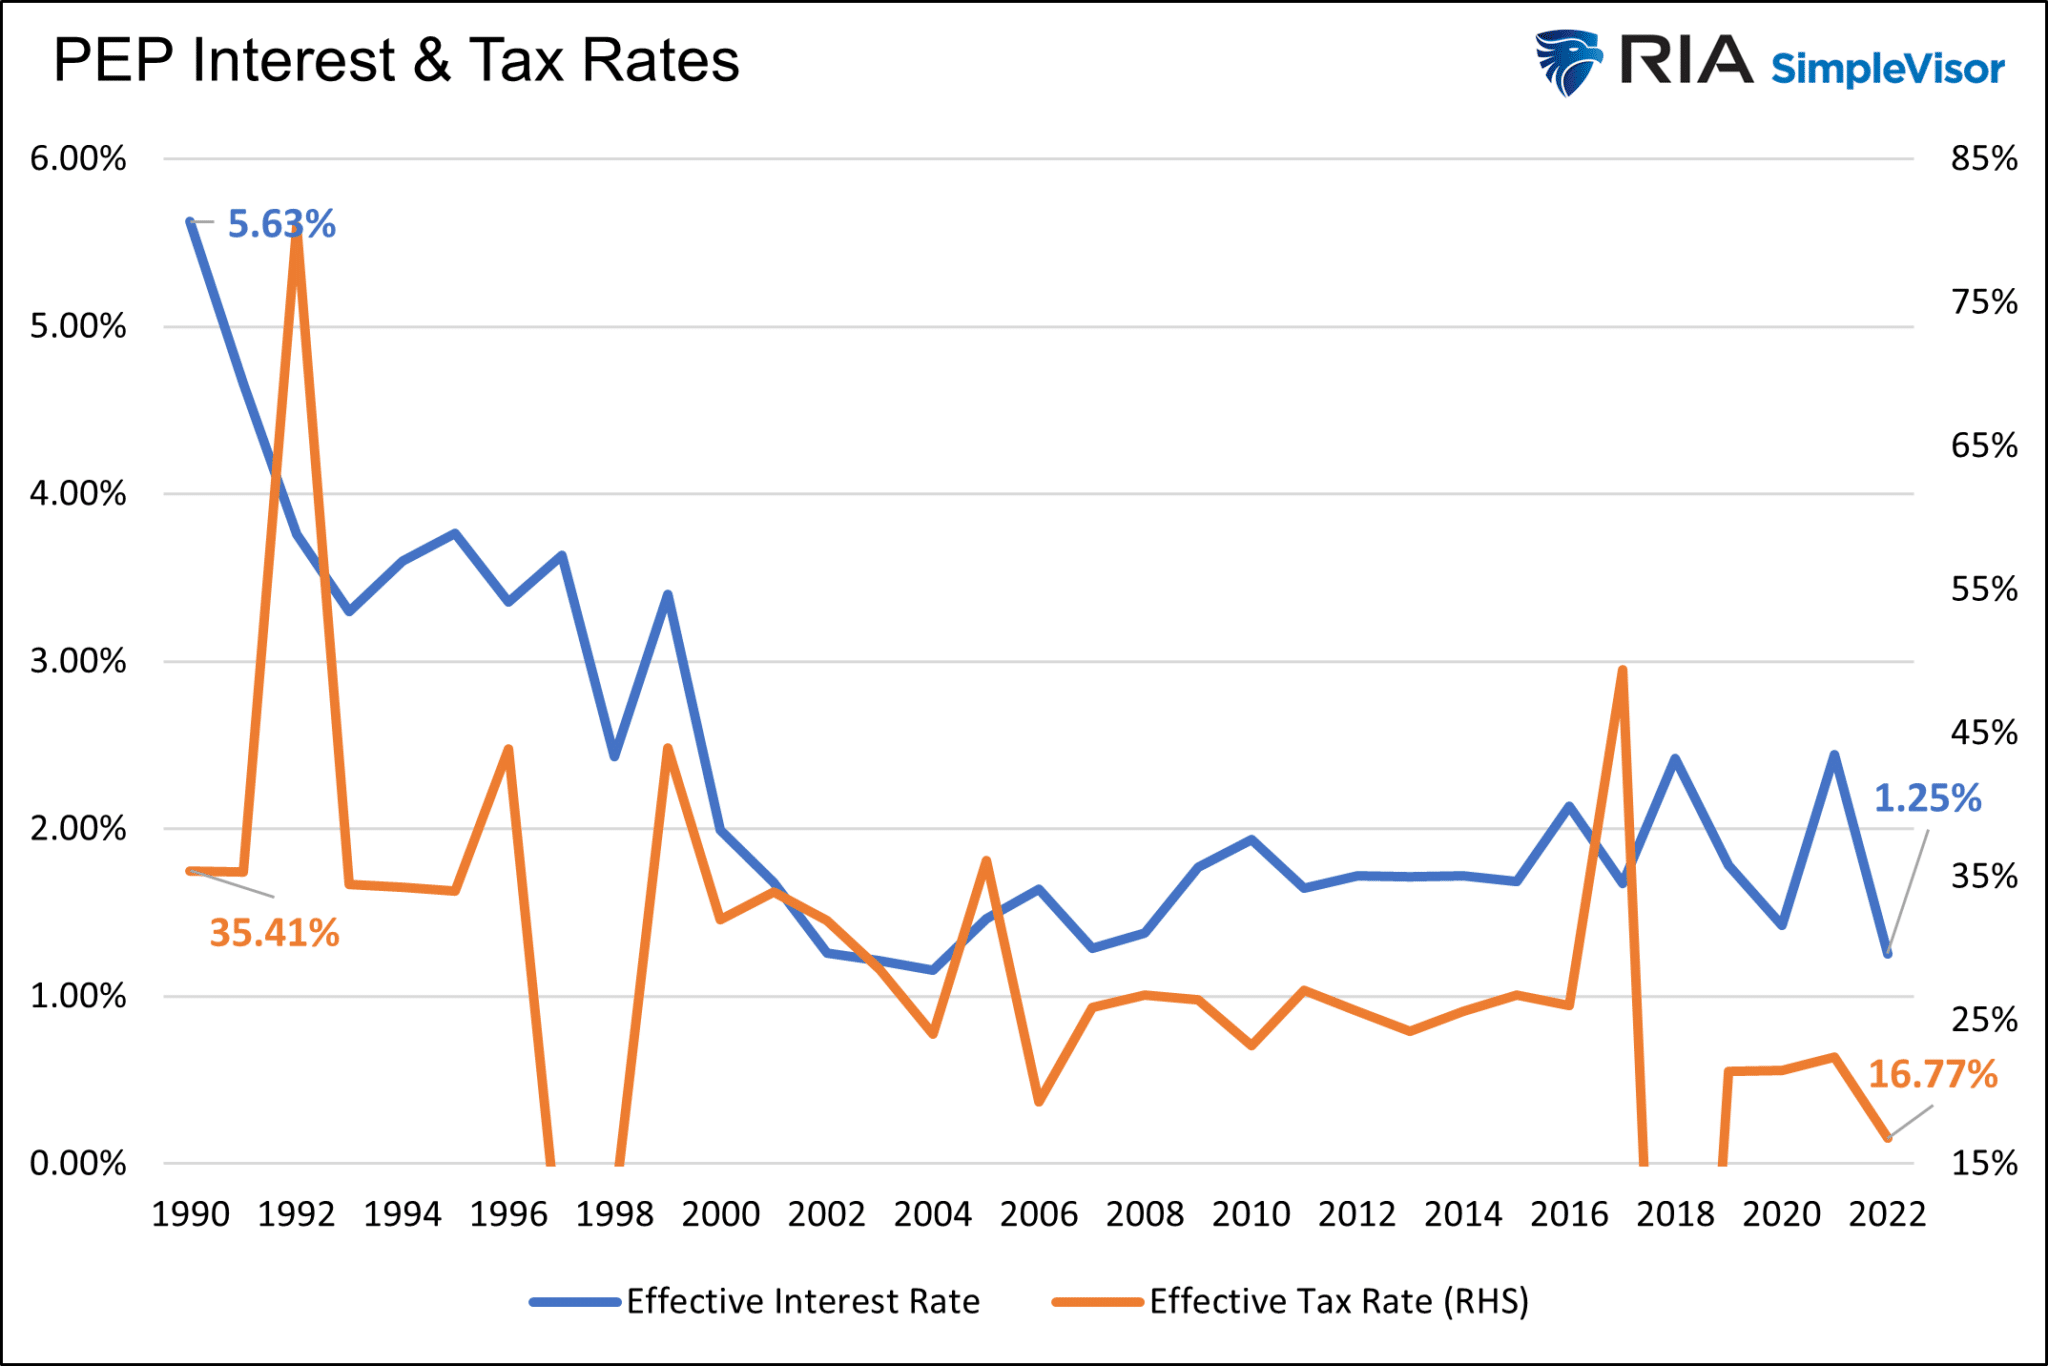
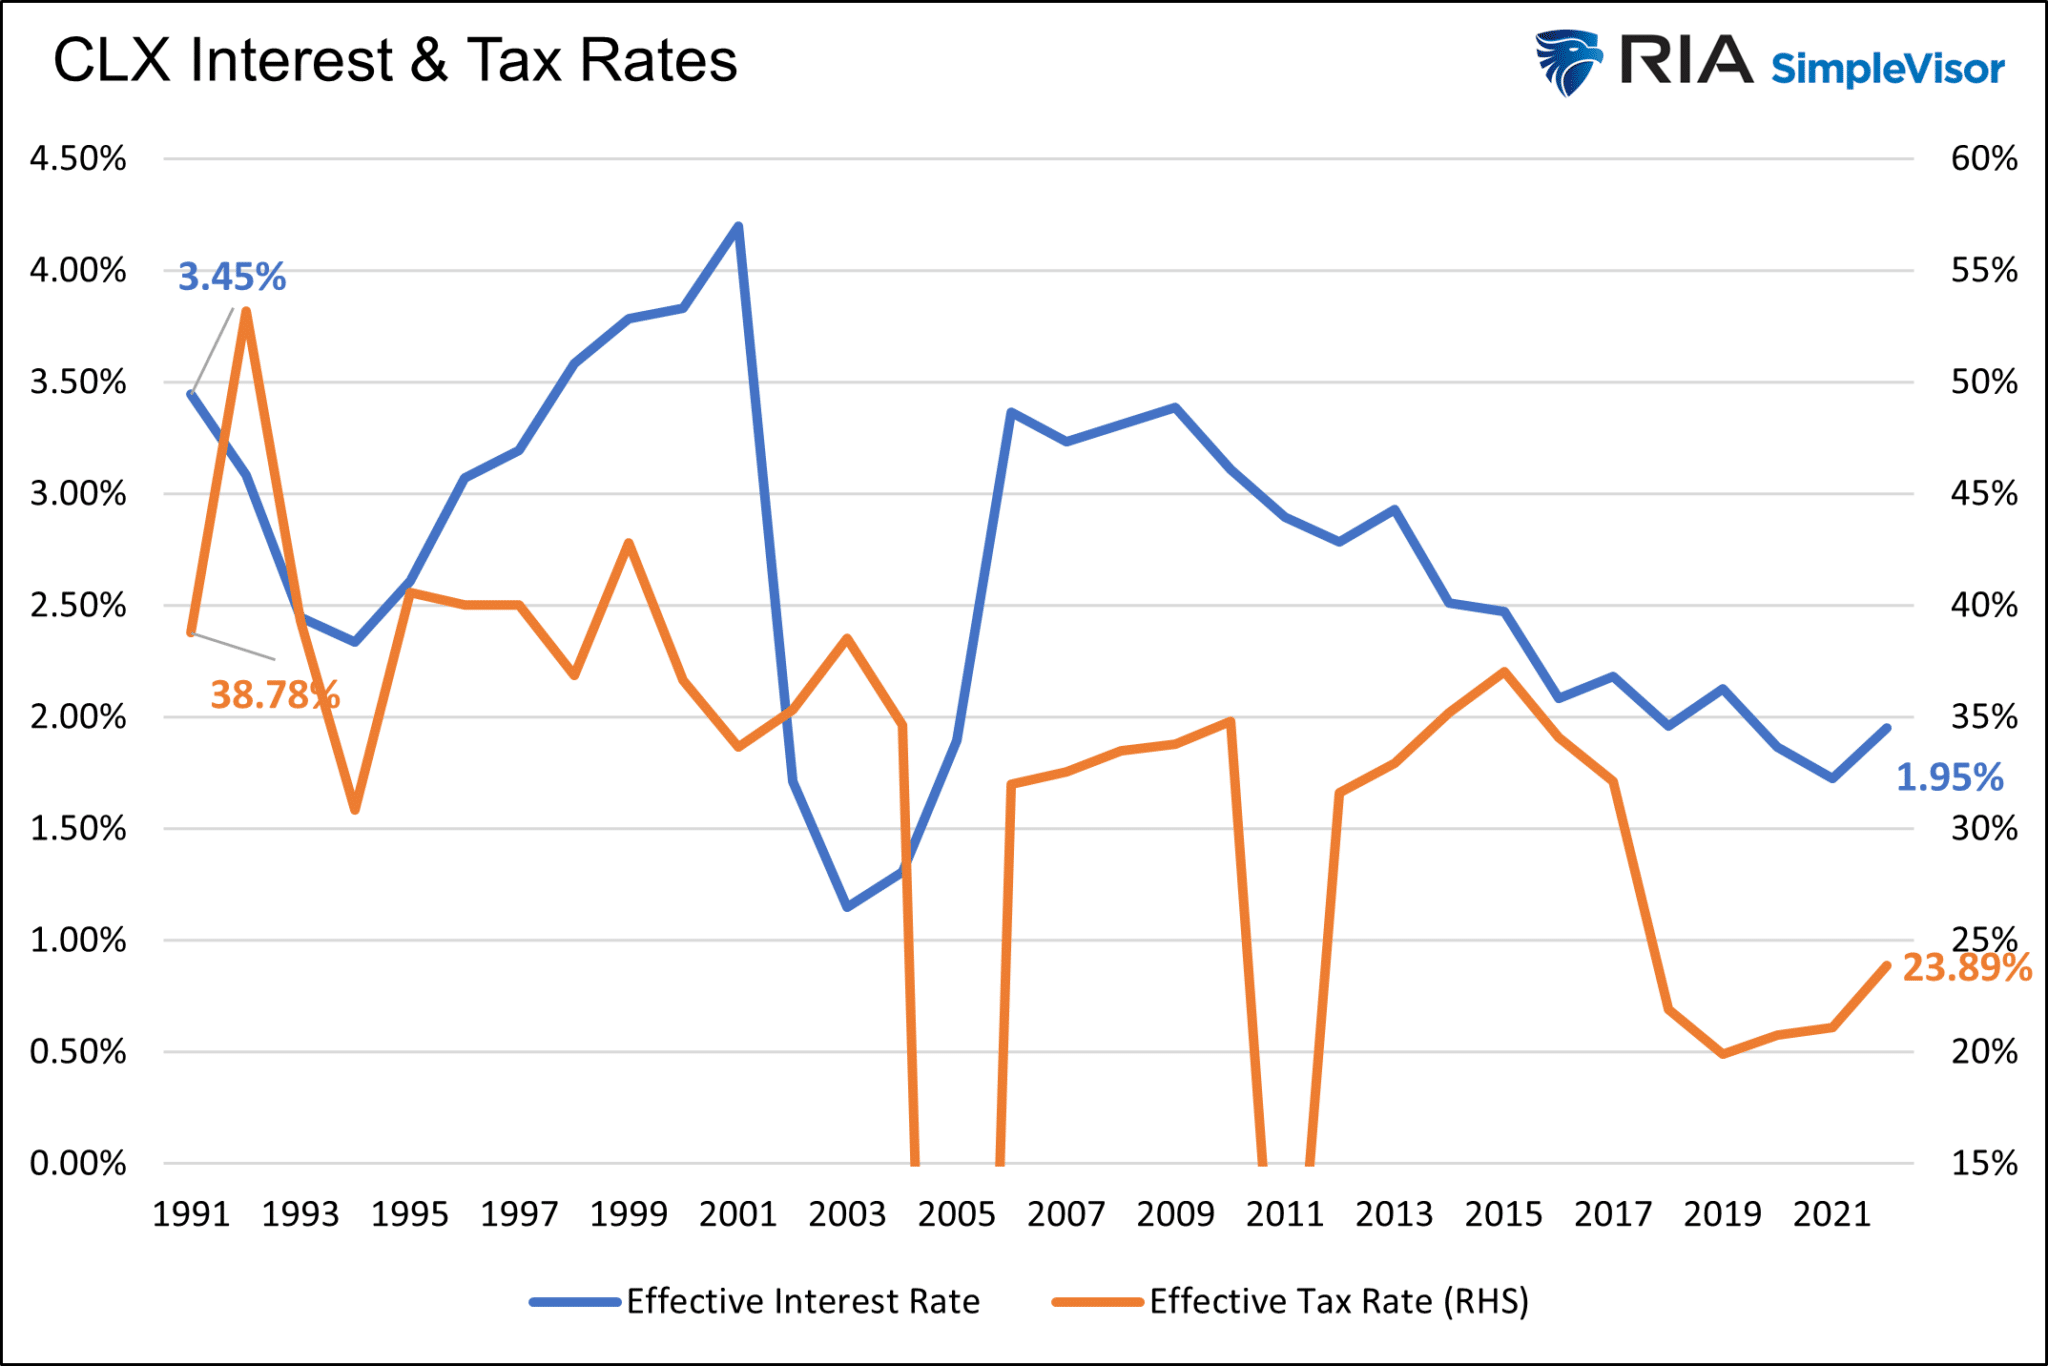
“To prove the benefit of lower interest and tax rates, we calculate how they helped improve profits for three large, well-known companies. The table below compares the debt levels, interest, and effective tax rates from 1990 to 2022 for McDonald’s, Pepsi, and Clorox.
All three companies increased their debt load much more than their interest expenses due to lower rates. The effective interest rate decline was significant for McDonald’s and Pepsi. While not as dramatic, Clorox had a meaningful decline. Similarly, the effective tax rates for the companies fell between 15% and 20%.
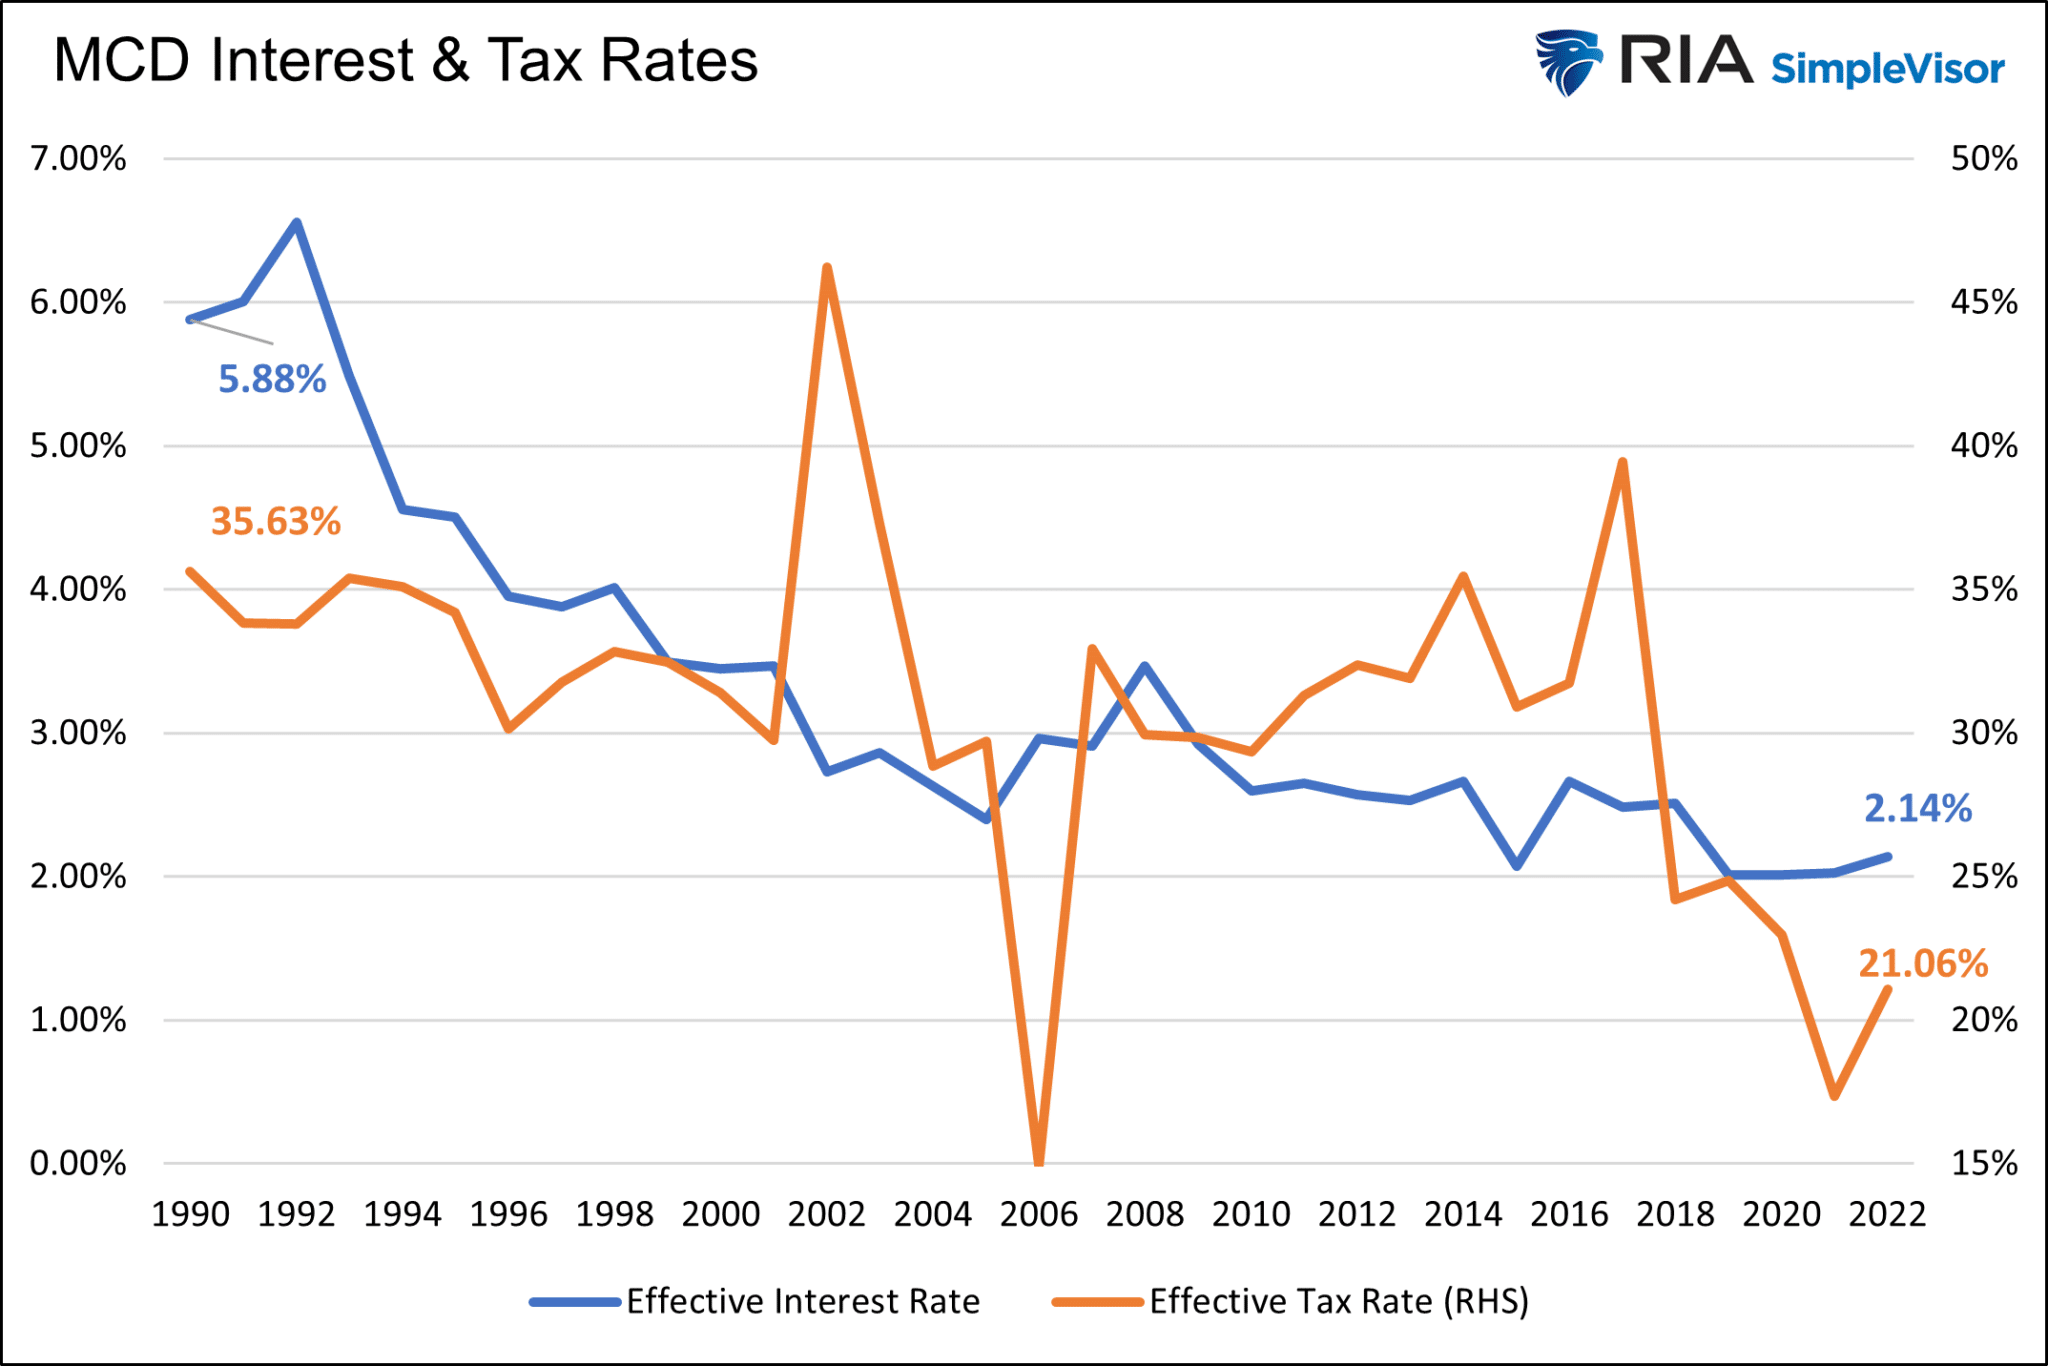
Lower interest and tax rates had a meaningful impact on earnings, as shown at the bottom of the table. Michael Smolyansky’s estimate that interest and tax rates boosted earnings by about 40% in aggregate seems to be in the ballpark with our analysis. The graphs below the table show the change in interest and tax rates for the three companies over the last 30 years.” – Michael Lebowitz, CFA
The End Of An Era For Corporate Profits?
“While lower interest and tax rates boosted growth significantly, the ability for that to continue is negligible. The end of a rewarding era for stocks is likely behind us. Given that government deficits will continue to grow faster than the economy, it becomes increasingly unlikely that the government can afford to reduce corporate taxes. In fact, the odds favor raising taxes. Interest rates may fall back to the low levels of the last ten years. Still, unless rates go negative, there is little room on the margin for corporations to reduce their effective interest rate meaningfully.
Consequently, its likely corporate profit growth in aggregate will be closer to GDP growth rates in the future. The gap between GDP and profits we highlighted at the article’s opening will likely close. 4%’ish profit growth isn’t bad. But current high valuations are predicated on solid profit growth. GDP-like growth is not forecasted and will likely weigh on stock prices. Simply put, investors will not be willing to pay an above-average valuation for what will seem like below-average profit growth.” – Michael Lebowitz, CFA
Per the Fed’s End of an Era article:
“It may be tempting to assume that the exceptional stock market performance over the last three decades will continue indefinitely. My analysis, however, indicates otherwise. Both stock returns and corporate profit growth are very likely to be substantially lower in the future. This conclusion follows from the minimal assumption that interest rates and effective corporate tax rates have very little scope to fall below 2019-levels.“
The tailwinds of the last thirty years propelling profit growth by about 3% more than GDP are likely over. Without said help, profits are likely to track nominal GDP. However, we must remember that higher interest and tax rates are not out of the question. 4% profit growth may be the upside with a meaningful downside if interest rates stay around current levels and or tax rates increase.
The question is whether investors will not be willing to pay an above-average valuation for what will seem like below-average profit growth.
How We Are Trading It
This week’s analysis by Michael Lebowitz is essential to consider. However, it will play out over the next two decades and not in the next year or two. As is always the case, valuations are terrible market timing tools but strong indicators of future returns. As investors, we must manage the short-term market swings driven by liquidity and sentiment. However, that positioning must also get balanced against the long-term fundamental market supports.
This past week, as noted above, the weaker inflation print gave the bulls another reason to increase equity exposure on the continued hope that weaker inflation data will eventually lead to lower interest rates. I am not sure the Federal Reserve agrees with the market views, and the July FOMC meeting could be a face-off event between Jerome Powell and the market bulls.
For now, the bullish trend continues as market participants are anticipated a robust earnings season. The next few weeks could be a “make or break” moment for the bulls, mainly if reality falls short of expectations.
While we have increased our equity exposure over the last three weeks, we remain underweight overall. As I noted last week, while the more cautious positioning will protect the portfolio from any short-term market declines, it also penalizes our performance this year after last year’s significant outperformance. We suspect we will get an opportunity, particularly as we move into 2024, to make up that performance gap and rebalance risk tolerances accordingly. But sometimes, being patient for the right opportunity is the most challenging part of investing.
Continue taking action in portfolios accordingly, depending on your risk tolerance and goals. Just remember that no one ever went broke taking a profit.
Have a great weekend.
Research Report
Subscribe To “Before The Bell” For Daily Trading Updates (Formerly 3-Minutes)
We have set up a separate channel JUST for our short daily market updates. Please subscribe to THIS CHANNEL to receive daily notifications before the market opens.
Click Here And Then Click The SUBSCRIBE Button
Subscribe To Our Youtube Channel To Get Notified Of All Our Videos
Bull Bear Report Market Statistics & Screens

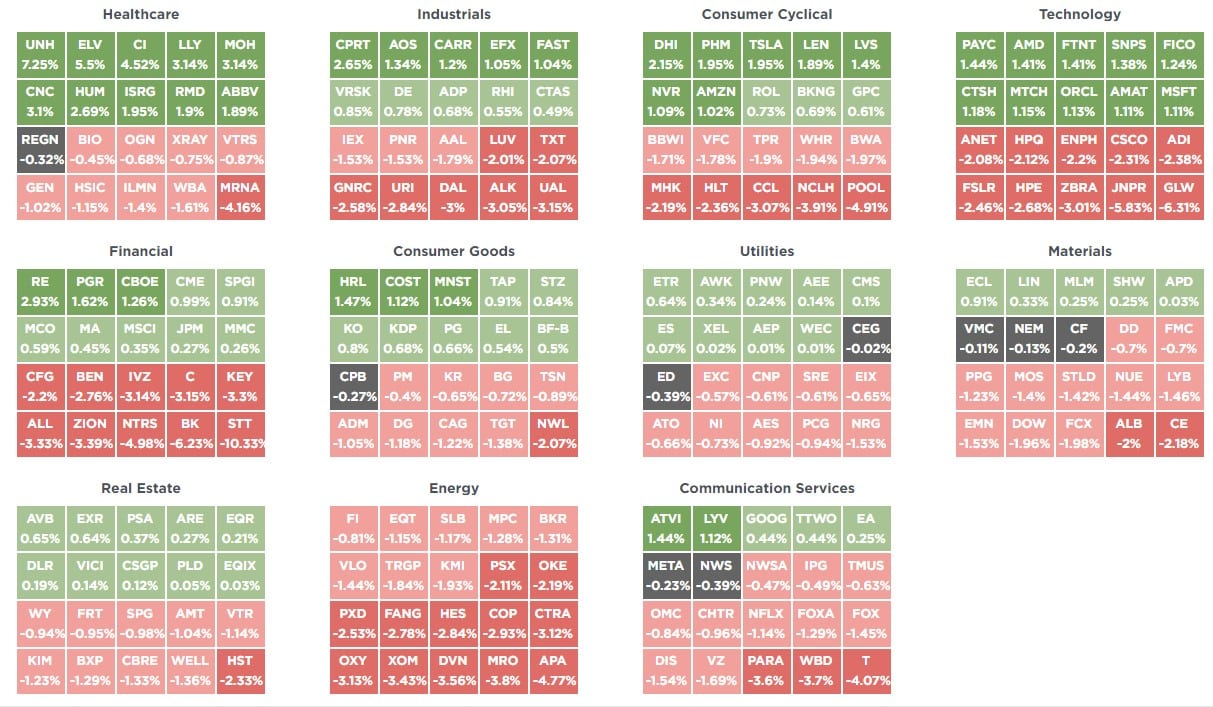
SimpleVisor Top & Bottom Performers By Sector
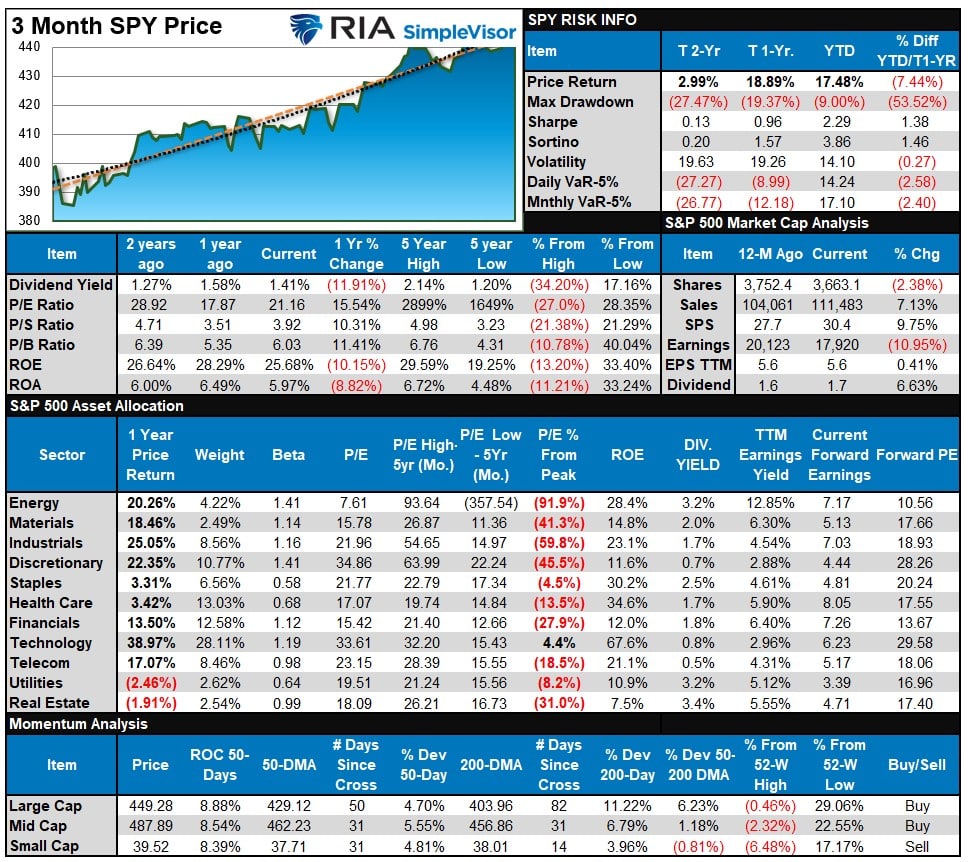
S&P 500 Weekly Tear Sheet
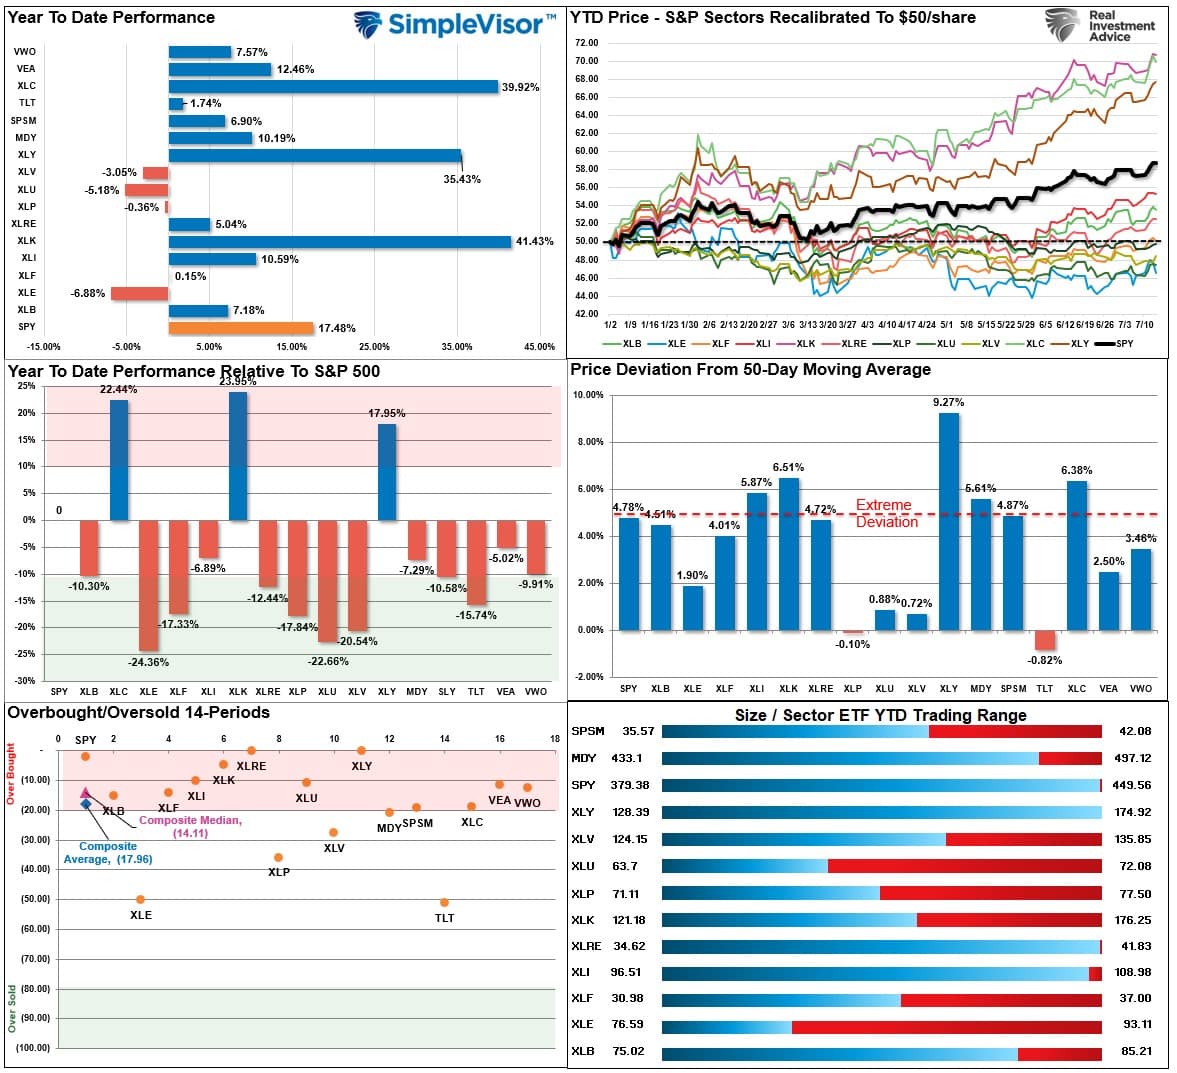
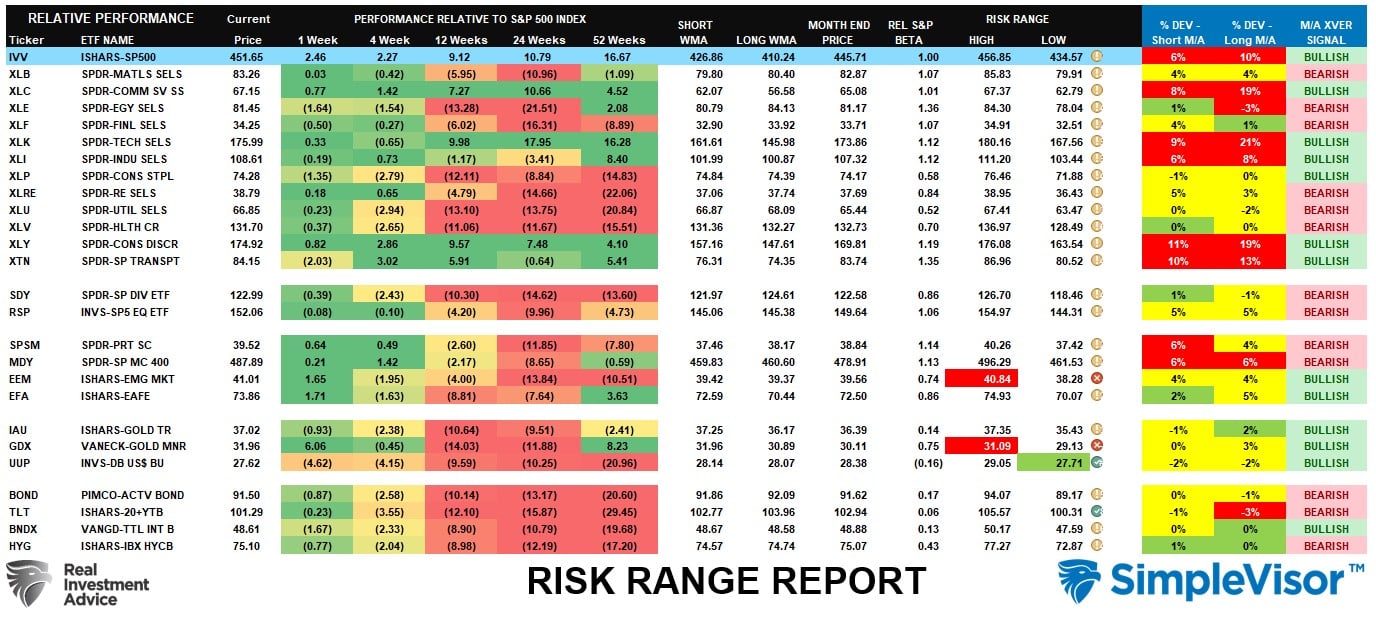
Relative Performance Analysis
Last week we noted the market bounced rather strongly amid high levels of complacency, taking the market to a new 52-week high this past week. However, that bounce pushed much of the broad market complex back into extreme short-term overbought conditions. Such suggests more consolidation is needed, but any dips to support levels should be bought. Three sectors continue to drive performance YTD, mostly comprised of just seven (7) stocks. While the rally has broadened somewhat in recent weeks, most sectors and markets are woefully underperforming the broader market index.
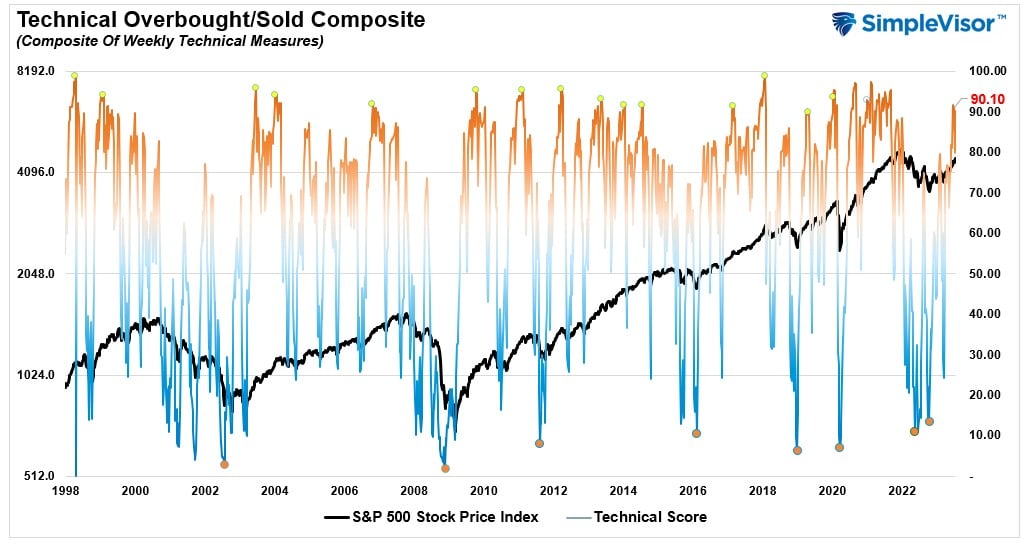
Technical Composite
The technical overbought/sold gauge comprises several price indicators (R.S.I., Williams %R, etc.), measured using “weekly” closing price data. Readings above “80” are considered overbought, and below “20” are oversold. The market peaks when those readings are 80 or above, suggesting prudent profit-taking and risk management. The best buying opportunities exist when those readings are 20 or below.
The current reading is 90.10 out of a possible 100.
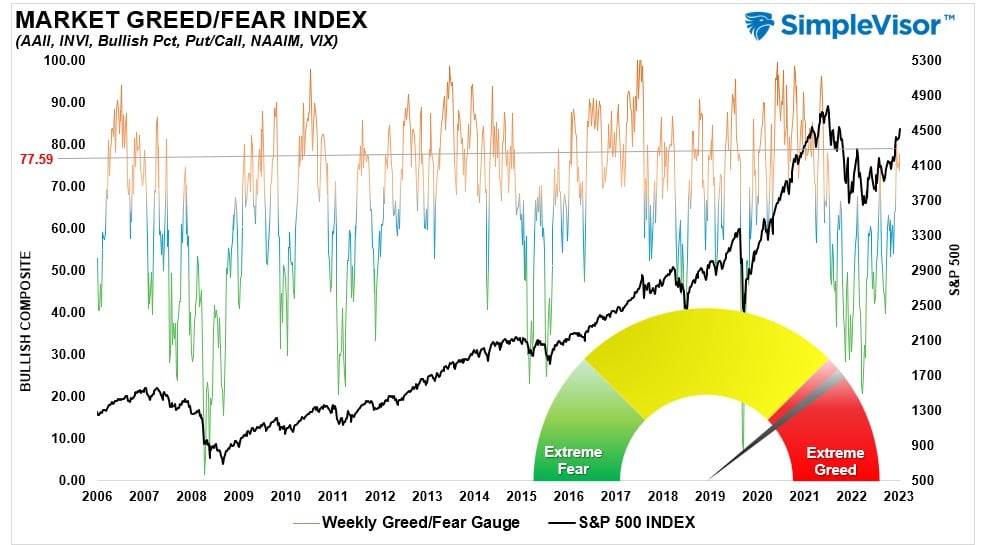
Portfolio Positioning “Fear / Greed” Gauge
The “Fear/Greed” gauge is how individual and professional investors are “positioning” themselves in the market based on their equity exposure. From a contrarian position, the higher the allocation to equities, the more likely the market is closer to a correction than not. The gauge uses weekly closing data.
NOTE: The Fear/Greed Index measures risk from 0 to 100. It is a rarity that it reaches levels above 90. The current reading is 77.59 out of a possible 100.
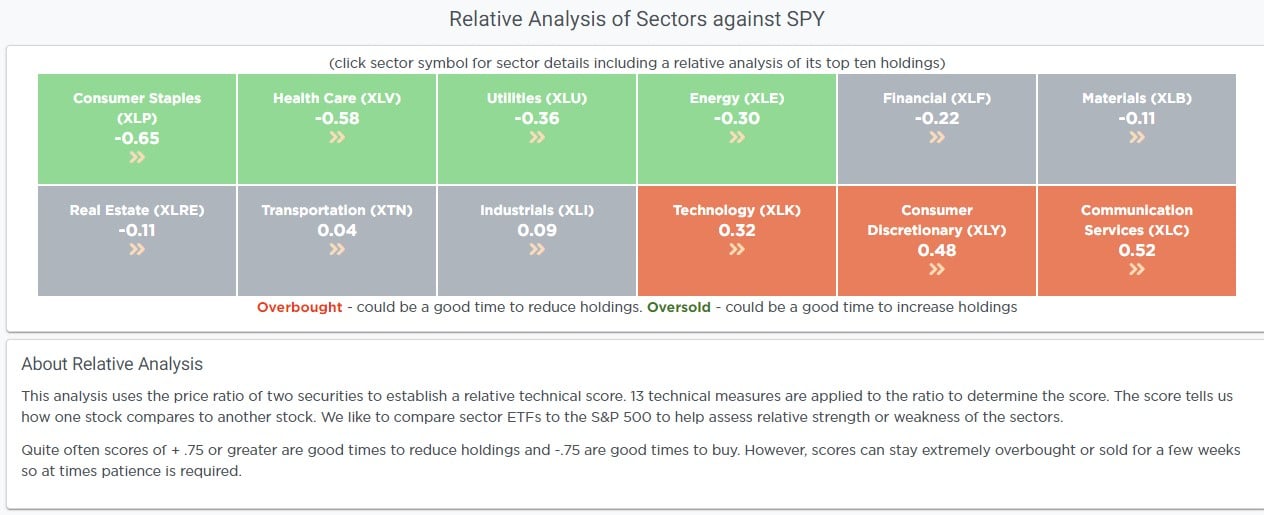
Relative Sector Analysis
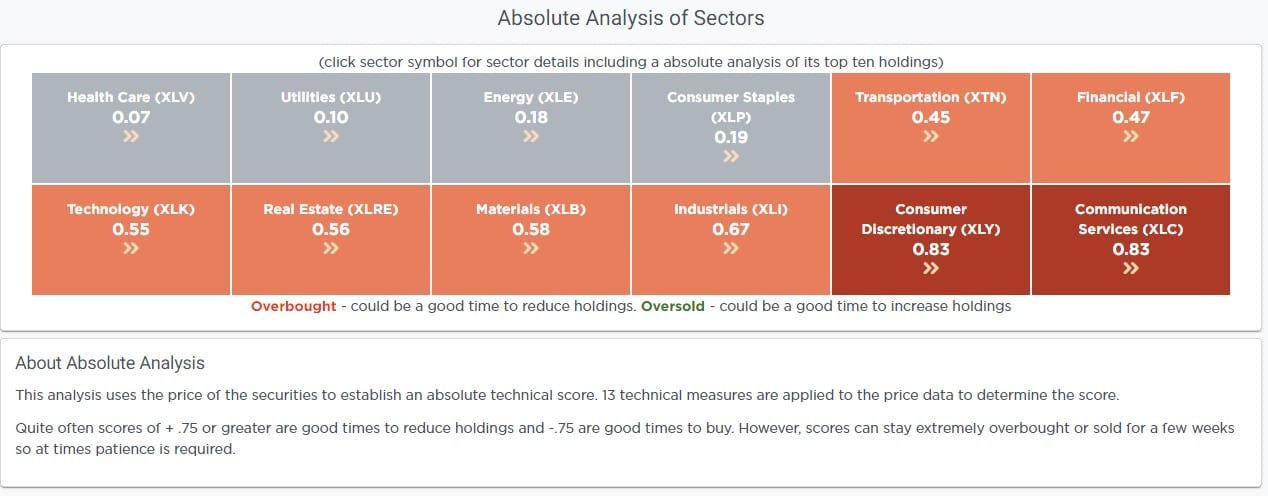
Absolute Sector Analysis
Sector Model Analysis & Risk Ranges
How To Read This Table
- The table compares the relative performance of each sector and market to the S&P 500 index.
- “MA XVER” (Moving Average Cross Over) is determined by the short-term weekly moving average crossing positively or negatively with the long-term weekly moving average.
- The risk range is a function of the month-end closing price and the “beta” of the sector or market. (Ranges reset on the 1st of each month)
- The table shows the price deviation above and below the weekly moving averages.
While the market continues to rise, with weekly performance much improved from last year, there are increasingly more sectors and markets trading well above longer-term moving averages, which tends to suggest a short-term correction is likely. Gold miners and emerging markets are very overbought due to the oversold condition of the dollar. Those will likely revert in the weeks ahead. Overall the market is extremely stretched, so a correction remains probable. Some profit-taking is advised in areas most deviated from the long-term moving averages.
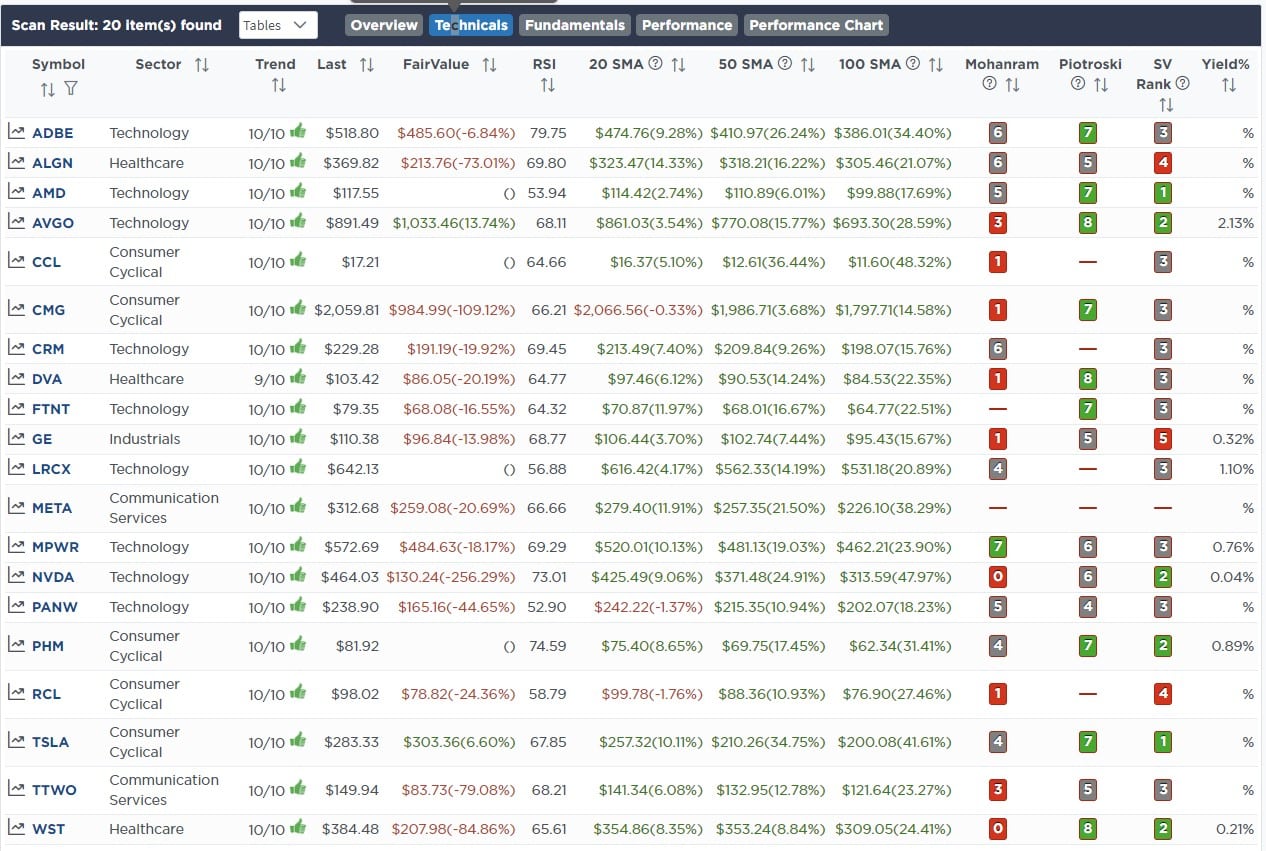
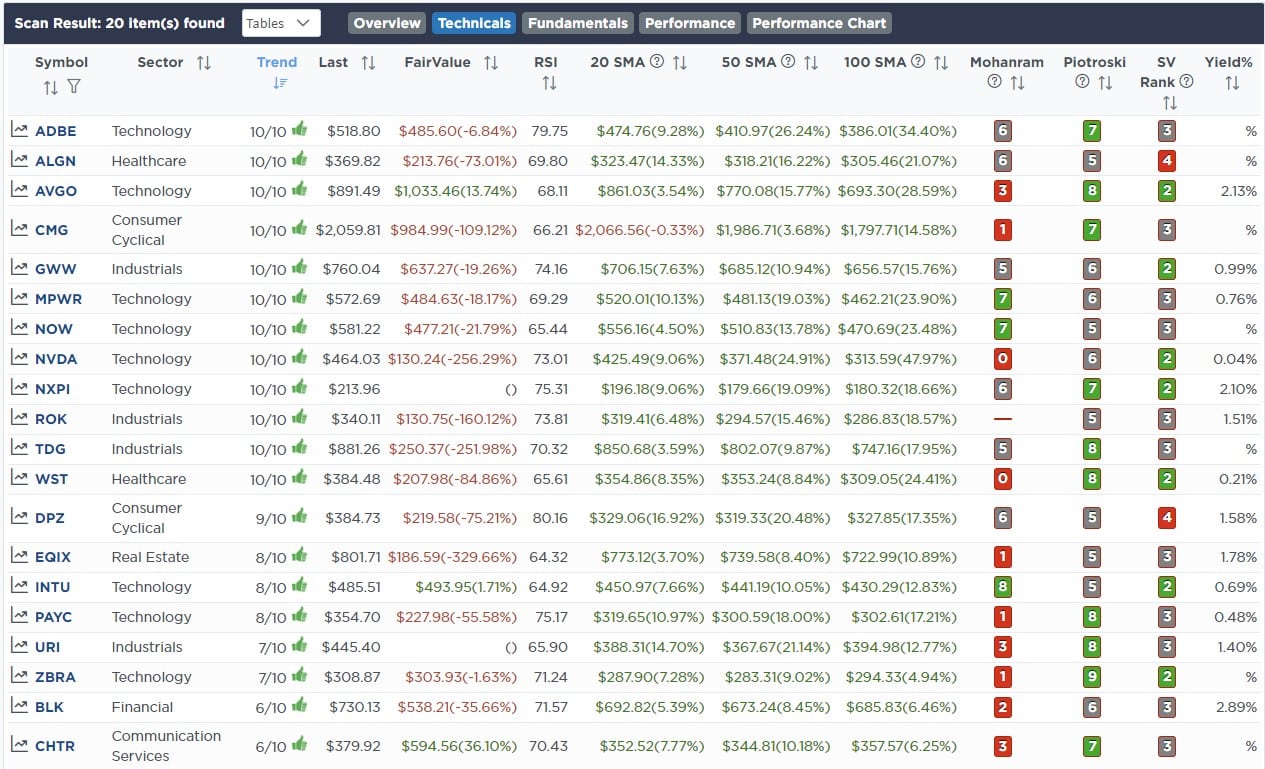
Weekly SimpleVisor Stock Screens
We provide three stock screens each week from SimpleVisor.
This week we are searching for the Top 20:
- Relative Strength Stocks
- Momentum Stocks
- Technically Strong Stocks With Dividends
(Click Images To Enlarge)
R.S.I. Screen
Momentum Screen
Technically Strong With Dividends
SimpleVisor Portfolio Changes
We post all of our portfolio changes as they occur at SimpleVisor:
July 12th
“With inflation falling to 3% this morning, the pressure on the Fed to hike rates is lessening. The disinflation trade is alive and well, with the markets breaking above the recent double top. With that breakout, we added some additional exposure as we continue to head to full portfolio weightings. We continue to take a slow and methodical approach to increasing equity risk in this market.
We remain underweight in the technology, discretionary, and communications sectors and are adding some additional exposure to those holdings. After the Nasdaq rebalancing on the 24th of July, we will likely add additional weightings then.
Equity Model
- Increase Google (GOOG) by 1.25% of the portfolio.
- Adding 1% to Amazon (AMZN)
- Increasing Apple (AAPL) by 1% of the portfolio.
ETF Model
- Increasing the iShares Technology Sector ETF (XLK) by 2% of the portfolio.
- Adding 1% of the portfolio to the iShares Discretionary Sector ETF (XLY)
- Increasing the iShares Communications Sector ETF (XLC) by 1% of the portfolio.
July 13th
“This morning, we added 1.5% of the Russell 2000-Mid/Small Cap Index (IWM) to both models. The Russell is starting to show signs of strength, having greatly lagged the S&P and Nasdaq. If this market keeps increasing and breadth improves, IWM will likely outperform the other indexes. On a monthly basis, we are getting a good buy signal but could see a pullback in the very short term. Our plan is to add on the pullbacks.”
Both Models
- Initiate a 1.5% position of the portfolio in the iShares Russell 2000 Mid/Small Cap Index ETF (IWM)

Lance Roberts, C.I.O.
Have a great week!


