Rate Increases From Hawkish Fed Sends Stocks Tumbling


Inside This Week’s Bull Bear Report
- Market Tumbles As Wall Street Awaits Santa
- Hawkish Fed Signals More Rate Increases
- How We Are Trading It
- Research Report – Market Valuation Suggests Weak Returns In 2023
- Youtube – Weekly Market Review With Adam Taggart
- Stock Of The Week
- Daily Commentary Bits
- Market Statistics
- Stock Screens
- Portfolio Trades This Week
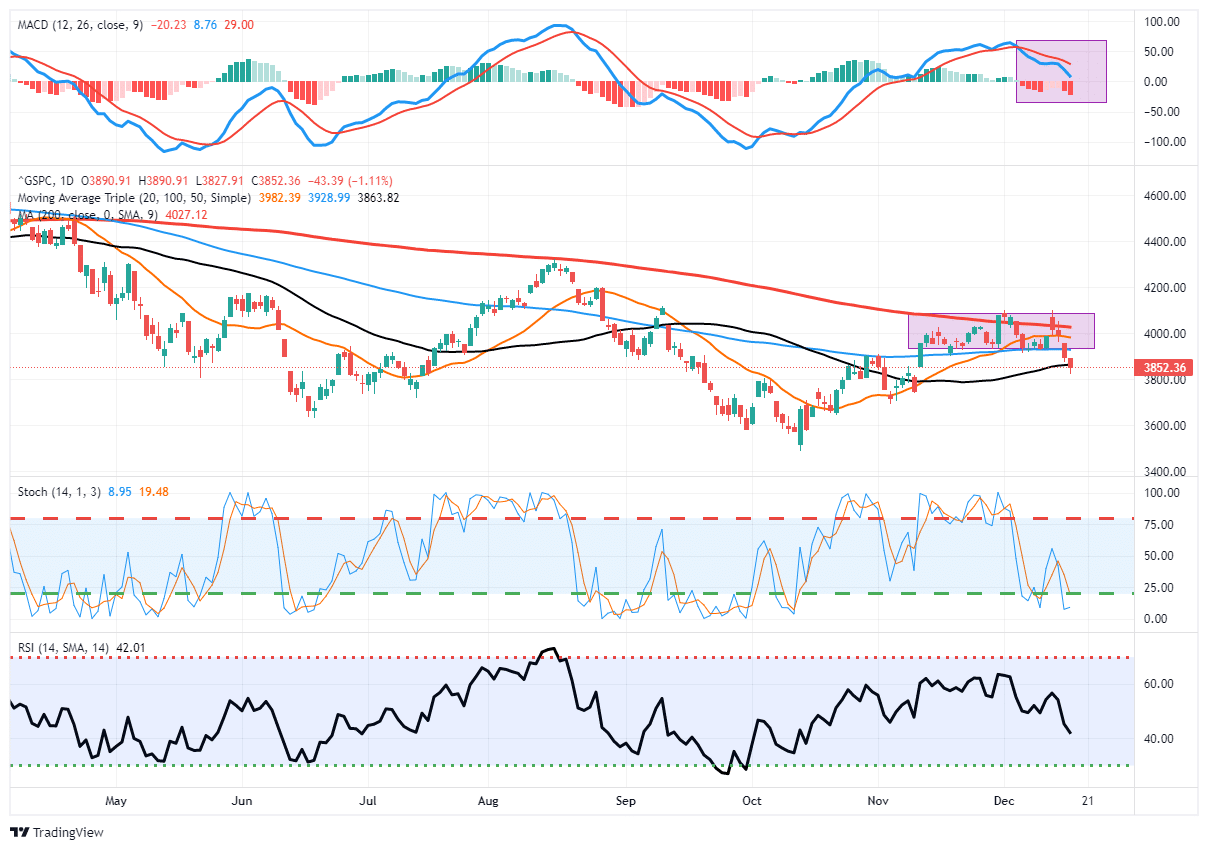
Stocks Tumble On More Rate Increases
Last week, we suggested the Fed would be more “hawkish” at the December FOMC meeting.
While the CPI report came in weaker than expected, sending the market surging early in the day above the 200-DMA, it could not hold those gains ahead of the Fed meeting. As we will discuss next, Jerome Powell was indeed more hawkish than expected, signaling further rate increases and making clear that no “pivot” was coming. That one-two punch sent stocks tumbling and wiped out the entirety of the “weaker CPI” rally from early in the week.
The MACD sell signal remains a good signal NOT to get sucked into rally attempts. Remaining cautious has served readers well over the last several weeks. The good news, if you want to call it that, is the 50-DMA held on Friday and sets the market up for a “Santa Rally” into year-end. The not-so-good news is that the rally may be somewhat limited, given the downside break of the recent consolidation range, which will provide overhead resistance.
Historically, the last two weeks of December and the first week of January tend to be positive as portfolio managers “window dress” into year-end for annual reporting, and the first two weeks of January see large inflows of money into financial assets for the New Year.
Yale Hirsch first documented the pattern in 1972, writing in “Stock Trader’s Almanac” that the S&P 500 had gained an average of 1.5% during that seven-day period from 1950 through 1971. The pattern has remained true to today. Since 1950, the broad market index has increased an average of 1.3%.
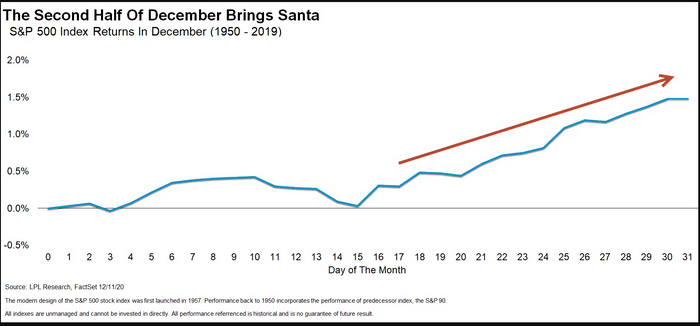
While this seasonal period does have a statistically high probability of being positive, such does not mean it “must” be. There are years when “Santa Failed To Visit.”
Need Help With Your Investing Strategy?
Are you looking for complete financial, insurance, and estate planning? Need a risk-managed portfolio management strategy to grow and protect your savings? Whatever your needs are, we are here to help.

Hawkish Fed Signals More Rate Increases
The reality is the outcome of 2023, as discussed in yesterday’s MacroView Blog, will almost entirely depend on the Federal Reserve. As rate hikes continue, the risk of “breaking something” increases. But, even an ordinary recession would suggest current earnings estimates must decline, thereby dictating lower asset prices.
Over the course of this year, market participants repeatedly clung to the hope of a “Fed pivot.” Each time, Mr. Powell reminded the market such would not be the case. In November, the market surged 5.5% in a single day on the October inflation report. The market then surged 3.1% following a speech by Mr. Powell at the Brookings Institution when he discussed starting to slow the pace of rate increases in December.
Each of those rallies was slapped down by the Fed. As we noted last week, Nick Timaros relayed a message from the Fed. To wit:
“Federal Reserve officials have signaled plans to raise their benchmark interest rate by 0.5 percentage point at their meeting next week. However, elevated wage pressures could lead them to continue lifting it to higher levels than investors expect.
…brisk wage growth or higher inflation in labor-intensive service sectors of the economy could lead more of them to support raising their benchmark rate next year above the 5% anticipated by investors.“
The Fed’s latest policy announcement confirmed that even though they may be approaching the finish line, they aren’t there yet concerning the central bank’s fight against inflation. Such was also apparent in their “dot plot,” which increased the potential for rate increases next year above 5%. You can see the cluster of consensus expectations between 5.1% and 5.3%, which implies three more rate hikes in 2023 of 0.25% each.
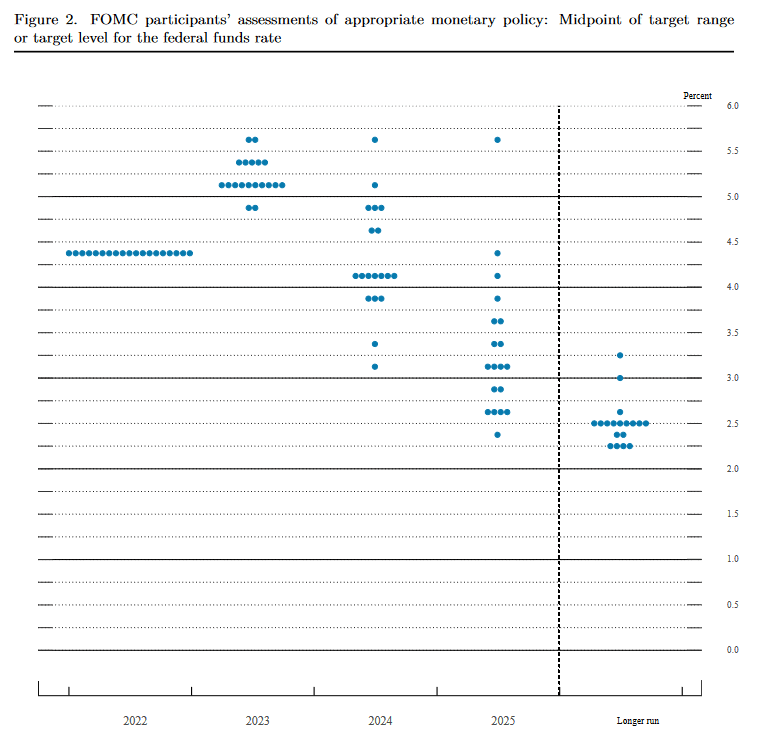
Importantly, despite the ongoing hopes for a “pivot” to boost stocks, the Fed’s rate projections show NO rate cuts in 2023.
Fed Chair Jerome Powell said the central bank needs to be confident in the path of inflation before cutting its benchmark interest rate. To wit:
“Historical experience cautions strongly against prematurely loosening policy. I wouldn’t see us considering rate cuts until the committee is confident that inflation is moving down to 2% in a sustained way.”
Of course, achieving a 2% inflation rate, down from 7.1% currently, would imply much slower economic growth derived from higher unemployment, reduced wage growth, and much slower demand.
The question is, can that be achieved without triggering a recession?
Can The Fed Avoid A Recession?
“The Federal Reserve expects an economic downturn next year. But just don’t call it a recession.“ – Yahoo FInance
That statement defines the much-hoped-for “soft” economic landing. With the Federal Reserve committed to continued rate hikes in 2023, reducing market liquidity through “Quantitative Tightening,” and retail sales falling, we struggle with the concept of a “soft landing.”
However, if employment remains strong, unemployment doesn’t rise substantially, and wages increase to offset inflation pressures, it is possible to avoid a recession. The problem is that strong employment and wage growth will add to inflationary pressures. Of course, that is what the Federal Reserve is actively trying to resolve.
Yet, in its latest Summary of Economic Projections released Wednesday, Fed officials said they expect GDP growth at the end of next year to stand at just 0.5% while the unemployment rate is set to rise from its current level of 3.7% to 4.6%.
See, no recession, just a soft landing.
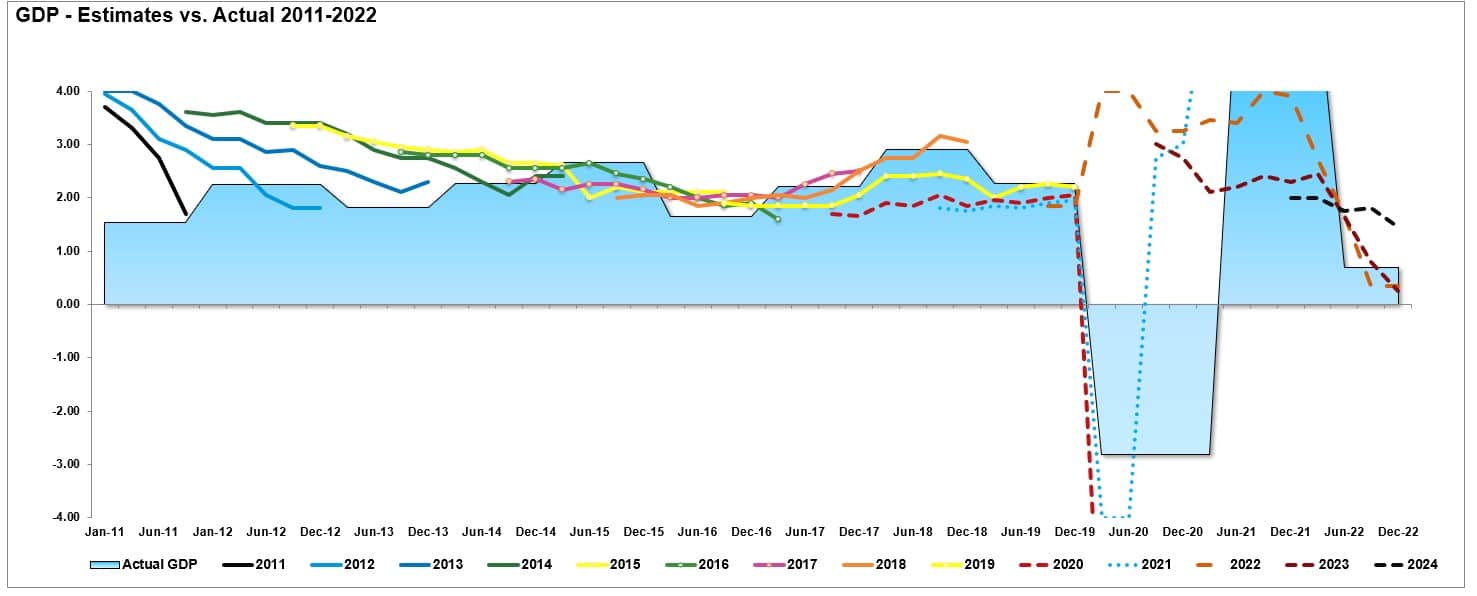
The problem is the Fed is NEVER correct in its forecast, as shown in the table below. The embedded chart shows the difference in their economic growth projections between the March meeting and December.
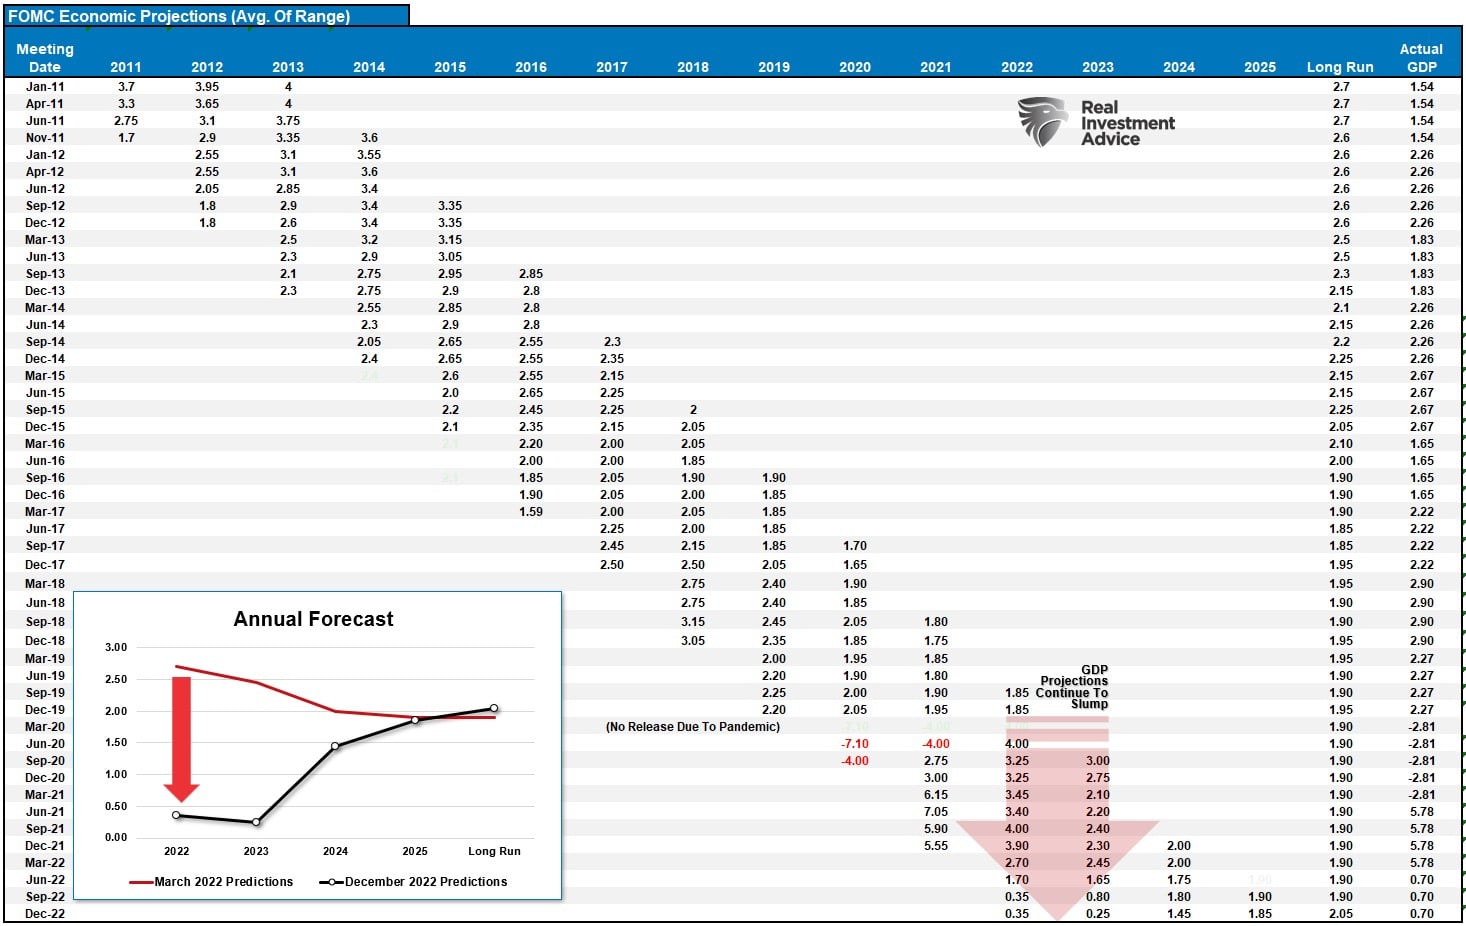
Can’t Tell You The Truth
Yes, estimates for growth in 2023 stand at 0.5% as of December, down from 4%.
The Fed isn’t that bad at forecasting. They just can’t tell the truth.
Imagine that on Wednesday, the Fed released projections of a 2% economic decline next year. Immediately, the market would have sold off by 5%, and the media would run with the story causing consumption to contract, and, voila, you have a recession.
These forecasts are always overly optimistic and gradually reduce to align with economic realities. Such allows the market to adjust without creating a dislocation driven by panicked selling. The chart below shows the annual downward adjustments to the economic forecast each year.
We believe a recession seems highly probable if the Fed’s end game of rate increases is higher unemployment and lower inflation. The only way to achieve that with rate increases is to destroy demand which ultimately slows wage growth. The economic data already seems well tilted into a recessionary trend. The composite economic index is already signaling a sharp slowdown in economic activity, and we suspect it will deepen next year.

As noted above, IF the economy slows markedly next year or falls into a recession, the market will need to reprice for lower earnings. Given the Fed is continuing to hike rates, that repricing seems inevitable as history shows that Fed rate hikes also align with peak earnings followed by contractions.

Of course, this is why the “bulls” are banking on a “pivot.”
No Pivot Unless Something Breaks
On Thursday, Fed President, Richard Clarida wrote an article for Pimco stating:
“We do not want to overtighten because we think cutting rates is not something we want to do soon, but if financial conditions ease because markets price in such cuts, a peak policy rate of 5.25% may NOT be sufficient to put inflation on a path to return to 2% over time.”
That comment is not what the bulls want to hear. It is also the message that Jerome Powell has repeatedly tried to deliver this year each time the market rallied in hopes of a “pivot.”
When the market rallies, it boosts consumer confidence and eases financial conditions. Such is exactly the opposite of what the Fed wants, as it needs TIGHTER financial conditions to reduce economic demand.
However, while the markets are hoping for a “pivot,” there is no current reason for the Fed to cut rates and reverse its balance sheet contraction. If the economy does have a “soft landing,” then the Fed will hold at the terminal rate and continue reducing its balance sheet. Such would be a welcome outcome for the Fed to allow time to reset for the economic downturn.
Therefore, as noted recently, the ONLY reason the Fed will pivot on monetary policy to an easing regime is if something breaks economically or financially. To wit:
“Naturally, once the Fed’s aggressive rate hike campaign ‘breaks’ something, the ‘policy pivot’ will occur. Such will occur as the realization that inflation has now become a ‘disinflationary’ wave in the economy.”
Many, like Jim Cramer, assume that as soon as the Fed “pivots,” such will be bullish for equities. Historically, when the Fed cuts interest rates, such is not the end of equity “bear markets,” but rather the beginning. Such is shown in the chart below of previous “Fed pivots.”
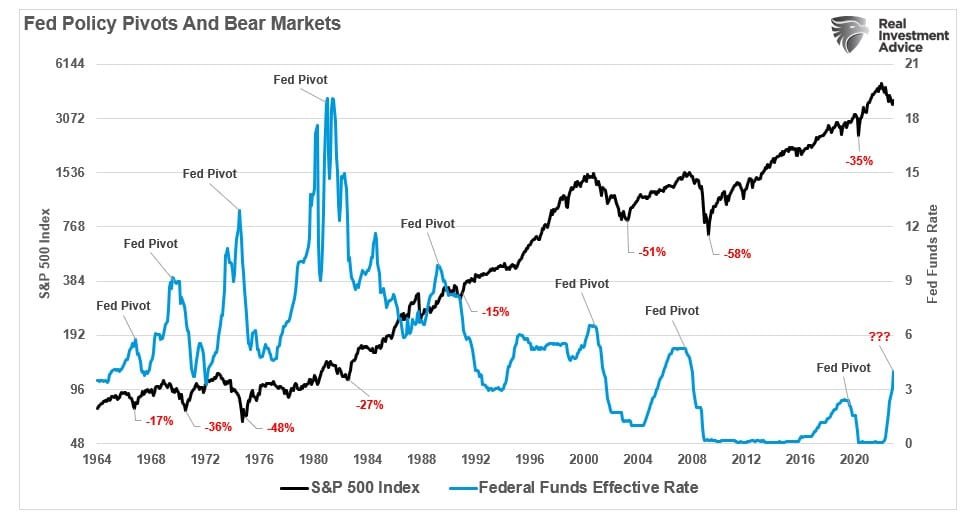
Notably, most “bear markets” occur AFTER the Fed’s “policy pivot.”
The Fed was extremely clear they are going to hike rates until “inflation” is on a trajectory towards its 2% target. The Fed is currently using very blunt instruments to achieve that goal, which will most likely result in a recession.
In this week’s “How We Are Trading It,” we will review the guidelines for managing risk through a recessionary environment.
Not Getting The Bull Bear Report Each Week In Your Mailbox? Subscribe Here For Free.
How We Are Trading It
From our perspective, the risk of deeper recession remains elevated, particularly as the Fed aggressively hikes rates.
While there is always a possibility that the economy could avoid a “recession,” those odds are slim at best. Therefore, as investors, we should at least prepare for a storm and then cross our fingers and hope for the best. The guidelines are simplistic but ultimately effective.
- Raise cash levels in portfolios
- Reduce equity risk, particularly in high beta growth areas.
- Add or increase the duration of bond allocations which tend to offset risk during quantitative tightening cycles.
- Reduce exposure to commodities and inflation plays as economic growth slows.
If a recession occurs, the preparation will allow you to survive the impact. Protecting capital from the inherent destruction will mean less time spent getting back to even after the storm passes.
Alternatively, it is relatively straightforward to reallocate funds to equity risk if we avoid a recession or if the Fed does revert to monetary accommodation.
Investing during a recession is difficult. However, you can take some steps to ensure increased volatility is survivable.
- Have excess emergency savings, so you are not “forced” to sell while markets decline to meet obligations.
- Extend your time horizon to 5-7 years, as buying distressed stocks can get more distressed.
- Don’t obsessively check your portfolio.
- Consider tax-loss harvesting (selling stocks at a loss) to offset those losses against future gains.
- Stick to your investing discipline regardless of what happens.
While the media continues to hope for a “pivot,” there is currently no evidence the Fed intends to reverse monetary tightening.
The risk is clearly to tighter policy and slower economic growth.
If we are correct, a recession could occur, and prices will decline further.
See you next week.
Research Report
Weekly Market Recap With Adam Taggart
Subscribe To Our Youtube Channel To Get Notified Of All Our Videos
Stock Of The Week In Review
This week we use the Finviz screener tool to find large international value-oriented stocks that have been trading well. The impetus for this screen is the recent outperformance of international stocks. Since October 1, 2022, EFA, representing the MSCI EAFE index (large to mid-cap across 21 non-USA developed markets), has risen nearly 20%, almost double the gain of the S&P 500.
Fueling the outperformance is the weakening dollar. The dollar index peaked in late September at 114. It now sits almost 10% lower at 105. If you think the dollar index will continue to trend lower and developed international markets will benefit from the weaker dollar, this screen may provide a few ideas on exploiting such a decline.
Screening Criteria
- Country: Outside of the U.S.A.
- P/E and Forward P/E <10
- Market Cap > $10 billion
- Trading above its 20/50/200 day moving averages
Here is a link to the full SimpleVisor Article For Step-By-Step Screening Instructions.
VALE – Vale S.A.
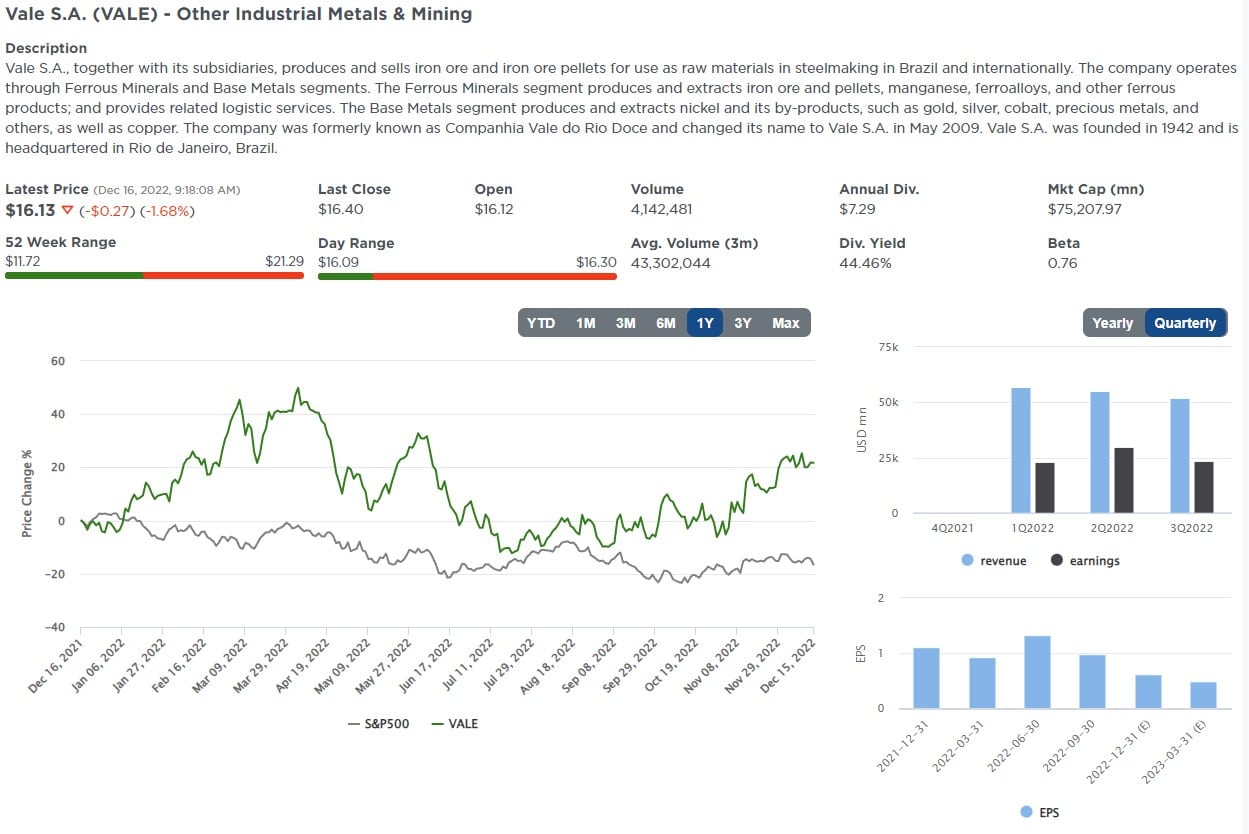
Login to Simplevisor.com to read the full 5-For-Friday report.
Daily Commentary Bits
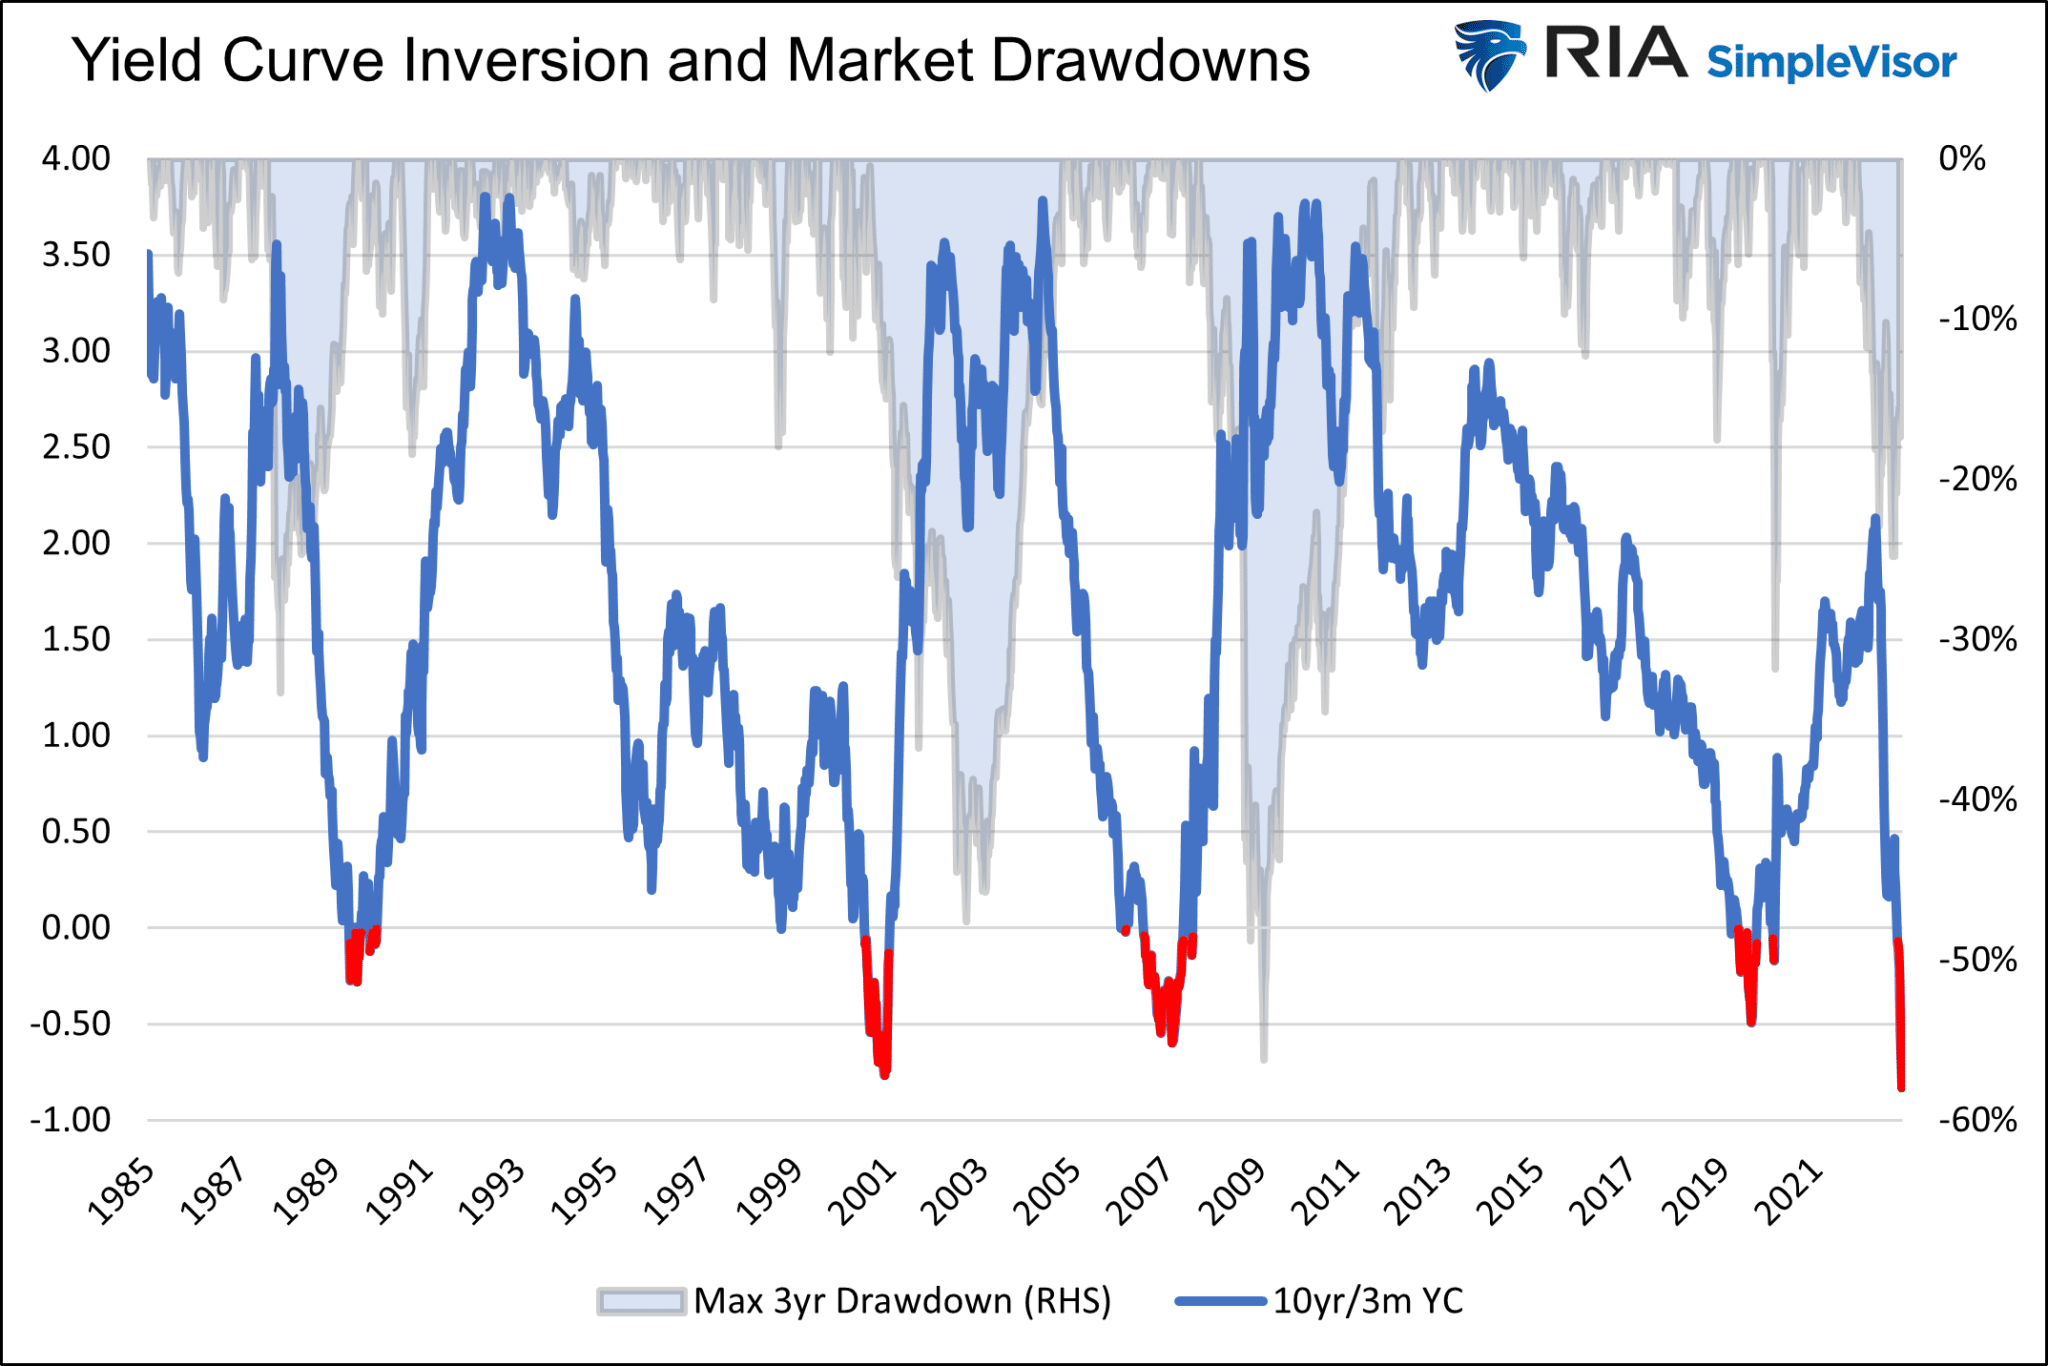
Its the Steepening, Not The Inversion, That Scares Us
On Wednesday, we published The Foghorn is Blowing, But Few Heed Its Warning. The article shares a few graphs, some of which are below, to help consider how the yield curve will steepen from its current inverted level. As shown, inverted yield curves tend to steepen in a sharp “V” shaped pattern. Recessions do not begin, and equity prices do not bottom until the curve is positively sloped. The most likely reason for the curve to steepen is aggressive Fed easing. Maybe the Fed will pull a rabbit out of its hat, and this time will be different. However, history warns that inverted yields always un-invert and often accompany economic and financial damage.
Click Here To Read The Latest Daily Market Commentary (Subscribe For Pre-Market Email)
Bull Bear Report Market Statistics & Screens

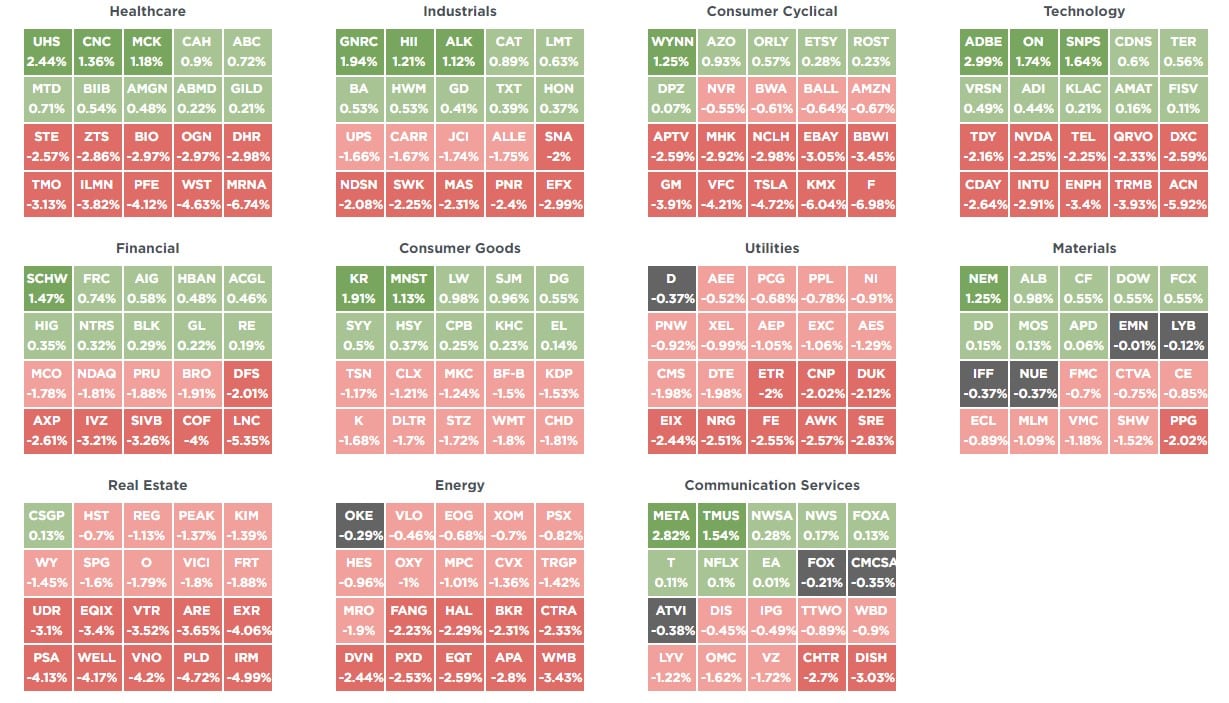
SimpleVisor Top & Bottom Performers By Sector
S&P 500 Tear Sheet
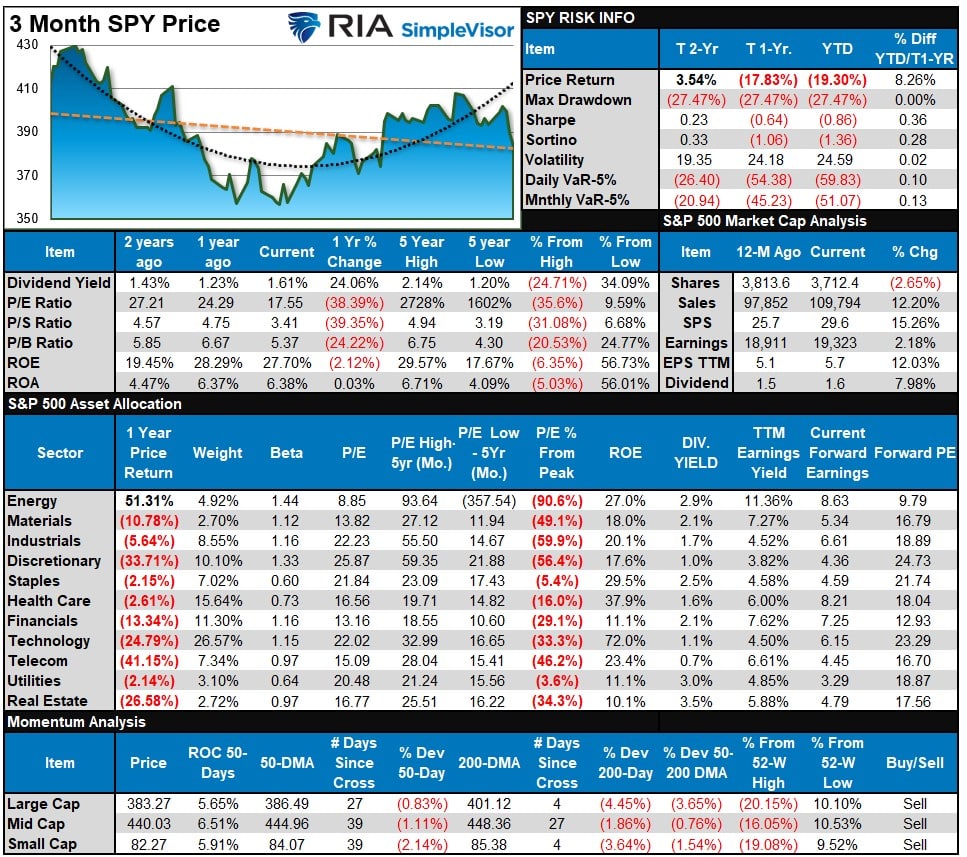
Relative Performance Analysis
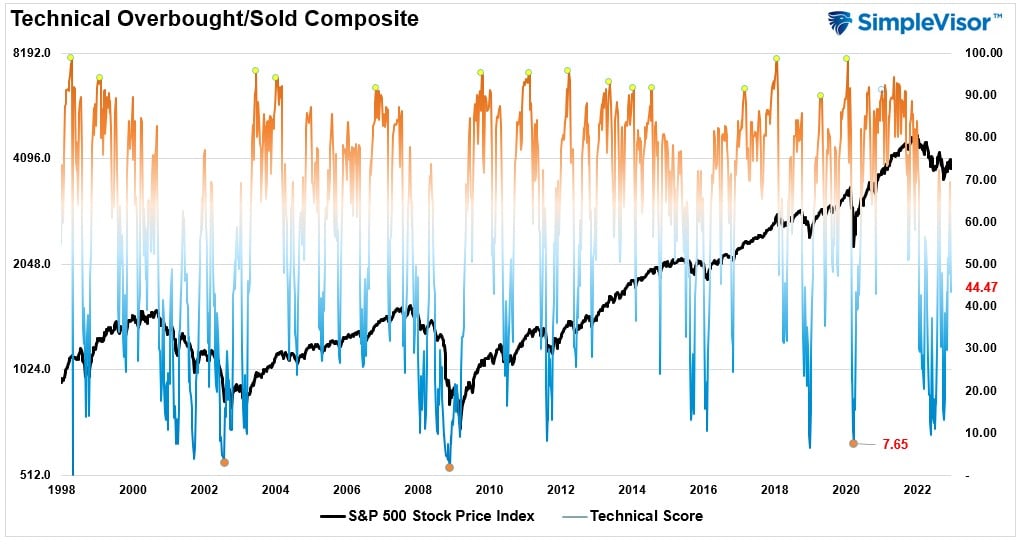
Last week we stated that with the weekly Technical Gauge (below) increasing to more overbought levels, we advised readers to take profits and reduce risk. That advice was timely as the market traded lower this past week, which did resolve some of the overbought conditions. This week, the market is back to extreme oversold levels on major markets and sectors. Such sets the base for a tradeable “Santa Rally” into year-end.

Technical Composite
The technical overbought/sold gauge comprises several price indicators (RSI, Williams %R, etc.), measured using “weekly” closing price data. Readings above “80” are considered overbought, and below “20” are oversold. Markets tend to peak when those readings are at 80 or above, which suggests profit-taking and risk management are prudent. The best buying opportunities exist when those readings are 20 or below.
The current reading is 44.47 out of a possible 100 and rising. Remain long equities for now.
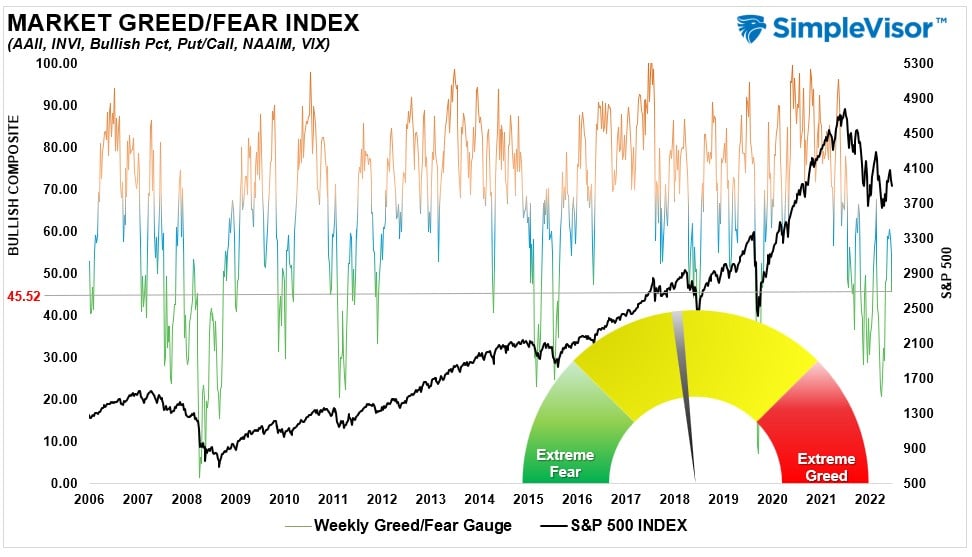
Portfolio Positioning “Fear / Greed” Gauge
The “Fear/Greed” Gauge is how individual and professional investors are “positioning” themselves in the market based on their equity exposure. From a contrarian position, the higher the allocation to equities, the more likely the market is closer to a correction than not. The gauge uses weekly closing data.
NOTE: The Fear/Greed Index measures risk from 0 to 100. It is a rarity that it reaches levels above 90. The current reading is 45.52 out of a possible 100.
Sector Model Analysis & Risk Ranges
How To Read This Table
- The table compares the relative performance of each sector and market to the S&P 500 index.
- “M” XVER” “Moving Average Cross Over) is determined by the short-term weekly moving average crossing positively or negatively with the long-term weekly moving average.
- The risk range is a function of the month-end closing price and the “beta” of the sector or market. (Ranges reset on the 1st of each month)
- The table shows the price deviation above and below the weekly moving averages.
While bonds are extremely extended after their recent run, the sell-off last week on the equity side took several sectors and markets below their monthly risk ranges. The S&P 500, Materials, Communications, Energy, Financials, Technology, Real Estate, Discretionary, Transports, and Small and Mid-cap stocks are trading below their normal ranges. Deviations from the long-term moving averages have improved markedly and suggest a year-end rally is likely. There are now bullish moving average crossovers for Energy, Financials, Industrials, and Utilities.

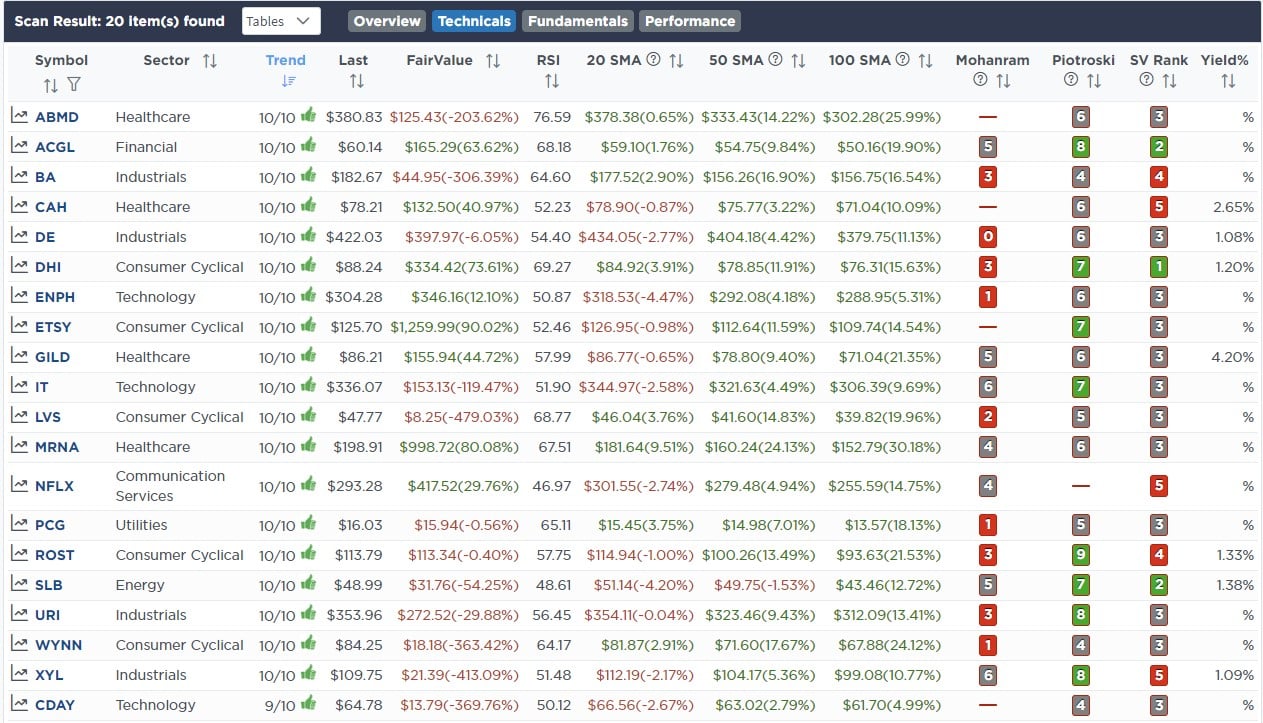
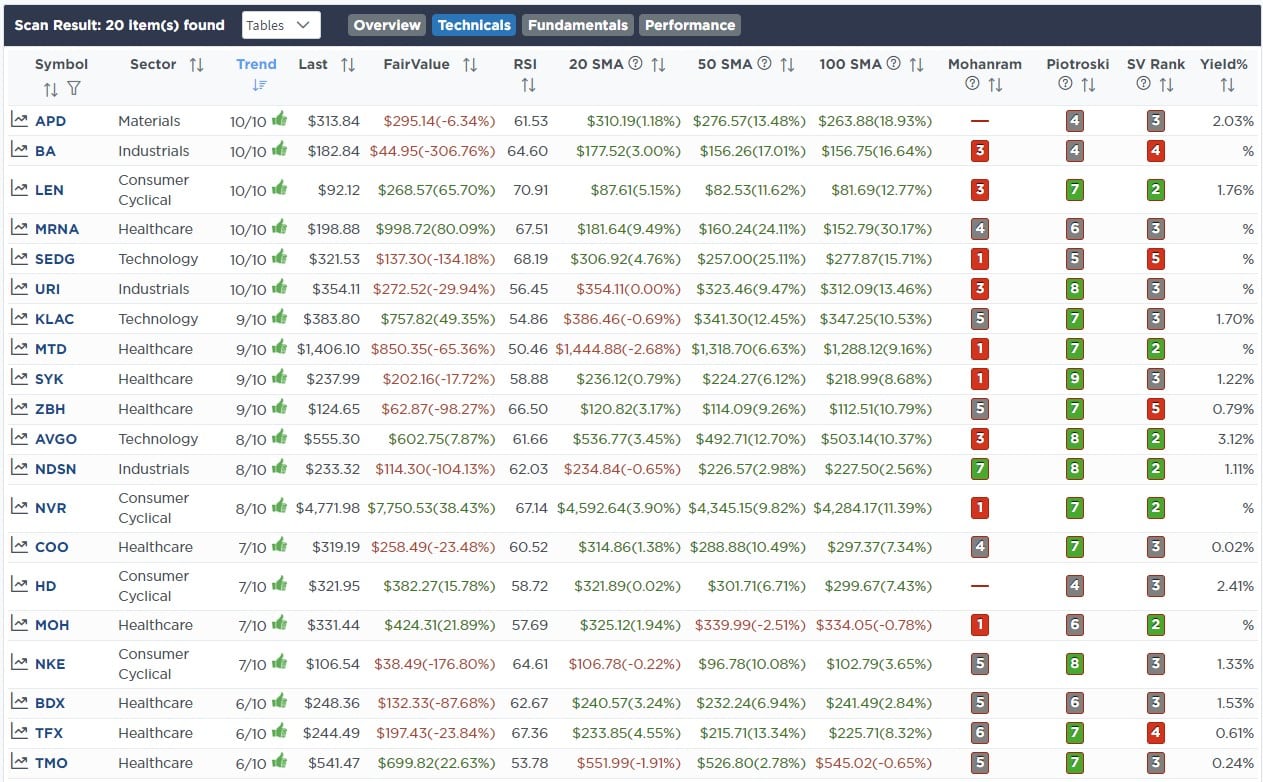
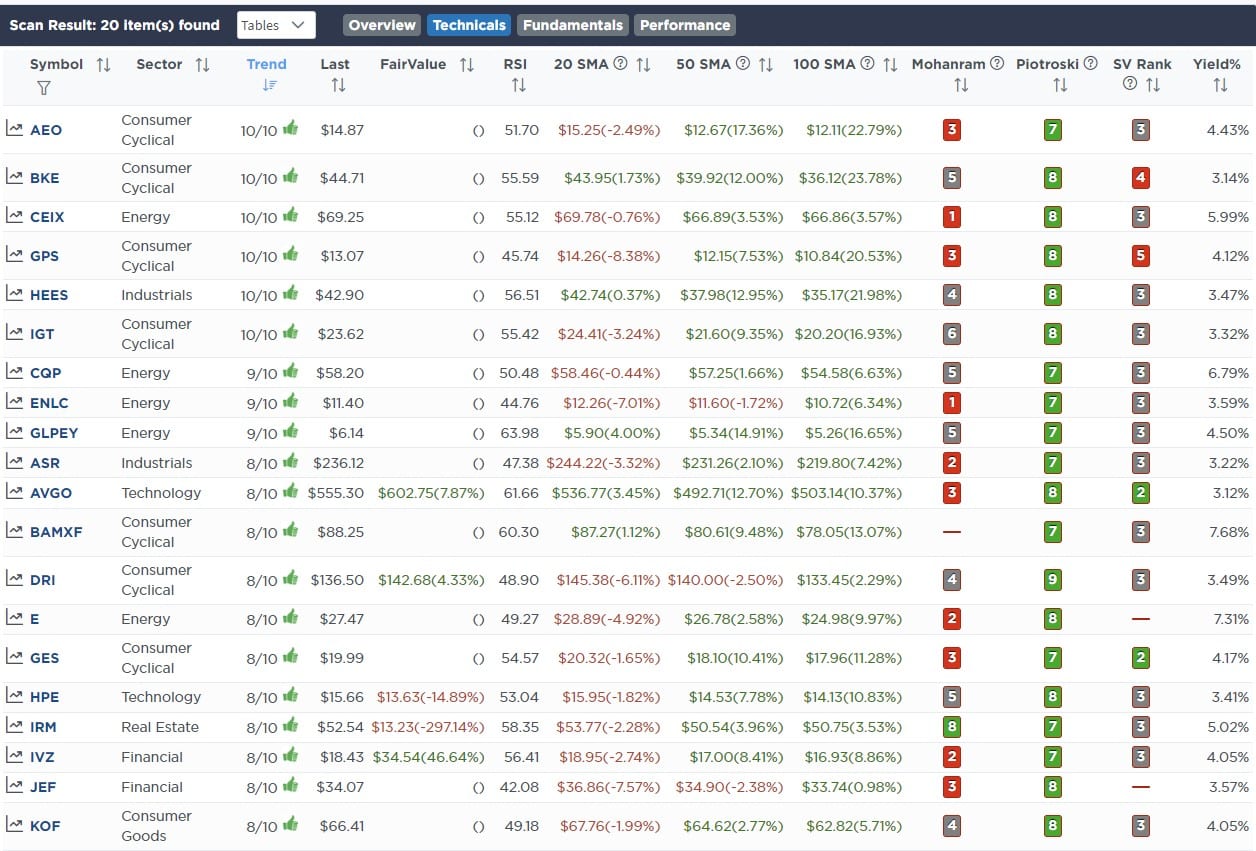
Weekly SimpleVisor Stock Screens
Each week we will provide three different stock screens generated from SimpleVisor: (RIAPro.net subscribers use your current credentials to log in.)
This week we are scanning for the Top 20:
- Relative Strength Stocks
- Momentum Stocks
- Highest Rated Stocks With Dividends
These screens generate portfolio ideas and serve as the starting point for further research.
(Click Images To Enlarge)
RSI Screen
Momentum Screen
Highest Rated Stocks With Dividends
SimpleVisor Portfolio Changes
We post all of our portfolio changes as they occur at SimpleVisor:
We made no trades in the portfolios this past week.
The equity model is now at 35% equity exposure, and the ETF model is at 40.5%.

Lance Roberts, CIO
Have a great week!


