Market Correction Goes Viral, Is It Time To Buy? 02-01-20


- Market Correction Goes Viral
- Portfolio Position Review
- MacroView: Fed’s View Of Valuations May Be Misguided
- Financial Planning Corner: What You May Have In Common With Kobe Bryant
- Sector & Market Analysis
- 401k Plan Manager
Follow Us On: Twitter, Facebook, Linked-In, Sound Cloud, Seeking Alpha

Catch Up On What You Missed Last Week

Market Correction Goes Viral
Over the last few weeks, the message from the newsletter has been repetitive:
“The markets are overbought, overextended, overly complacent. A correction is coming so reduce and rebalance portfolio risks.”
Despite those issues, the markets continued to push higher leaving readers with the assumption the “warnings” were wrong.
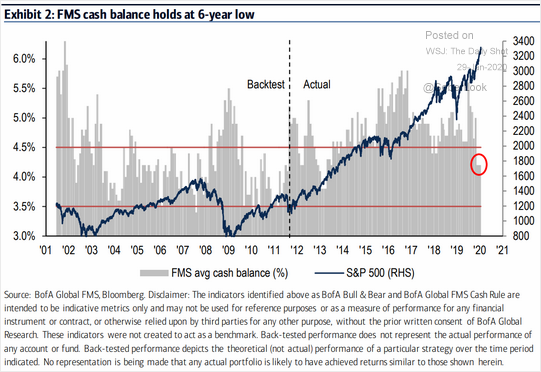
As noted last week, there have only been a few points over the previous 25-years where investors were so extremely lopsided in their positioning. We have shown many charts of investors being “all in” to equities over the last three weeks, but here is the latest Fund Manager’s Survey, which shows cash balances at 6-year lows.
The importance of these measures is not meant to be a “timing” signal to buy or sell positions. These measures are more valuable when thought about as an “accelerator” in a car. When markets are rising, investors press down on the accelerator, taking on more equity risk. As long as the road is straight, and visibility is good, it seems there are no consequences for driving at high speeds. However, if the road suddenly turns, or a hazard presents itself, bad outcomes happen very quickly.
The same is true for the markets. As markets are rising, investors ignore the warning signs, and the flashing yellow lights, under the assumption, there is no risk ahead. This is why we discussed taking profits a couple of weeks ago, which was simply how we “eased our foot off the gas” as signs were warning of a “sharp curve ahead.”
I apologize for the analogy, but the message is important. The reason that investors do so poorly over time is the inability to manage risk. Risk is never a function of how much money you make when markets are rising; it is a measure of “your ability to survive the crash.”
This past week, the road took a sharp right as the “Coronavirus” begin to impact overly optimistic views of a global reflation. While media headlines have run rampant with commentary suggesting investors shouldn’t worry about the virus, we wrote on Thursday, this time is different than 2003. To wit:
“Following a nearly 50% decline in asset prices, a mean-reversion in valuations, and an economic recession ending, the impact of the SARS virus was negligible given the bulk of the ‘risk’ was already removed from asset prices and economic growth. Today’s economic environment could not be more opposed.”

With global growth already slow, and the U.S. dragging its feet along at roughly 2% annual growth, there isn’t much room to absorb the impact of an event that potentially curtails consumption. Here was the important point in our recent article:
“China itself is a much more crucial player in the global economy than it was at the time of SARS, or severe acute respiratory syndrome, in 2003. It occupies a central place in many supply chains used by other manufacturing countries—including pharmaceuticals, with China home to 13 percent of facilities that make ingredients for U.S. drugs—and is a voracious buyer of raw materials and other commodities, including oil, natural gas, and soybeans. That means that any economic hiccups for China this year—coming on the heels of its worst economic performance in 30 years—will have a bigger impact on the rest of the world than during past crises.
That is particularly true given the epicenter of the outbreak: Wuhan, which is now under effective quarantine, is a riverine and rail transportation hub that is a key node in shipping bulky commodities between China’s coast and its interior.”
Importantly, as percentage of global GDP, China is 4x the size it was in 2003.
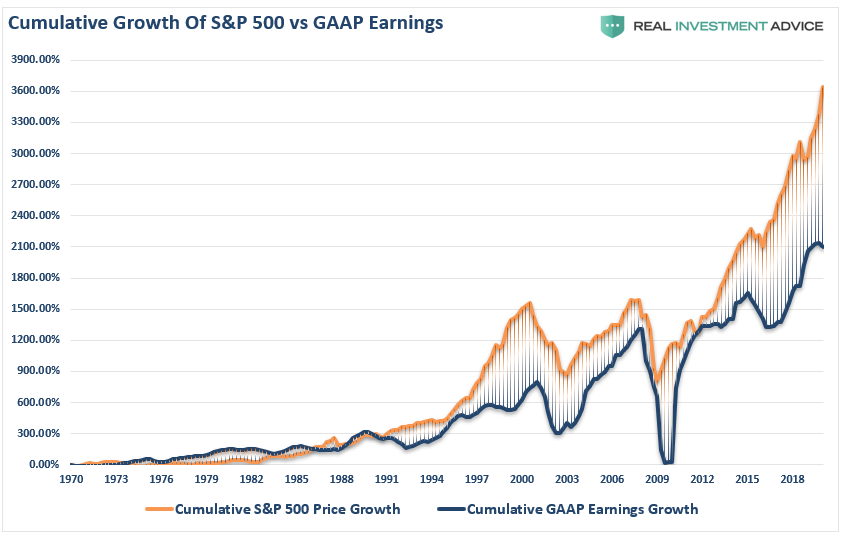
Don’t dismiss the risk of a viral contagion on an already weak global economy, at a time when asset prices are grossly deviated from actual profits, and GAAP earnings.

Is The Correction Over?
Since taking profits out of our portfolios, this leads us to the obvious question of whether or not the “Coronavirus Correction” is over?
From an investment standpoint, this is a fairly tricky question which brings up what we term in our practice as an “equity risk duration match.”
On a very short-term basis, there is a potential for a reflexive bounce. If your “investment duration,” or rather your “investment holding period” is very short, there may be a “trading” opportunity for you. However, if your “duration” is a longer time-frame, like ours, then the short-term oversold bounce is likely an opportunity to “reduce risk” further into.
As they say, “a picture is worth a thousand words.”
We did this analysis for our RIAPRO Subscribers (Risk-Free Trial For 30-Days) this past week, which warned them of the potential for a deeper decline this week.

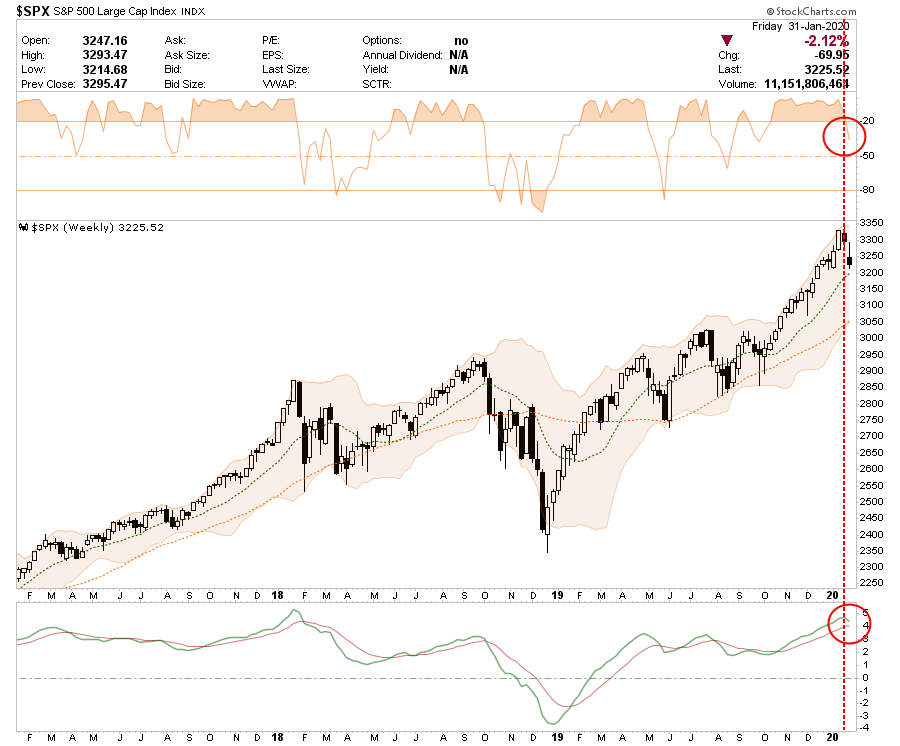
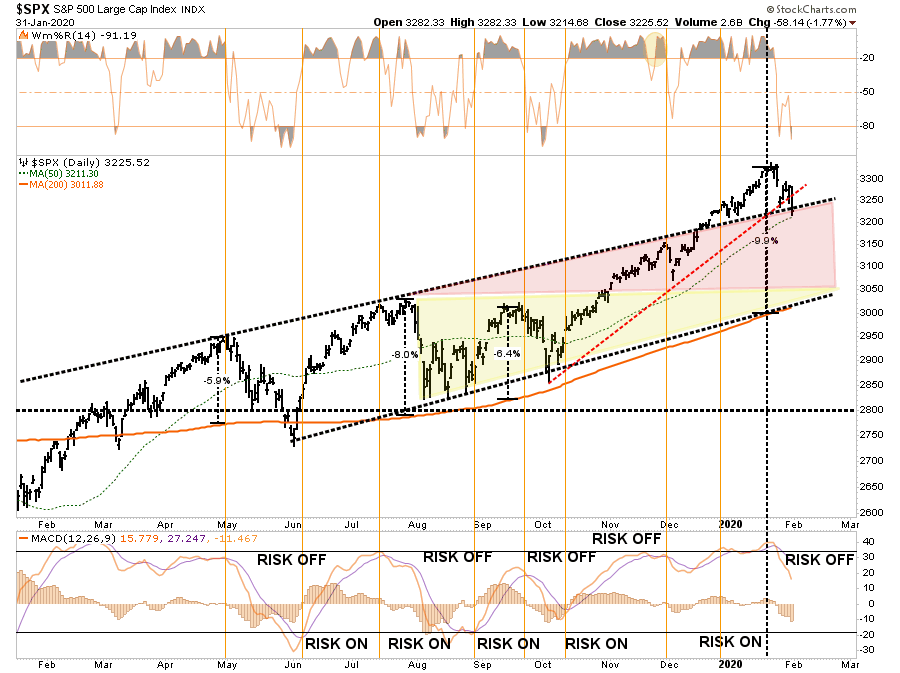
Daily – Short-Term
The market finally reversed some of the extreme 3-standard deviation extension (shaded areas) above the 200-dma, which we have discussed over the last couple of weeks. Such extensions, like stretching a rubber band too far, ALWAYS snap back eventually. We just never know what the catalyst will be that sparks the reversion.

With a “sell signal” clearly triggered (lower panel), it suggests, on a short-term basis, we are likely to see a “tradeable bounce.” However, until the signal reverses, any short-term bounce should probably be “sold into.”
Make no mistake, there is currently downside risk below the 50-dma to both the 38.2% and 50% Fibonacci retracement levels. From recent peaks, such a correction would entail a 5-8% decline, which is well within the normal range of a market correction within an ongoing bullish trend.
Weekly – Intermediate-Term
On a weekly basis the picture changes a bit. The bullish “buy” signal is still intact but is threatening a reversal which one more “down week” will likely accomplish. Furthermore, the market is NOT oversold as of yet, suggesting there is indeed downside risk currently, notwithstanding a short-term bounce. The best buying opportunities are when the weekly signal is oversold.
With the weekly “buy” signals still intact, such suggests the “correction” remains contained at the moment. However, these signals are valid only at the end of the week, so if there is further deterioration next week, there is a risk of a deeper correction developing. Previous corrections from such extended levels have ranged from 10%, to nearly 20%.
Monthly – Intermediate To Long-Term
On a long-term view, the market remains contained at the top of its bullish trend from the 2009 lows. Previous corrections have consistently tested both the mid- and lower bounds of the range. Don’t dismiss the statement above lightly. A test of the lower band of the range would wipe out 100% of the gains from 2019.
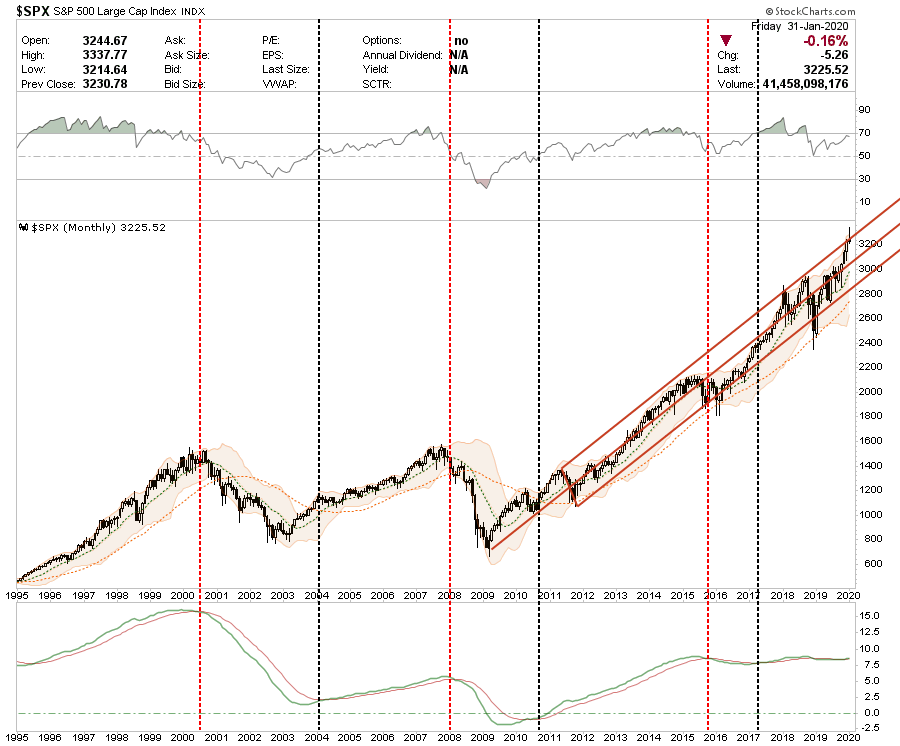
The market remains at risk of triggering a monthly sell signal (lower panel,) which has previously resulted in more severe bear markets and corrections going back 25-years.
Monthly data is very slow to move and is only valid at months end. This data is not useful for trading markets but is useful for risk mitigation and understanding when a “bear market” has genuinely begun.
Quarterly – Long-Term
As with the monthly data above, quarterly data is also not useful for trading portfolios. However, it provides a much deeper understanding of portfolio risk in the years ahead.
Currently, the market is extremely overbought (top panel,) and extremely extended (lower panel,) which has not previously been beneficial to investor returns over the following few years.
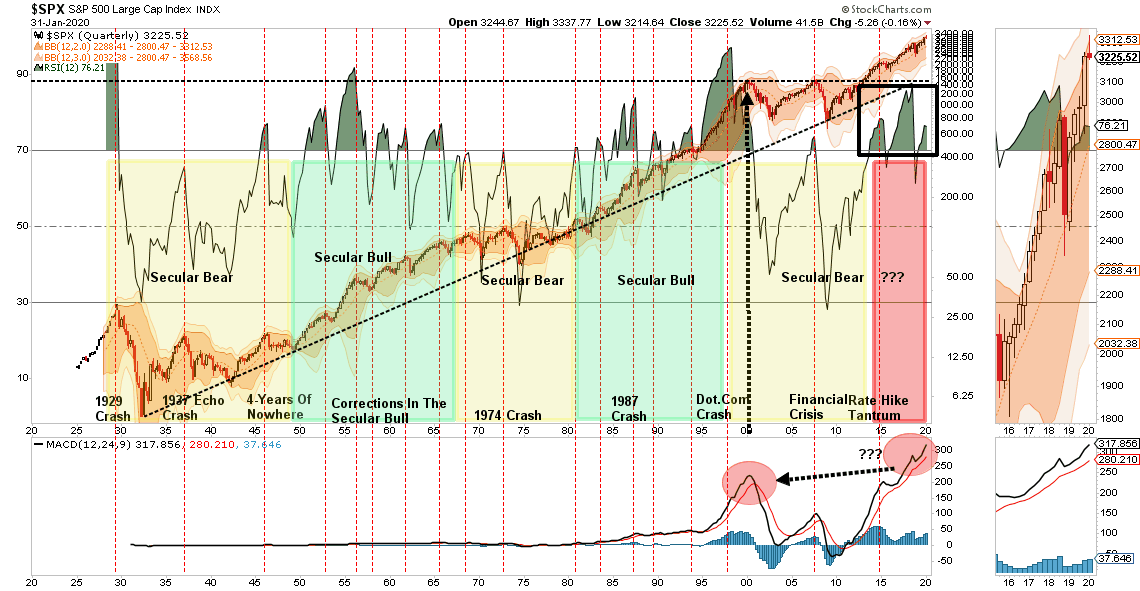
Importantly, what this data suggests is that betting on a “buy and hold” strategy over the coming decade is likely to leave you fairly disappointed. Risk is elevated and given the extreme long-term deviations on a variety of levels, an eventual “reversion to the mean” will be a more brutal event than what we have seen previously.

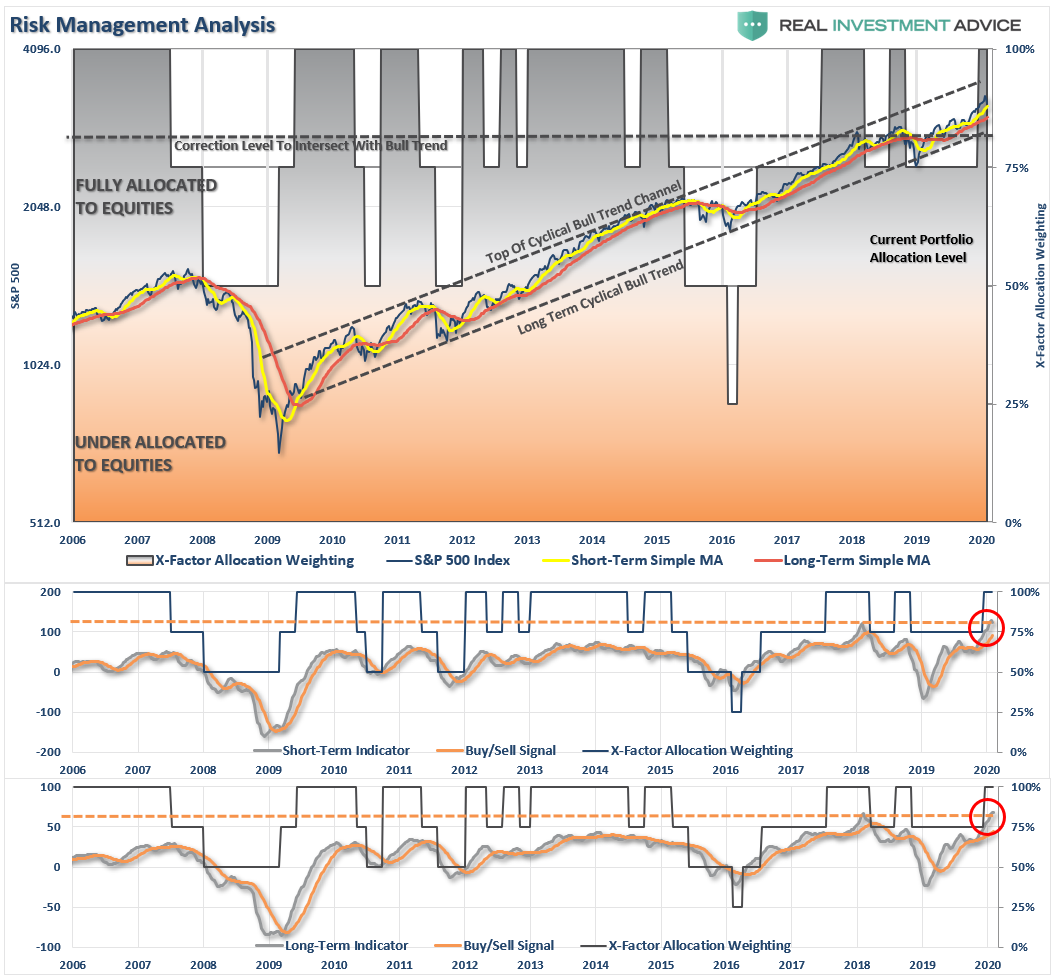
Portfolio Positioning
As noted above, after previously reducing exposure “slightly” to equities, we are now starting to actively scan for opportunities for a “risk rotation” in the market.
For quite some time, we have been portfolio weight to overweight in defensive areas of the market like Utilities, Real Estate and Staples as well as Treasury bonds. Those areas are now extremely extended. We will look to take profits out of these sectors and rebalance weights in Technology, Financials, Healthcare, and Communications, which we reduced previously.
This rebalancing of risk will not dramatically increase our equity exposure; as noted above, the longer-term technical outlook remains cautious. We are very late-cycle in the current market, but with the Fed still intervening, we must give deference to the “bullish bias,” which remains at the moment. In other words, it is not time to be “bearish” yet, but “cautious” is likely a better attitude to have.
With bond yields plummeting this past week, our bond exposures have gotten extremely stretched. The sell-off in the market, combined with the “risk off” rotation to bonds, sets the market up for a reflexive bounce. The duration and magnitude of that bounce will be critical as to our next steps in positioning.
A reflexive bounce that fails at the bottom of the trendline from the October lows (red dashed line) will be fairly negative, and suggest lower lows are coming. With February typically a “weak month” anyway, there is a high likelihood of this event occurring, especially if the virus is not contained soon.
If the bounce holds the 50-dma, and reclaims the bullish trendline, then a run back towards the previous highs is likely. This is will likely coincide with a containment of the virus, or help from the Fed in terms of “guidance” combined with an extension of “Repo” funding past April.
Our reduced positioning has helped shelter our portfolios this month, as portfolio drag was about 1/3rd of the overall market. We can now use our stored cash to take advantage of some trading opportunities that have presented themselves.
The “bullish bias” is not dead as of yet, and investors will be quick to try and “write off” the impact of the “virus.” After a decade of “macro-events” not stopping the bullish charge, the belief the market is “bulletproof” has become so deeply ingrained into investor mentality it won’t be dislodged until it is far too late to matter.
Is this “the” event that triggers the next “bear market” and “recession?”
Maybe. Maybe not.
We won’t know for sure until after the fact. But this is why we manage risk in the short-term, so that we can navigate the “twists and turns” of the market without careening off the cliff.

The Macro View

If you need help or have questions, we are always glad to help. Just email me.
See You Next Week
By Lance Roberts, CIO
Financial Planning Corner
REGISTER NOW for our most popular workshop: THE RIGHT LANE RETIREMENT CLASS
- The Westin, Austin at the Domain- 11301 Domain Drive, Austin, TX 78758
- February 8th from 9-11am.

You’ll be hearing more about more specific strategies to diversify soon, but don’t hesitate to give me any suggestions or questions.
by Richard Rosso, CFP®, CIMA®
Market & Sector Analysis
Data Analysis Of The Market & Sectors For Traders
MISSING THE REST OF THE NEWSLETTER?
This is what our RIAPRO.NET subscribers are reading right now!
- Sector & Market Analysis
- Technical Gauges
- Sector Rotation Analysis
- Portfolio Positioning
- Sector & Market Recommendations
- Client Portfolio Updates
- Live 401k Plan Manager

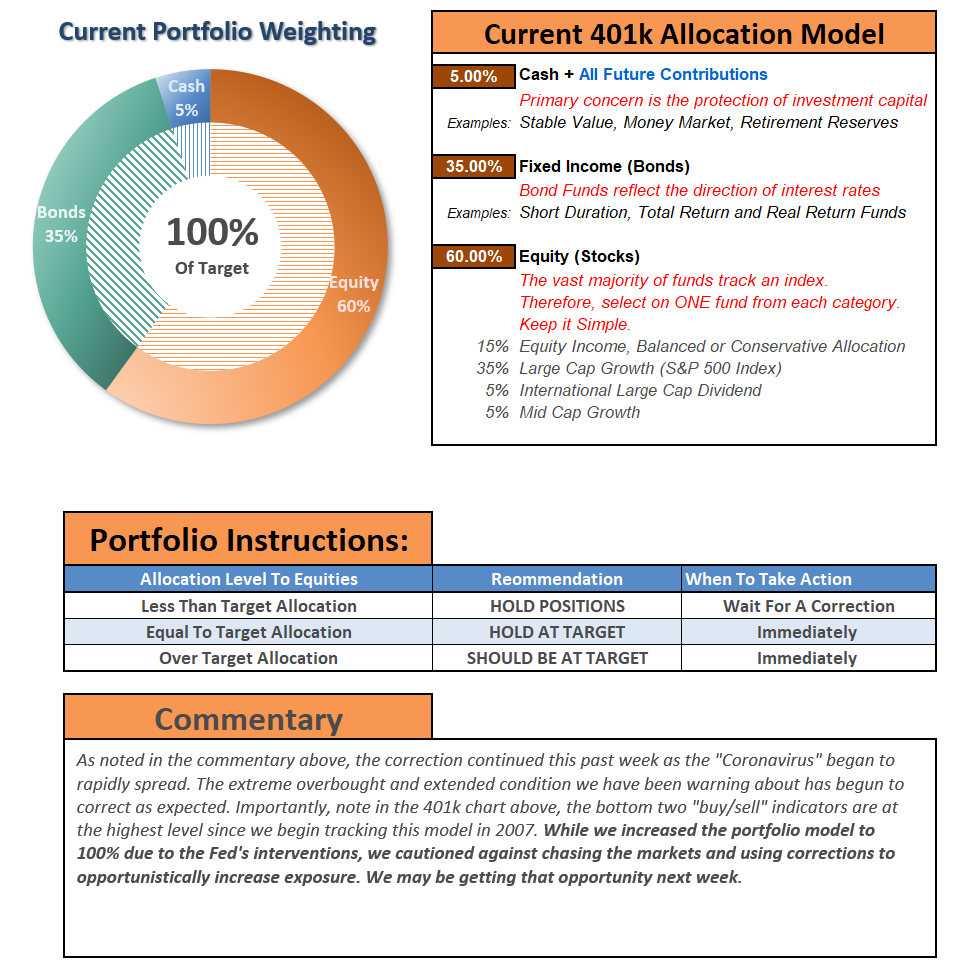
THE REAL 401k PLAN MANAGER
A Conservative Strategy For Long-Term Investors
The 401k plan allocation plan below follows the K.I.S.S. principle. By keeping the allocation simplified, it allows for better control of the allocation, and closer tracking to the benchmark objective over time. (If you want to make it more complicated, you can, however, statistics show simply adding more funds does not increase performance to any significant degree.)
If you need help after reading the alert; do not hesitate to contact me.
Click Here For The “LIVE” Version Of The 401k Plan Manager
See below for an example of a comparative model.
Model performance is based on a two-asset model of stocks and bonds relative to the weighting changes made each week in the newsletter. This is strictly for informational and educational purposes only and should not be relied upon for any reason. Past performance is not a guarantee of future results. Use at your own risk and peril.

401k Plan Manager Live Model
As an RIA PRO subscriber (You get your first 30-days free) you have access to our live 401k p
The code will give you access to the entire site during the 401k-BETA testing process, so not only will you get to help us work out the bugs on the 401k plan manager, you can submit your comments about the rest of the site as well.
We are building models specific to company plans. So, if you would like to see your company plan included specifically, send me the following:
- Name of the company
- Plan Sponsor
- A print out of your plan choices. (Fund Symbol and Fund Name)
If you would like to offer our service to your employees at a deeply discounted corporate rate, please contact me.


