
Inside This Week’s Bull Bear Report
- Market Review & Update
- Trading An Unstoppable Bull Market
- How We Are Trading It
- Research Report – Debts, Deficits & Why $32 Trillion Matters
- Youtube – Before The Bell
- Market Statistics
- Stock Screens
- Portfolio Trades This Week
Market Review & Update
Patience has been hard to come by as stock prices continue trading higher.
“We must remember that market advances can only go so far before an eventual correction occurs. My best guess is that if the markets are to reach all-time highs this year, we will likely have a correction to reset some of the more extreme overbought conditions, as shown below. Any pullback to the 50-DMA is likely a good entry point to increase exposure on a better risk/reward basis.”
As shown below, the S&P 500 is set to close out its fifth straight month of gains. In addition to being up six out of the seven months this year, returns are unusually high, with the S&P advancing 18% year-to-date.
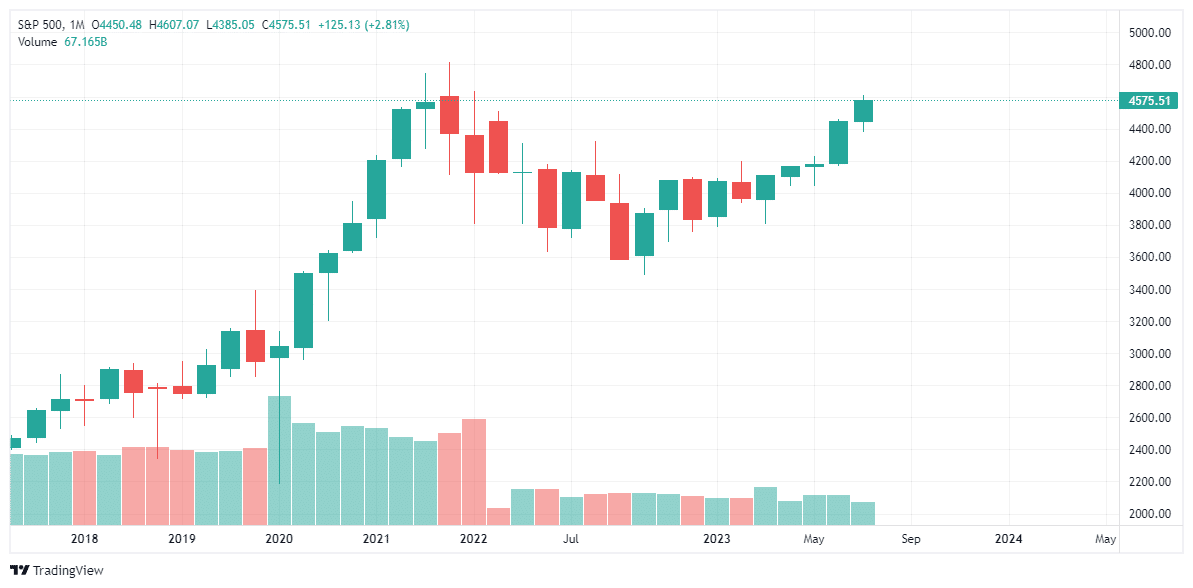
There is little doubting the incredibly bullish tailwind for the US equities despite the Fed hiking interest rates and reducing its balance sheet. Regardless, if we look at the six prior times the S&P 500 was up five straight months in July, the return for the year’s balance was 8% on average with a 100% win rate.
Broadening the analysis to include only those years when the January-through-July returns were 10% or more yields a more robust sample size of 21 instances going back to 1960. These years return on average 4.8% from August to December, with 95% of the results positive. (The only negative return was in 1987 due to the Black Monday crash.)
I certainly understand and have repeatedly acknowledged the many bearish and recessionary signals. While those signals continue to suggest a recessionary economic outcome, which should lead to lower stock prices by its very nature, there is an undeniable momentum in the markets. As such, we have to trade the market we have while remaining on alert for risks as they develop.
Need Help With Your Investing Strategy?
Are you looking for complete financial, insurance, and estate planning? Need a risk-managed portfolio management strategy to grow and protect your savings? Whatever your needs are, we are here to help.

Trading An Unstoppable Bull Market
The bull market that started in October has surprised many, given the number of traditionally more bearish indicators such as inverted yield curves, leading economic indicators, and rising interest rates. However, as the market has risen, it pressures managers to increase exposure, pushing asset prices higher. For many individuals trading a rising stock market is difficult because of the expectation that the resumption of the “bear market” is inevitable.
The bullish excitement is evident when looking at the long-term relationship between stocks and bonds. The ratio of stocks to bonds has far exceeded that of the “Dot.com” bubble with a similar sharp slope higher.
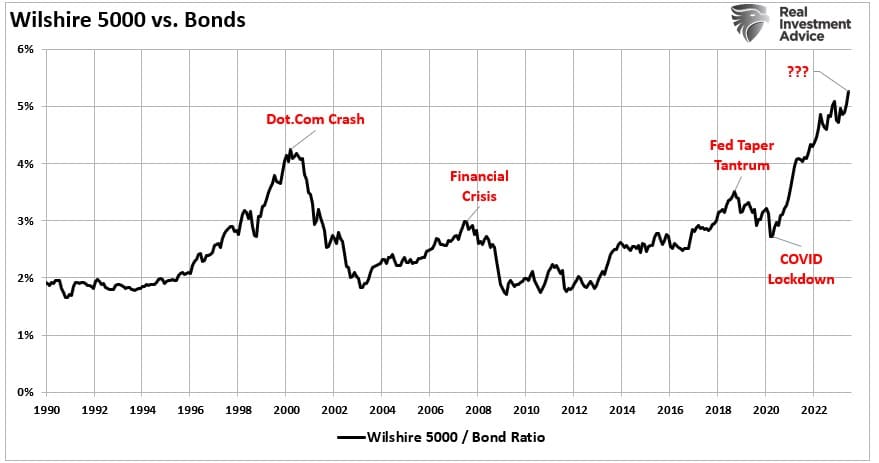
Does that mean the market is about to “crash?” No. But there is an obvious correlation between the detachment of stocks to bonds and historical valuation metrics. However, in the short term, all that matters is price. As we have discussed in “Pet Rocks & Other Signs:”
Valuations are a terrible market timing indicator. However, in the short term valuations tell you everything about market psychology. In the long term, they tell you everything about expected returns.
Currently, every measure of valuation suggests investors have thrown all “caution to the wind.”
As noted, valuations are a reflection of investor psychology. Currently, at >31x earnings (Shiller’s CAPE ratio), there is little argument that investors are just about as bullish as they can get. The market advance since the beginning of the year is entirely a function of valuation expansion alone.
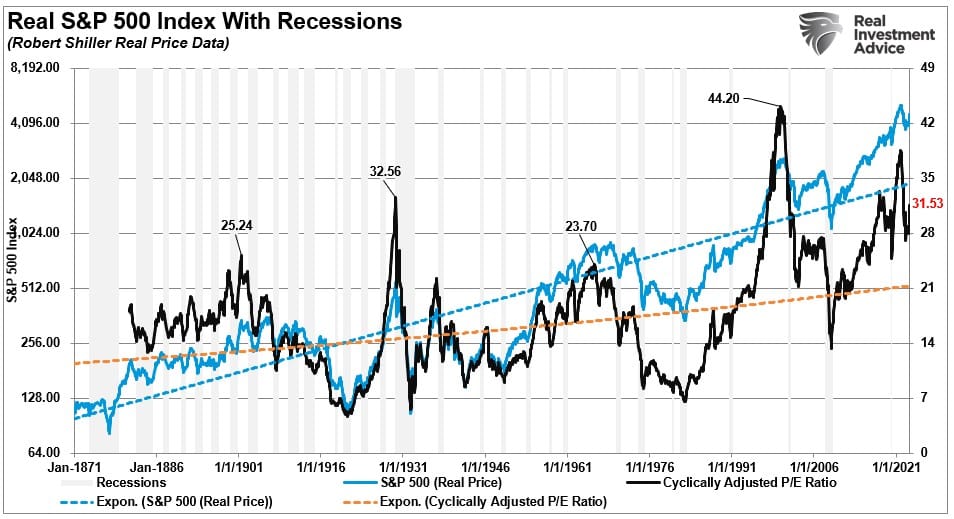
Looking at the chart, it indeed suggests that investors should be selling everything immediately. However, given this is monthly data, these turns can and do take much longer than expected. This “lag” leads investors in the short term to believe that “valuations” no longer matter. Such is a dangerous assumption that investors paid dearly for in the past. Valuations do matter, and they matter a lot.
However, such is why, in these shorter-term periods, where market prices become detached from underlying fundamentals, we must trade the market relying more on technical analysis.
Navigating WIth Technical Analysis
When it comes to technical analysis, there are millions of different ways to approach it. In addition, there are millions of combinations of technical indicators that investors use to try and decipher market movements.
I am only going to discuss with you how we do it.
Notably, technical analysis does NOT predict the future. It is the study of historical price action, which is the purest representation of the psychology of market participants. From that study, we can make statistical observations about the behavior of market participants in the past. Those assumptions can help form a “guess,” assuming similar variables, about how they may act in the near term.
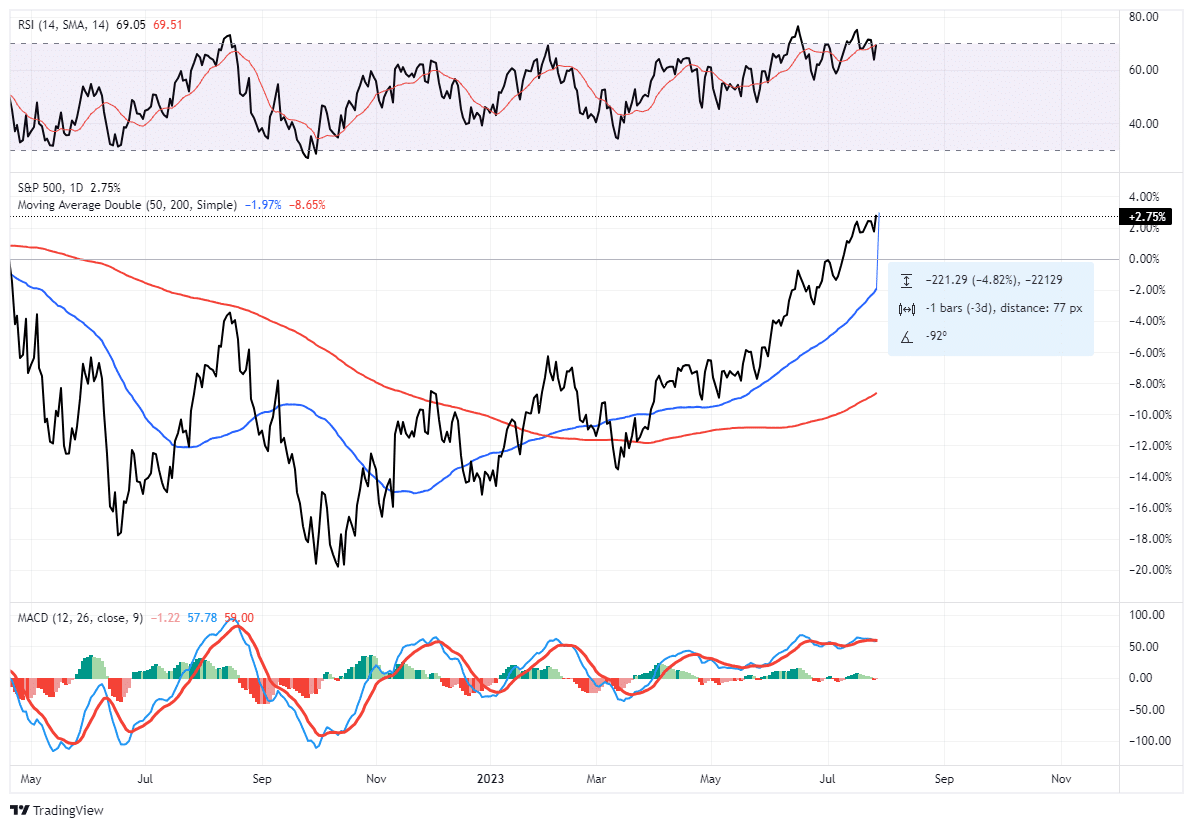
We keep our analysis very simplistic for our portfolio management needs. We use one indicator to signify if prices are overbought or sold, two moving averages to determine the trend of prices, and Bollinger bands to warn of significant deviations from those moving averages. I show the technical setup in the sample chart below from SimpleVisor.com.
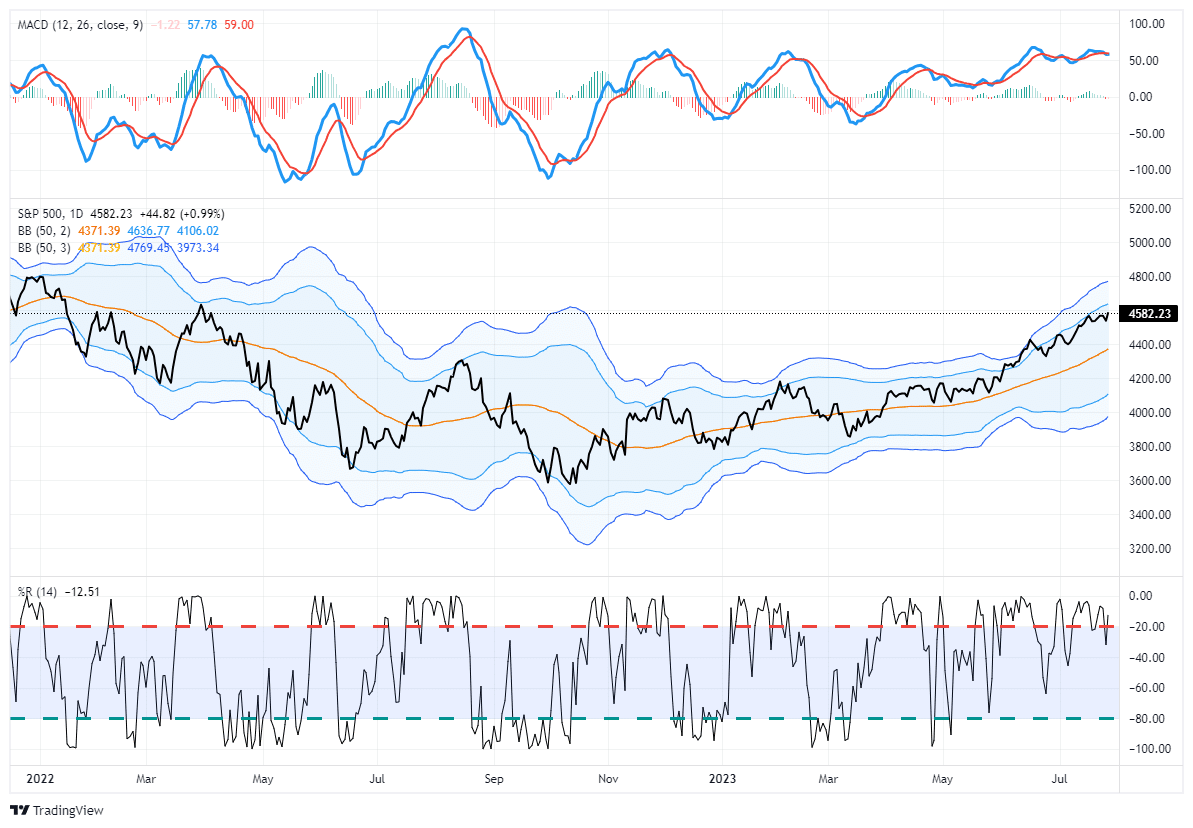
We are looking for either “warning signs” that stocks could be due for a short to intermediate-term corrective period. Or indications they are oversold and ready to advance. Currently, we are dealing with the former.
Historically, when prices move toward the upper bands of 2- or 3-standard deviations above the 50-day moving average (dma), the Williams %R is overbought, and the MACD is crossing lower from a high level, stock prices generally correct to some degree. Such is the potential environment we will likely deal with in the next few weeks as earnings season concludes. Such is also why we have suggested holding off trading portfolios and increasing equity exposure until some of these more overbought conditions are corrected.
Let The Market Tell You
Commandment #1: “Thou Shall Not Trade Against the Trend.” – James P. Arthur Huprich
Let me be very clear. We are discussing risk management. You must understand the market’s overall trend and when it is changing. The negative trend of prices during 2022 is now over, and the market in 2023 is trending positively. That is just what it is.
Currently, we are in a “bull market” advance. As such, we want to maintain our exposure to equity risk. However, this does not mean we should ignore what the market tells us and let the ebbs and flows wash over us. Eventually, another “ebb” will come, and we will want to reduce risk accordingly. However, that is not today.
“In a bull market, you can be either long or neutral. In a bear market, you can only be neutral or short.” – Dennis Gartman
While the market could certainly pull back to the lower of those “bands,” corrections will likely remain confined to the 50-dma. As such, we will want to use those opportunities to trade portfolios into higher levels of equity exposure. With the market more overbought and extended currently, we want to remain cautious about committing our cash reverses to the broad market more aggressively.
“Willingness and ability to hold funds uninvested while awaiting real opportunities is a key to success in the battle for investment survival.” – Gerald Loeb
Trading The Market We Have
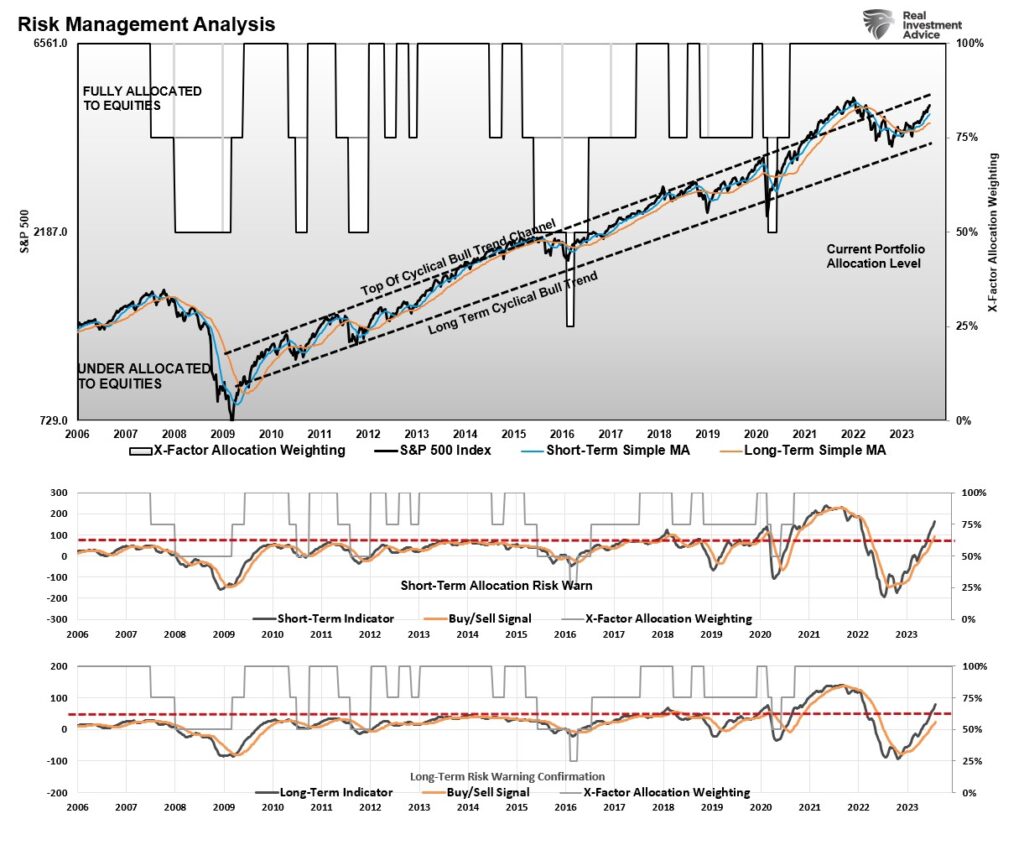
The following chart uses weekly data, so it moves slower. Such makes it less valuable for daily trading but provides better analysis for intermediate-term risk management. The upper part of the chart shows the market trend from the 2009 market lows. You can see where the markets surged above that long-term trend channel following the flood of liquidity from both monetary and fiscal stimulus. The correction in 2022 merely reverted the excess of that advance and returned the bull market to its running trend.
The bottom two panels are longer-term Moving Average Convergence Divergence (MACD) indicators. You can also see the surge of that stimulus in the price indicators, which elevated the oscillators to levels never seen historically. Due to the massive extension, the subsequent reversion was also more significant than that seen during the 2008 financial crisis. These indicators will likely return to pre-stimulus trends and suggest the market is getting sufficiently overbought to generate a short-term correction. However, for now, neither of the indicators is warning of a bigger correction that would warrant a reduction of equity risk in portfolios.
While there are many reasons to remain concerned about this year’s market advance, we must remember that markets can remain irrational much longer than you think. We must carefully trade this “bull market” and apply our risk-management rules regularly.
While many believe “this time is different,” a lot of history from a “technical perspective” suggests it is not.
How We Are Trading It
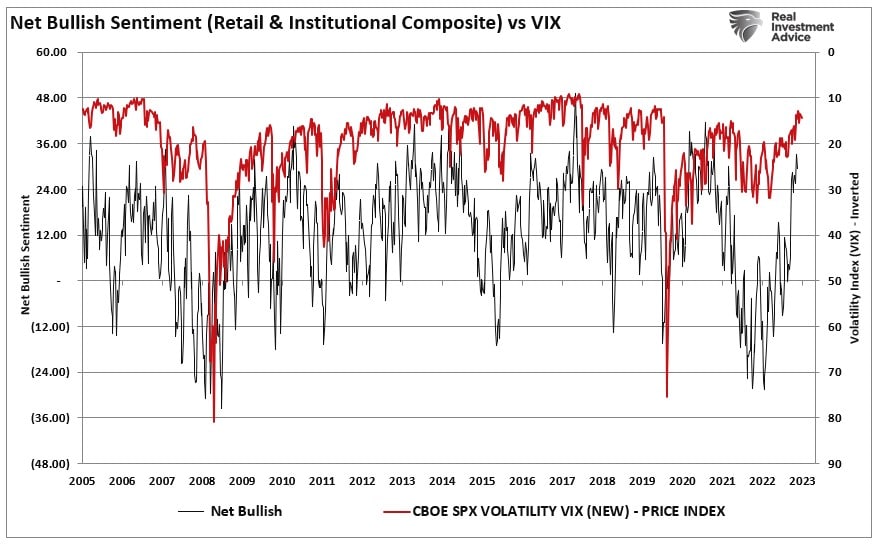
As noted, our gauge of individual and professional investors’ “positioning” is getting overly bullish, which also corresponds to the collapse in the volatility index. From a contrarian position, the higher the allocation to equities, the more likely the market is closer to a correction. The gauge uses weekly closing data, so it moves slower, providing better market signals.
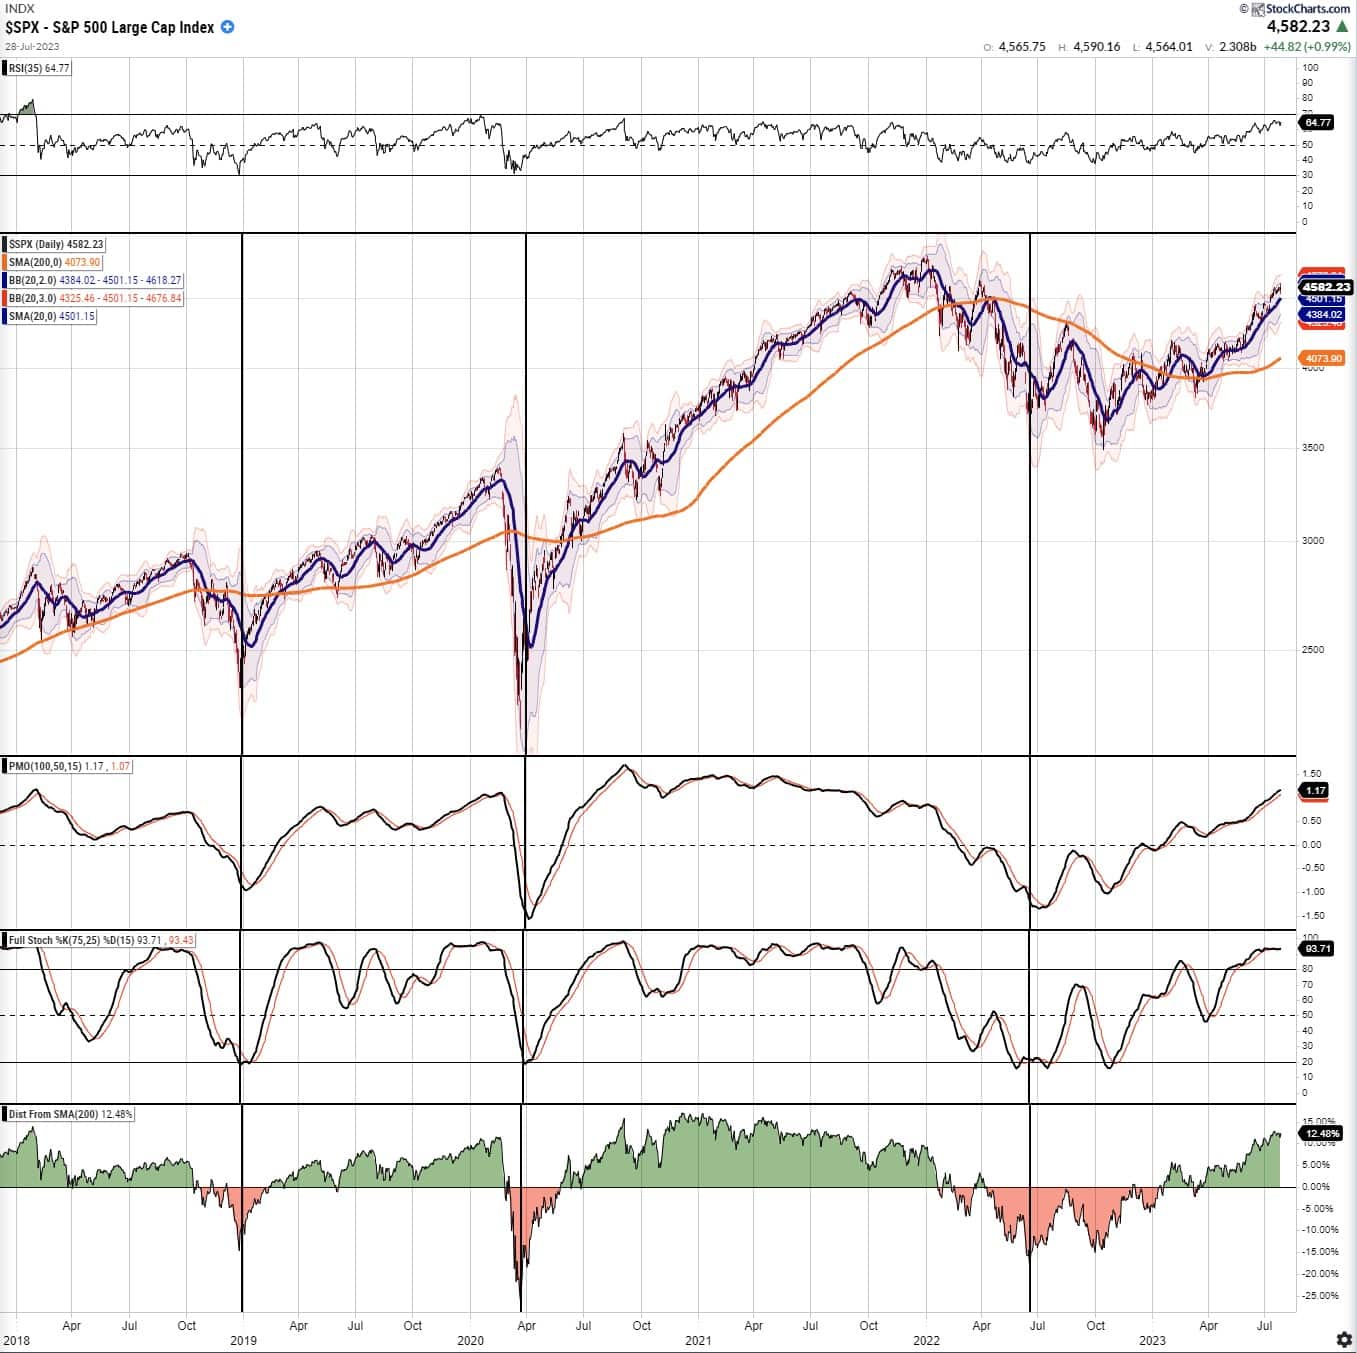
The market trades at elevated levels on a very short-term basis, with many measures pushing extremes. Notably, the market is trading 12.5% above its 200-Day Moving Average. While such does not imply an immediate correction, it does suggest that the upside may be more limited near-term.
With both technical and sentiment readings suggesting the short-term market risks are elevated, it is likely wise that investors use the current speculative frenzy to rebalance portfolio risks accordingly.
- Tighten up stop-loss levels to current support levels for each position.
- Hedge portfolios against more significant market declines.
- Take profits in positions that have been big winners.
- Sell laggards and losers.
- Raise cash and rebalance portfolios to target weightings.
From a portfolio management perspective, we have to trade the market we have rather than the one we think should be. This can make the challenge of battling emotions difficult from week to week. However, as noted, we expect a correction next month, providing a better risk/reward opportunity to increase equity exposure.
For now, the bullish trend continues but is getting very overbought. While we have increased our equity exposure over the last month, we remain underweight overall.
Continue taking action in portfolios accordingly, depending on your risk tolerance and goals. Just remember that no one ever went broke taking a profit.
Have a great weekend.
Research Report

Subscribe To “Before The Bell” For Daily Trading Updates (Formerly 3-Minutes)
We have set up a separate channel JUST for our short daily market updates. Please subscribe to THIS CHANNEL to receive daily notifications before the market opens.
Click Here And Then Click The SUBSCRIBE Button
Subscribe To Our Youtube Channel To Get Notified Of All Our Videos
Bull Bear Report Market Statistics & Screens

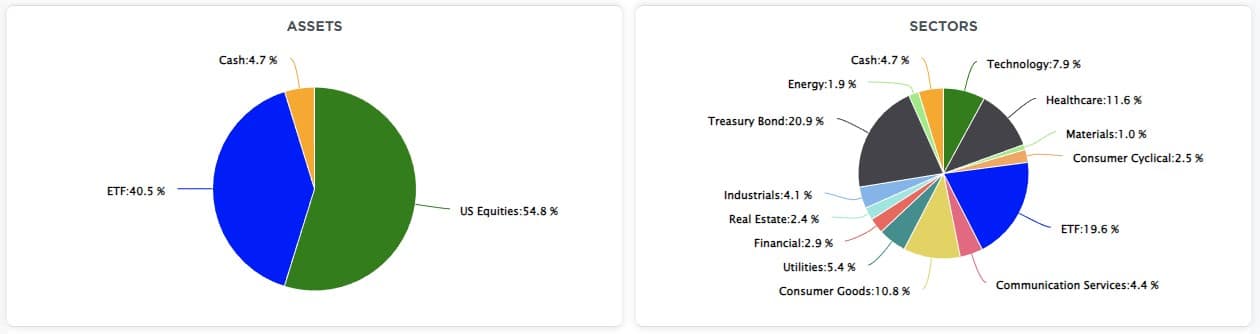
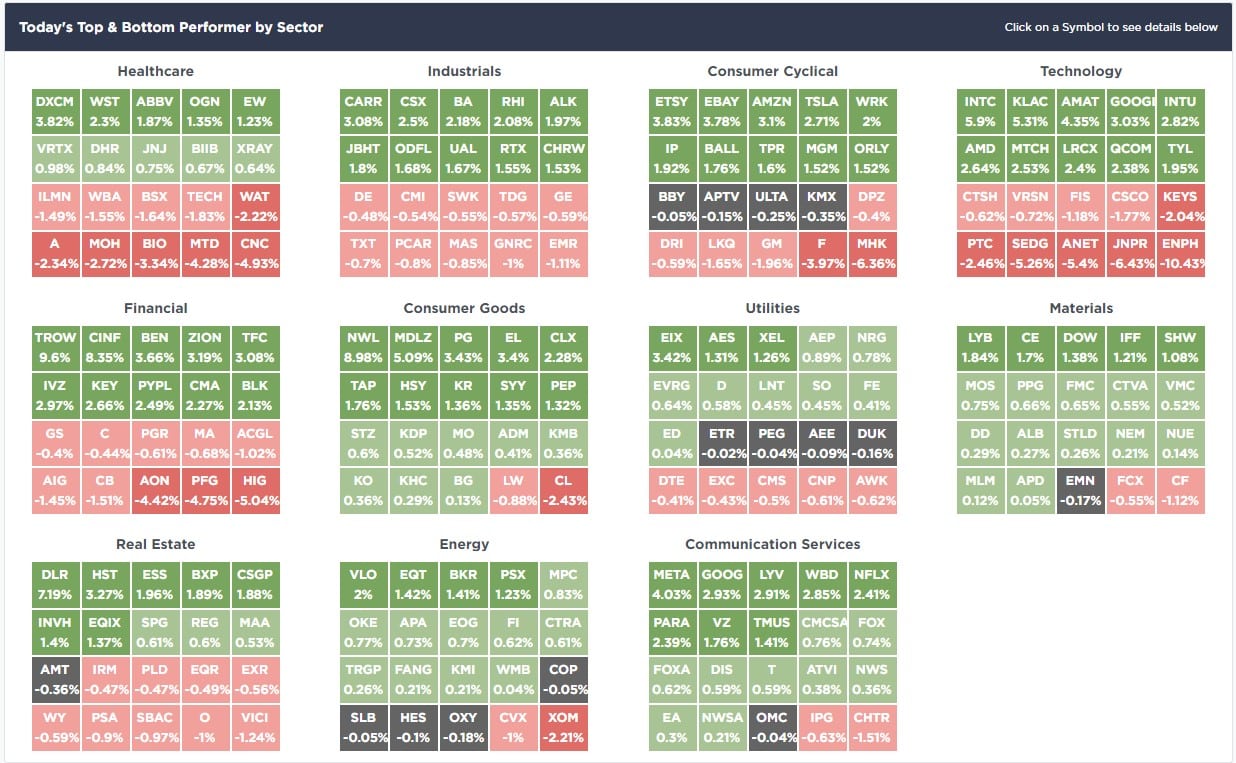
SimpleVisor Top & Bottom Performers By Sector
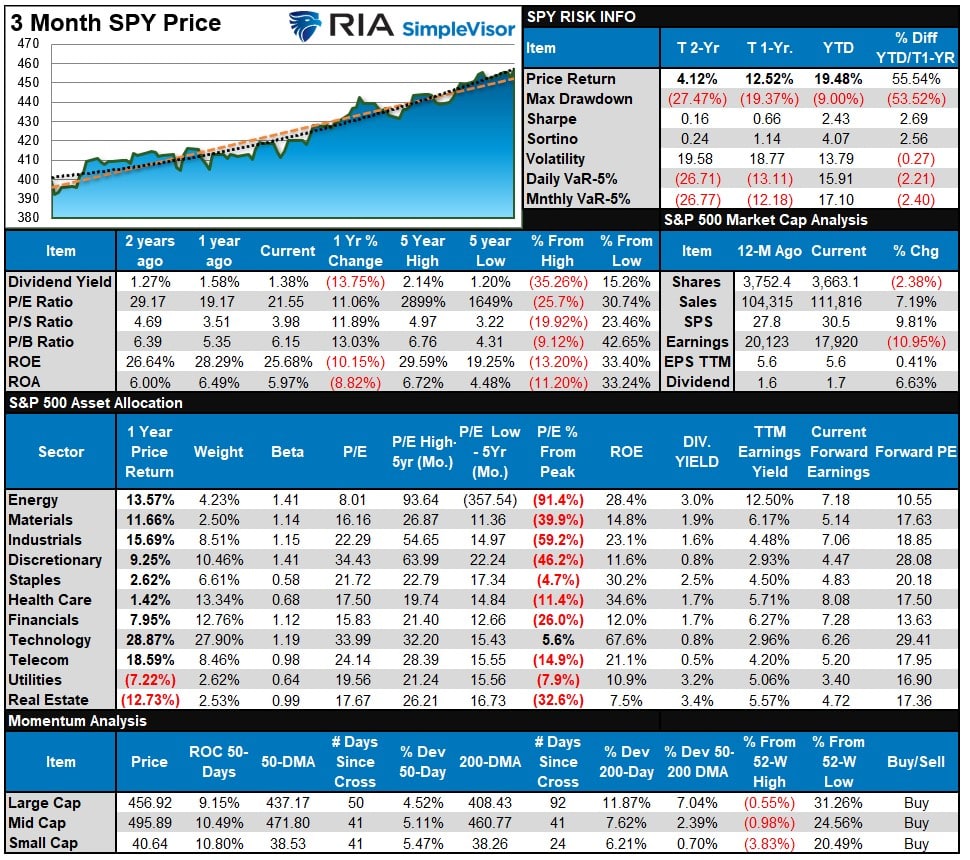
S&P 500 Weekly Tear Sheet
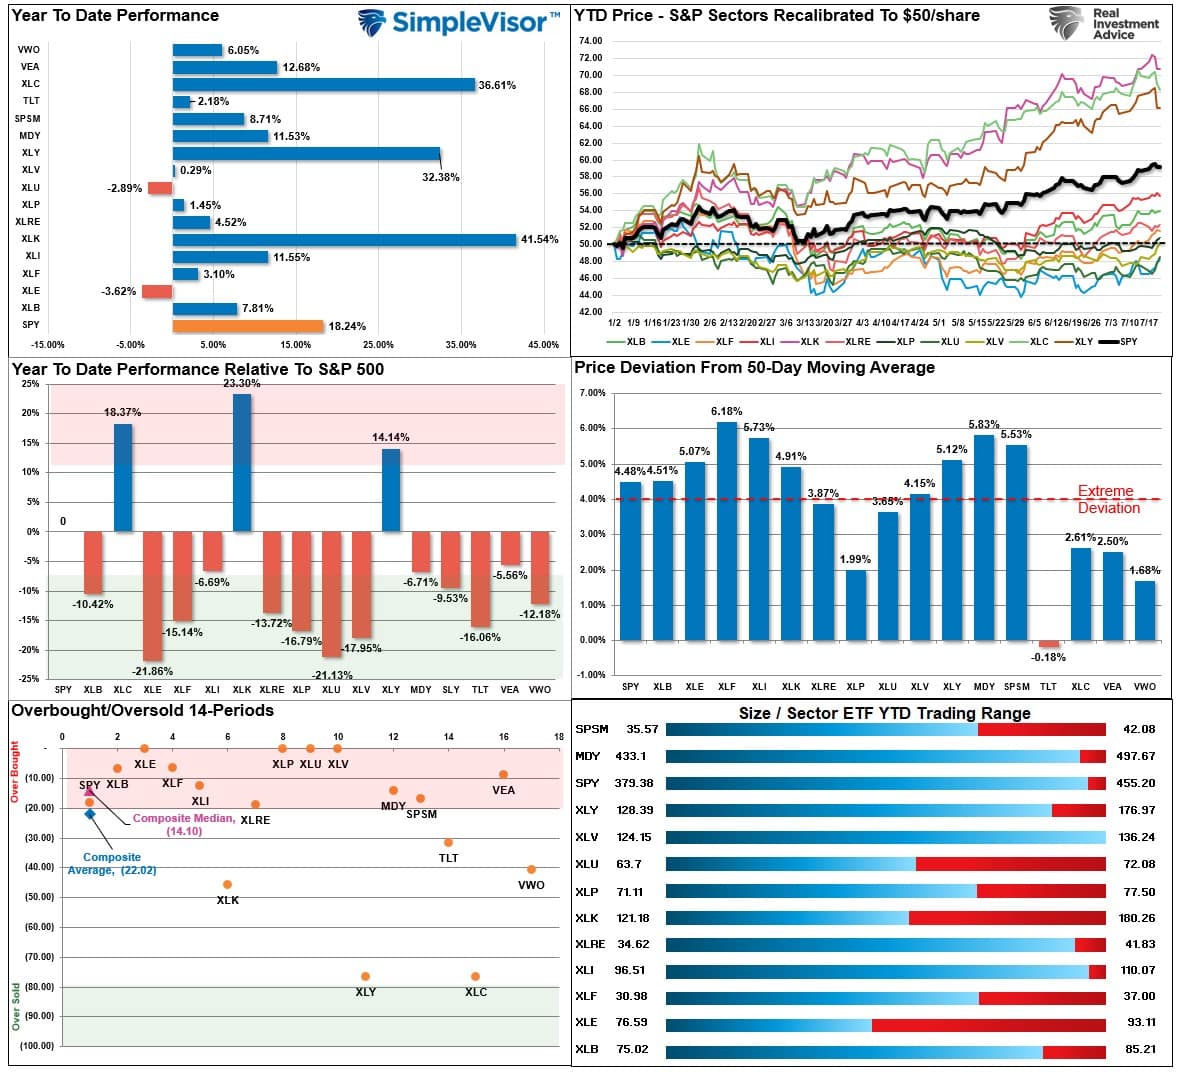
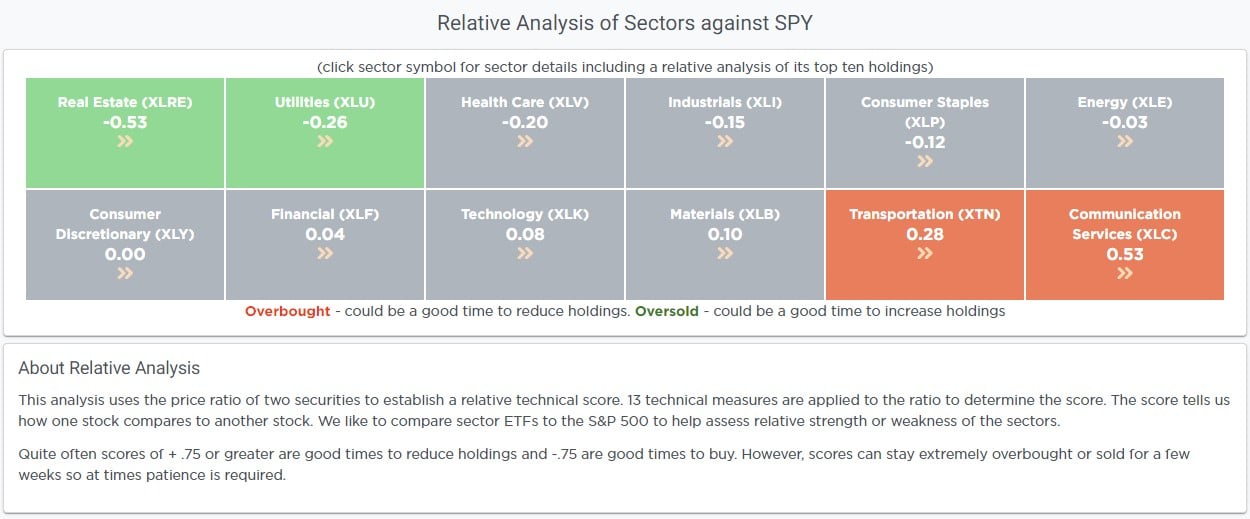
Relative Performance Analysis
Even though the overall market is advancing, we are seeing the rotation from the previous leaders to the laggards. This year, there is still a significant bifurcation in relative performance, with many sectors trading well above respective moving averages. The market is due for a correction, but downside risk will be limited near term. Use pullbacks to support opportunistically to increase equity exposures.
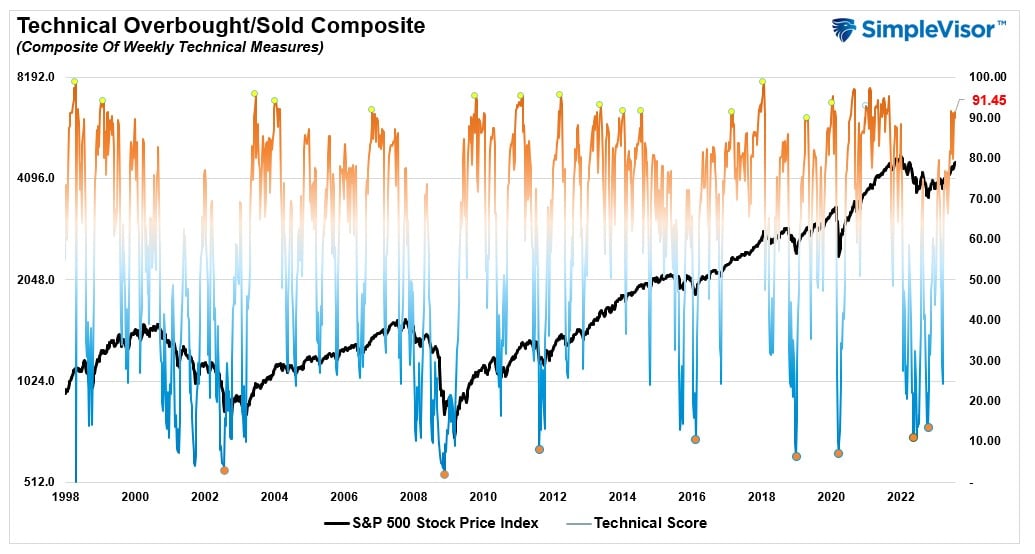
Technical Composite
The technical overbought/sold gauge comprises several price indicators (R.S.I., Williams %R, etc.), measured using “weekly” closing price data. Readings above “80” are considered overbought, and below “20” are oversold. The market peaks when those readings are 80 or above, suggesting prudent profit-taking and risk management. The best buying opportunities exist when those readings are 20 or below.
The current reading is 91.45 out of a possible 100.
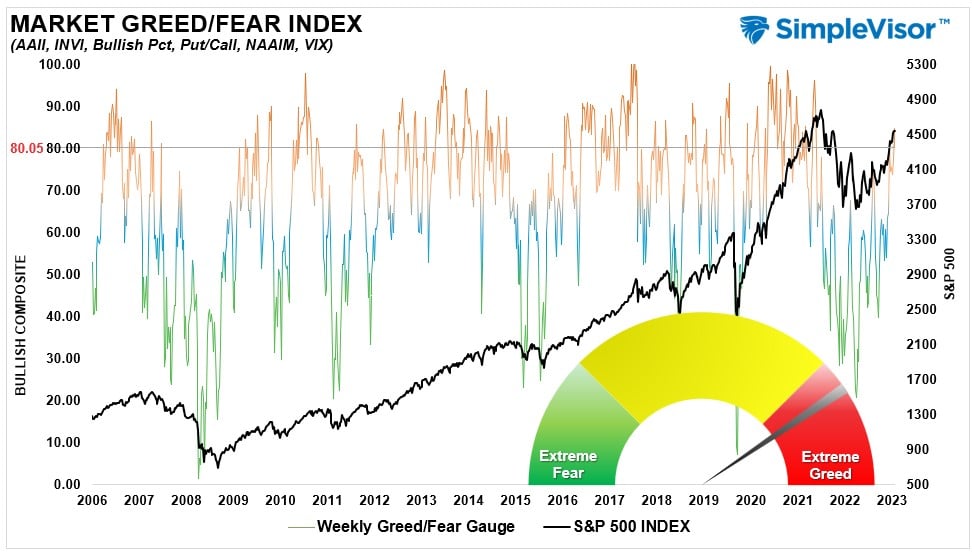
Portfolio Positioning “Fear / Greed” Gauge
The “Fear/Greed” gauge is how individual and professional investors are “positioning” themselves in the market based on their equity exposure. From a contrarian position, the higher the allocation to equities, the more likely the market is closer to a correction than not. The gauge uses weekly closing data.
NOTE: The Fear/Greed Index measures risk from 0 to 100. It is a rarity that it reaches levels above 90. The current reading is 80.05 out of a possible 100.
Relative Sector Analysis
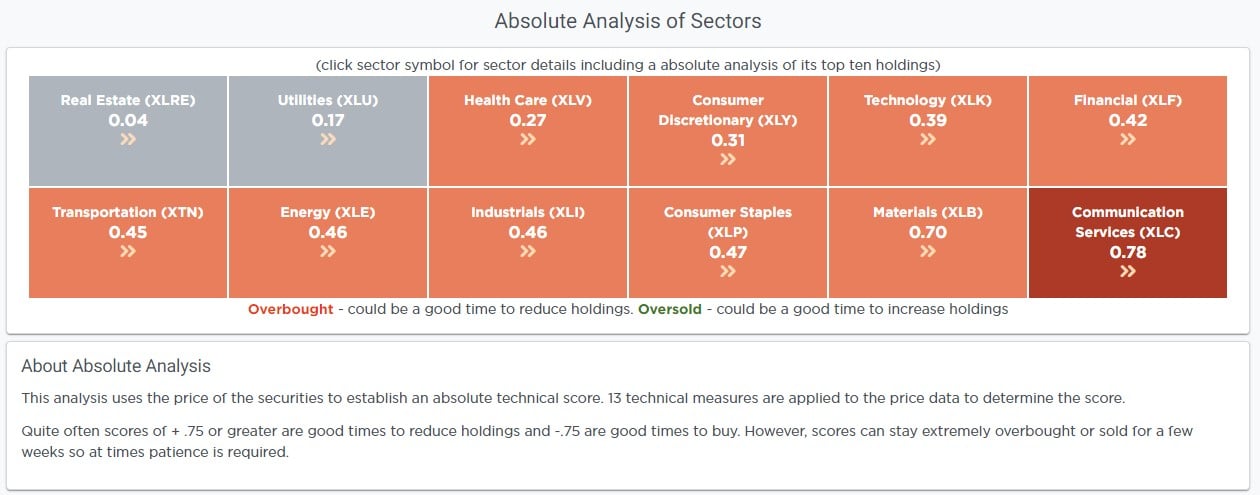
Absolute Sector Analysis
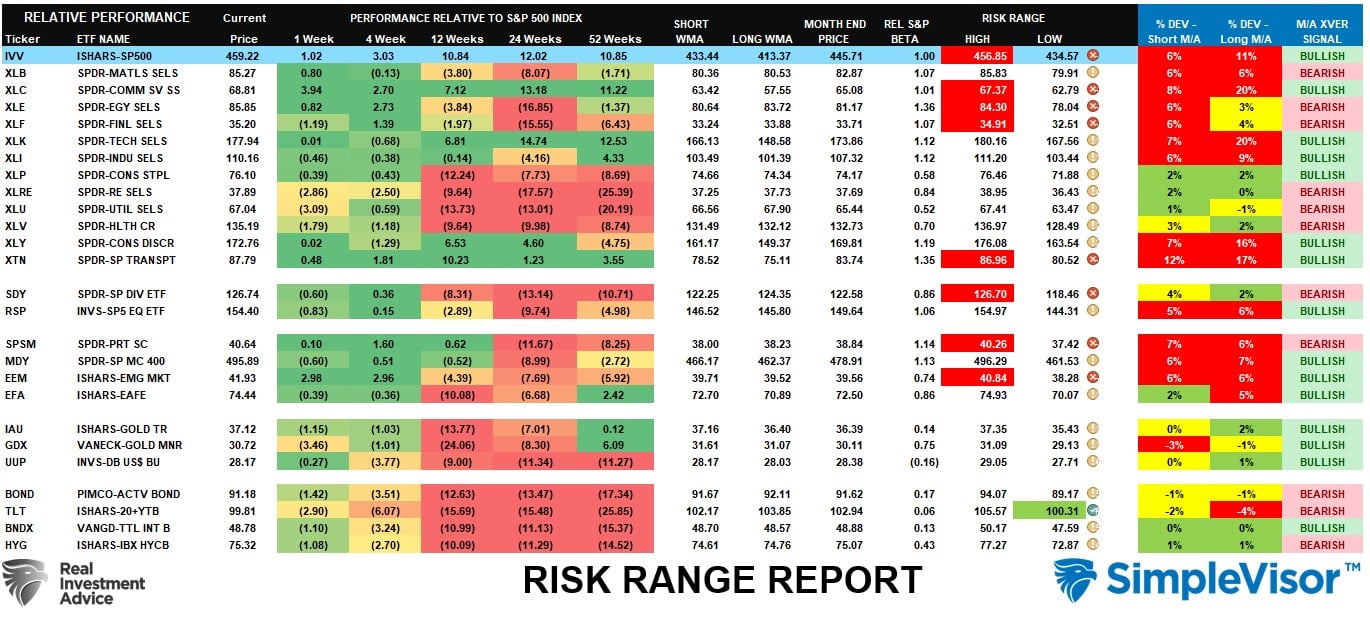
Sector Model Analysis & Risk Ranges
How To Read This Table
- The table compares the relative performance of each sector and market to the S&P 500 index.
- “MA XVER” (Moving Average Cross Over) is determined by the short-term weekly moving average crossing positively or negatively with the long-term weekly moving average.
- The risk range is a function of the month-end closing price and the “beta” of the sector or market. (Ranges reset on the 1st of each month)
- The table shows the price deviation above and below the weekly moving averages.
The market rallied nicely for July, pushing both the overall market and several sectors well outside of normal risk ranges. The increasing number of sectors deviating well above their respective short- and long-term moving averages increases the likelihood of correction to reverse some of those conditions in the next month or so. With bonds oversold, look for a short-term rotation from stocks to bonds, which should provide a decent entry point to increase overall equity exposures.
Weekly SimpleVisor Stock Screens
We provide three stock screens each week from SimpleVisor.
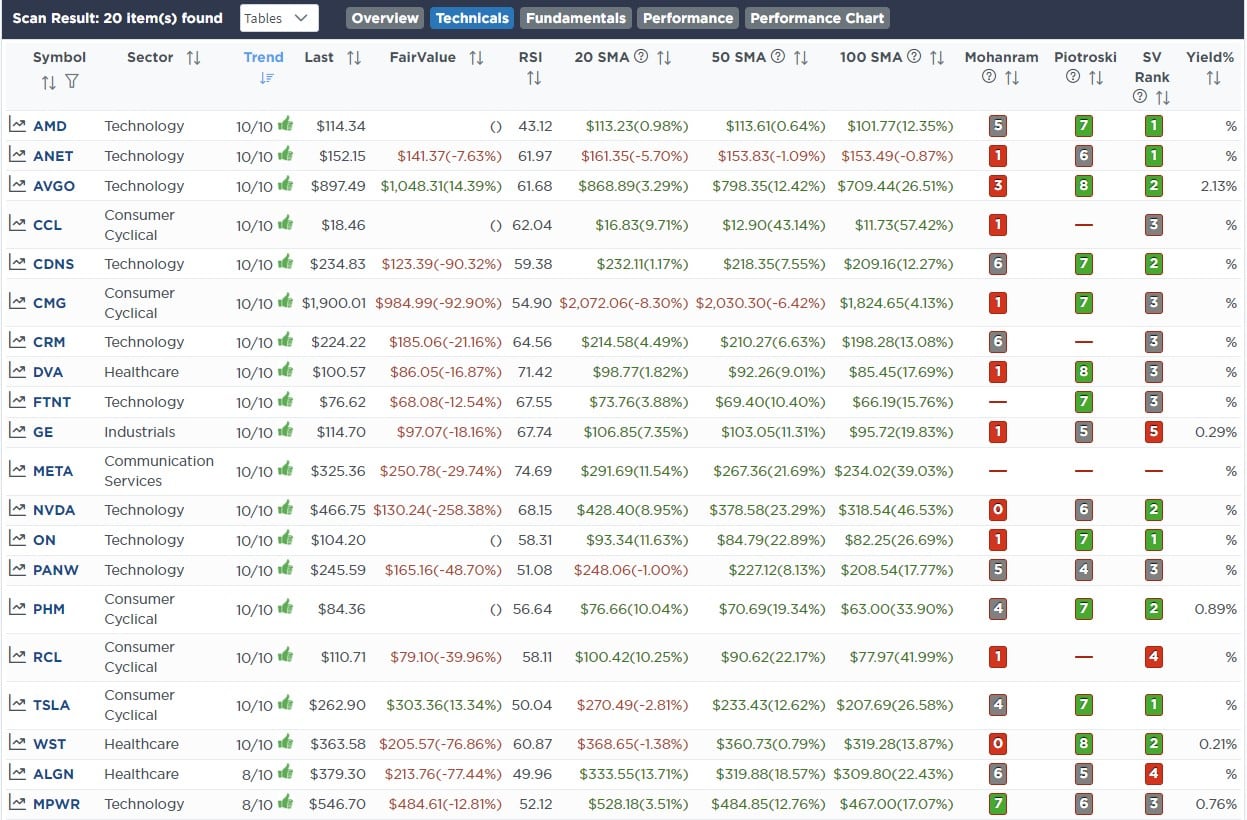
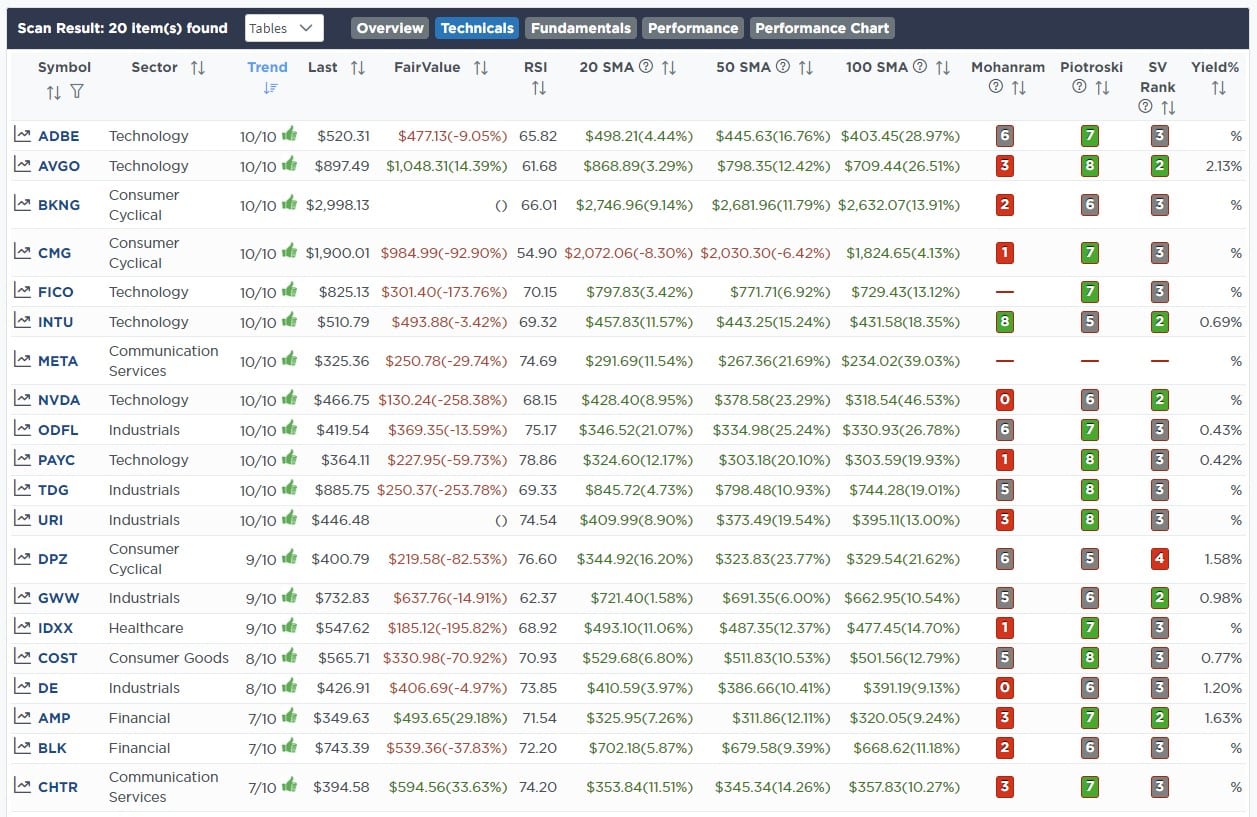
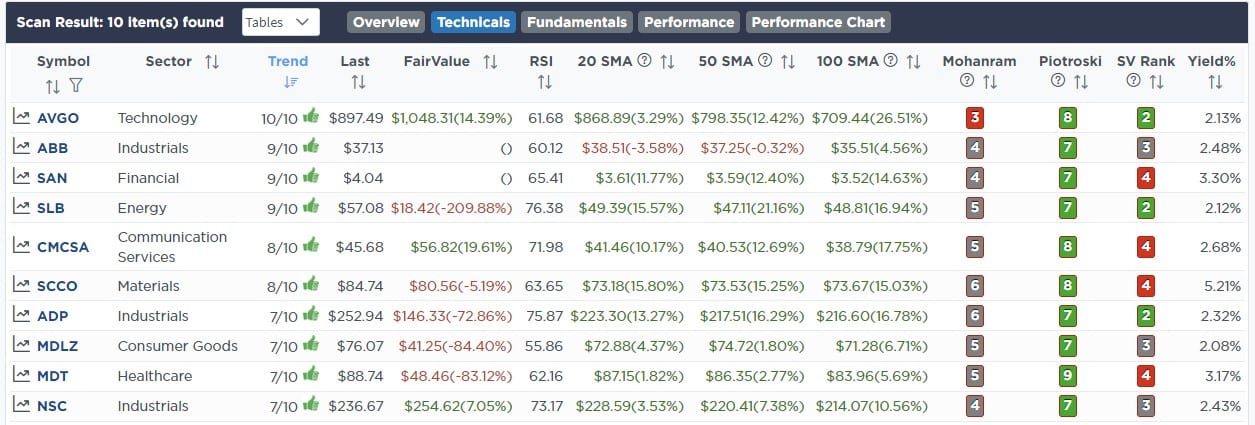
This week we are searching for the Top 20:
- Relative Strength Stocks
- Momentum Stocks
- Technically Strong Stocks With Dividends
(Click Images To Enlarge)
R.S.I. Screen
Momentum Screen
Technically Strong With Dividends
SimpleVisor Portfolio Changes
We post all of our portfolio changes as they occur at SimpleVisor:
July 25th
As we move into Q3, we have started doing a bit of portfolio rebalancing to align the portfolio closer to our benchmark index. While we are still too underweight in technology, we will have to await a correction to rebalance that exposure as needed. For now, we are taking a slow approach by selectively rebalancing portfolio positioning opportunistically.
Equity Model
- Reducing CostCo (COST) to model weight of 3% of the portfolio.
- Trimming Abbott Laboratories (ABT) to 2.5% of the portfolio (we were overweight healthcare relative to the benchmark index.)
- Increase Altria (MO) to 3% of the portfolio to increase yield in the portfolio.
July 26th
This morning we are buying RTX and MSFT on earnings-related dips.
RTX fell over 15% at one point yesterday before recovering slightly. Earnings and guidance were positive, but in a surprise to investors, they set aside $500 million to deal with an issue regarding their Pratt Whitney engines that will require costly inspections. RTX’s Free cash flow estimates for 2025 are unaffected. The market shaved about $20 billion off its valuation for what appears to be a much smaller expense. MSFT is down a few percent on earnings and about 8% from recent highs. It is approaching its 50dma which should provide support. We are increasing weights slightly for both positions in the equity model.
Equity Model
- Increase RTX Technologies (RTX) to 2.5% of the portfolio value.
- Bring Microsoft (MSFT) up to 3% of the total portfolio value.

Lance Roberts, C.I.O.
Have a great week!

