
Inside This Week’s Bull Bear Report
- Market Volatility Returns
- Is A Rolling Recession Helping Markets?
- How We Are Trading It
- Research Report – Breakeven Inflation Rates Are Falling.
- Youtube – Before The Bell
- Stock Of The Week
- Daily Commentary Bits
- Market Statistics
- Stock Screens
- Portfolio Trades This Week
Market Volatility Returns
Is a “rolling recession” helping the markets? Such was a thought proposed by Liz Ann Sonders last week that is worth thinking about. However, before that, let’s review the market action from this week.
The bull market is officially back, with the 50-DMA now well above the 200-DMA and BOTH moving averages trending higher. Notably, the MACD buy signals remain intact, which suggests that investors maintain increased equity exposures.
However, even with all of the bullish signals confirming a move higher in the market is likely, such does NOT mean there won’t be 5 to 10% corrections along the way that can be used to increase equity exposure.
This past week, the market began showing signs of exhaustion after the recent advance from the March lows. While the market holds important support, more selling pressure appeared late in the week, even amid earnings season, where many companies were beating, albeit drastically lowered, estimates.
As shown, the MACD buy signal remains intact but is very close to triggering a sell signal which could occur next week. As such, we removed our major market index trading positions from our portfolios yesterday. With some additional cash on hand to hedge a pullback, we will look for an opportunity to increase exposures again later.
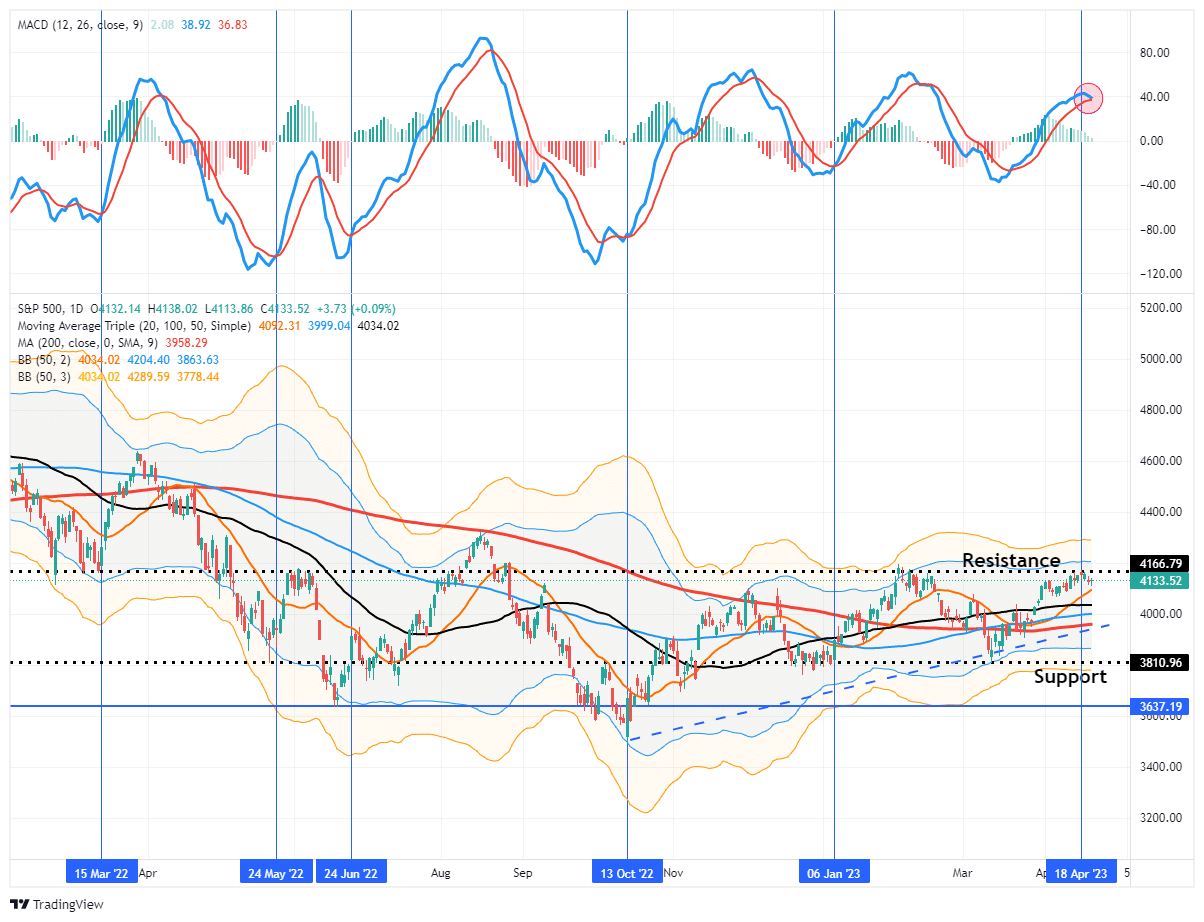
While the market could pull back some, there is no risk of a significant decline in the short term. With numerous levels of support directly beneath the market, with the 20-DMA providing immediate support, a correction will likely remain limited. More importantly, the rising bullish trend line from the lows suggests the maximum pullback will likely be 4000 on the index.
However, this brings us to this week’s analysis. Despite many bearish headlines, podcasts, predictions, and gurus, the market has traded with a bullish bias. Could one explanation be that we are already in a rolling recession that is running through the economy?
Need Help With Your Investing Strategy?
Are you looking for complete financial, insurance, and estate planning? Need a risk-managed portfolio management strategy to grow and protect your savings? Whatever your needs are, we are here to help.

Is A Rolling Recession Helping The Market?
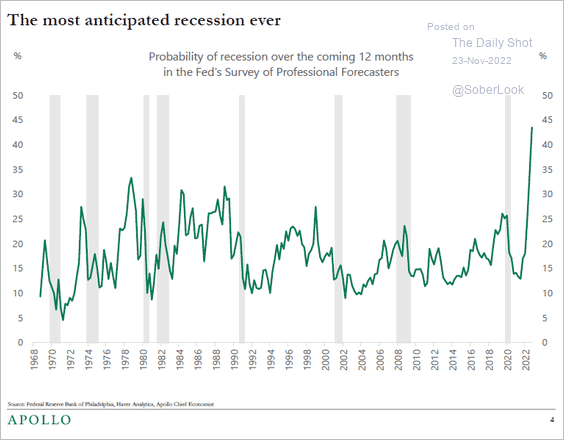
Last Friday, I was interviewed by Charles Payne on Fox Business, preceded by Liz Ann Sonders from Charles Schwab. I could hear her interview in my earpiece, and she was asked if she was worried about the impending recession, which is widely expected by the financial community. Her answer was quite thought-provoking as she responded (I am paraphrasing):
“We have been discussing the idea of a rolling recession in the economy over the past year, rather than a recession where the bottom falls out of everything at once.“
This idea is important as it aligns with comments we have made previously about the excessively negative sentiment that prevailed in the financial markets. As noted in “No Recession In 2023?”
“But what bothers us with the recession/hard landing view is that everyone thinks the same. As Bob Farrell once said, ‘When all experts agree, something else tends to happen.‘”
With everyone expecting a recession, it wasn’t surprising that we saw extremely “bearish” sentiment in the markets. To wit:
“As a contrarian investor, excesses get built by everyone being on the same side of the trade. Currently, everyone is so bearish that the reflexive trade will be rapid when the shift in sentiment occurs. As Sam Stovall, the investment strategist for Standard & Poor’s, once stated, ‘If everybody’s optimistic, who is left to buy? If everybody’s pessimistic, who’s left to sell?’”
The critical point is that market participants have had a highly bearish view of the economy for over a year. Such has given the markets time to “price in” that view, hence the decline from the January peak. As shown below, each time an event occurred, the market declined, priced in that event, and then rallied.
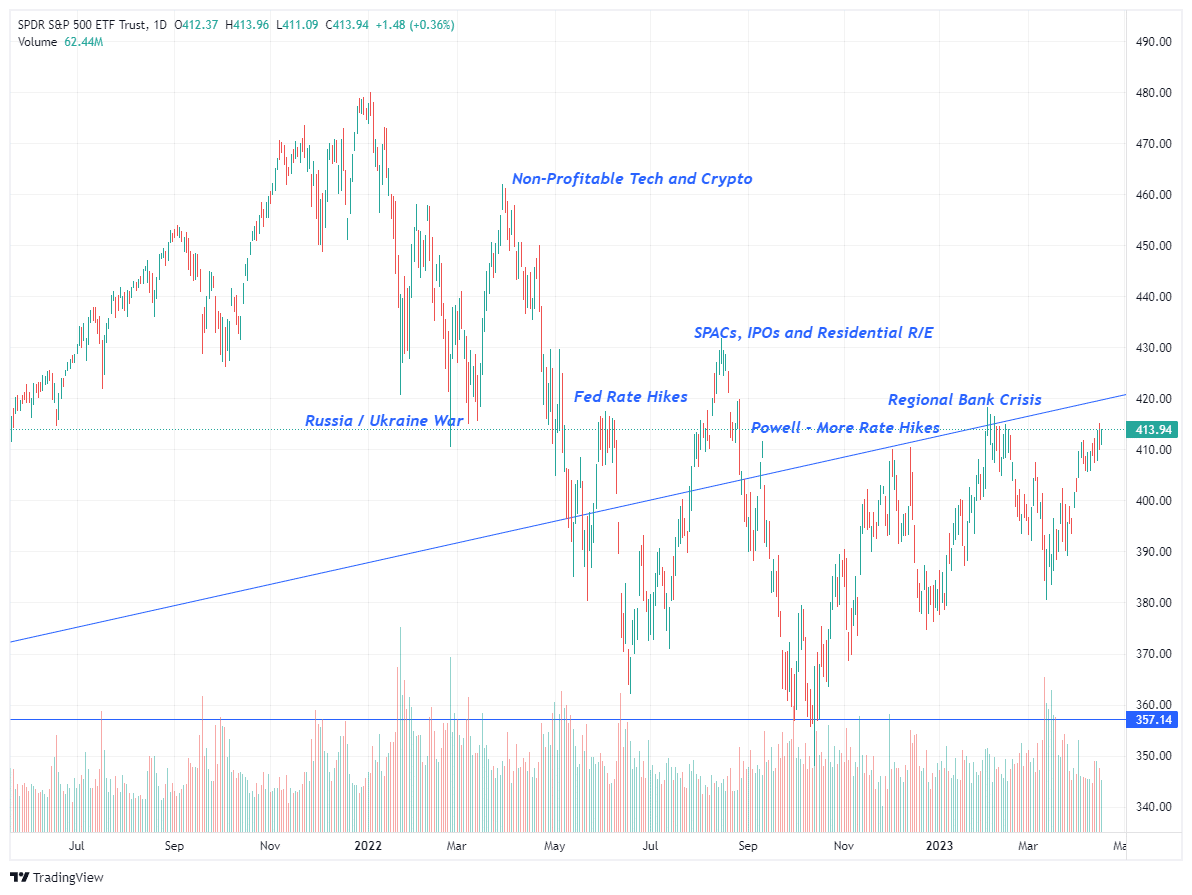
The importance of the analysis is that, given the spacing out of these events, the market absorbed these small blows. With expectations and positioning extremely bearish, investors had to reposition accordingly when these small blows didn’t turn into a “knockout” punch.
Burning Off Excesses
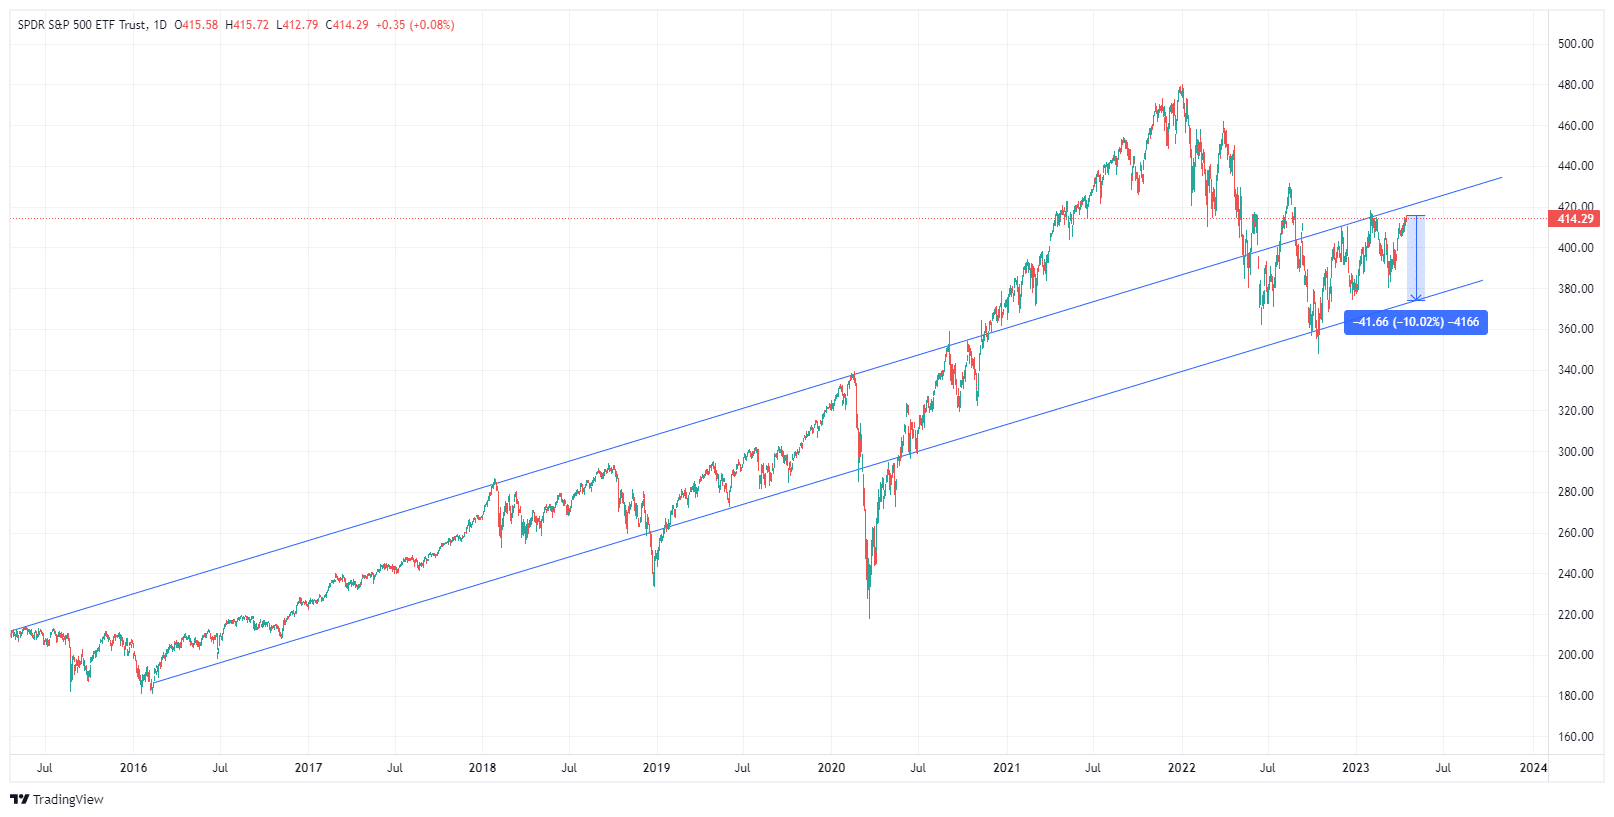
Looking at a short-term market chart can undoubtedly cause concern. However, a longer-term picture provides some critical context to current market dynamics.
Since 2015, the market has traded in a well-defined bullish trend. Any breakout above or below that channel was quickly resolved. Notably, the market remains well above its 2019 peak. This is why the Fed continues to tighten policy as the “wealth effect” remains well entrenched, supporting inflationary concerns.
In late 2020, the market surged above the bullish trend channel as massive fiscal and monetary interventions fueled enormous speculation.
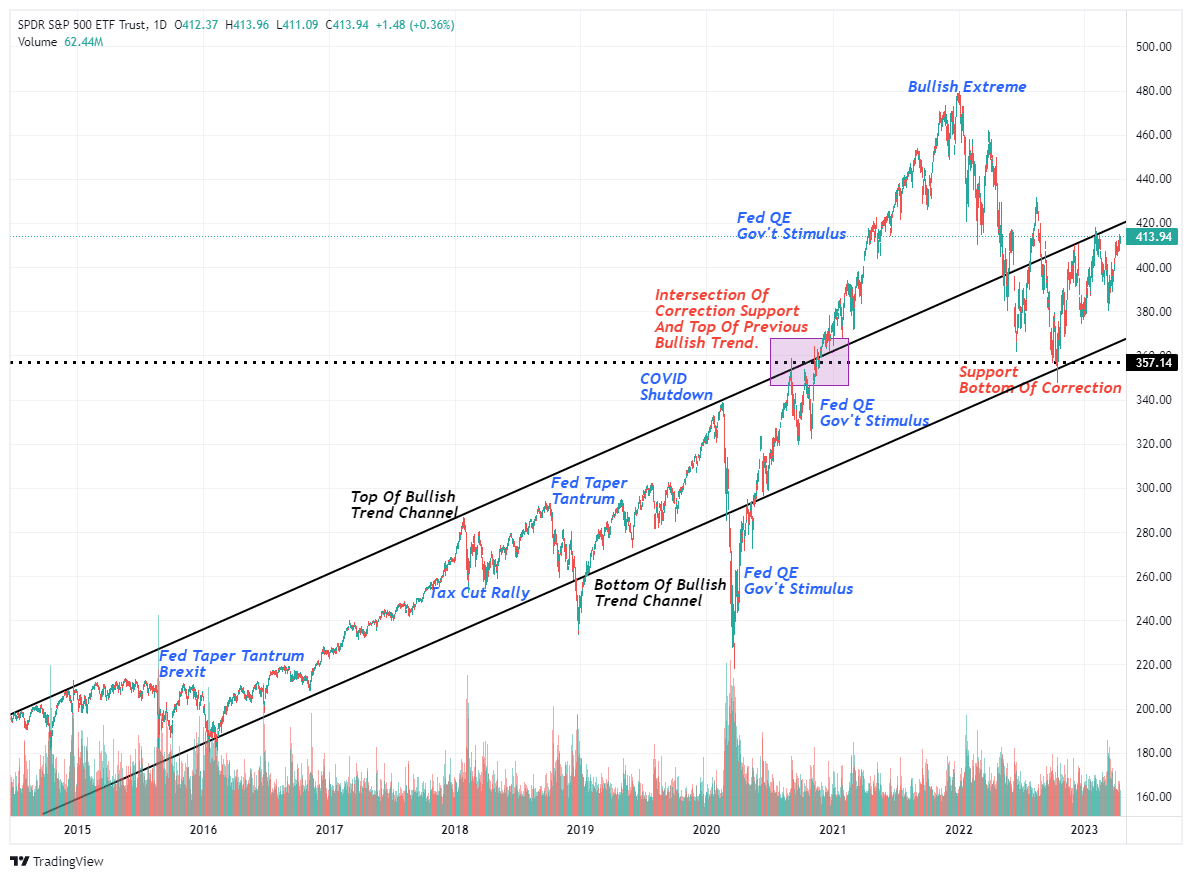
The reversal of that “speculative greed” to “fear” was expected. As we penned in April 2021:
“There is no way this bull market doesn’t end very badly. We all know that is the reality of this liquidity-fueled market, but we keep investing for “Fear Of Missing Out.”
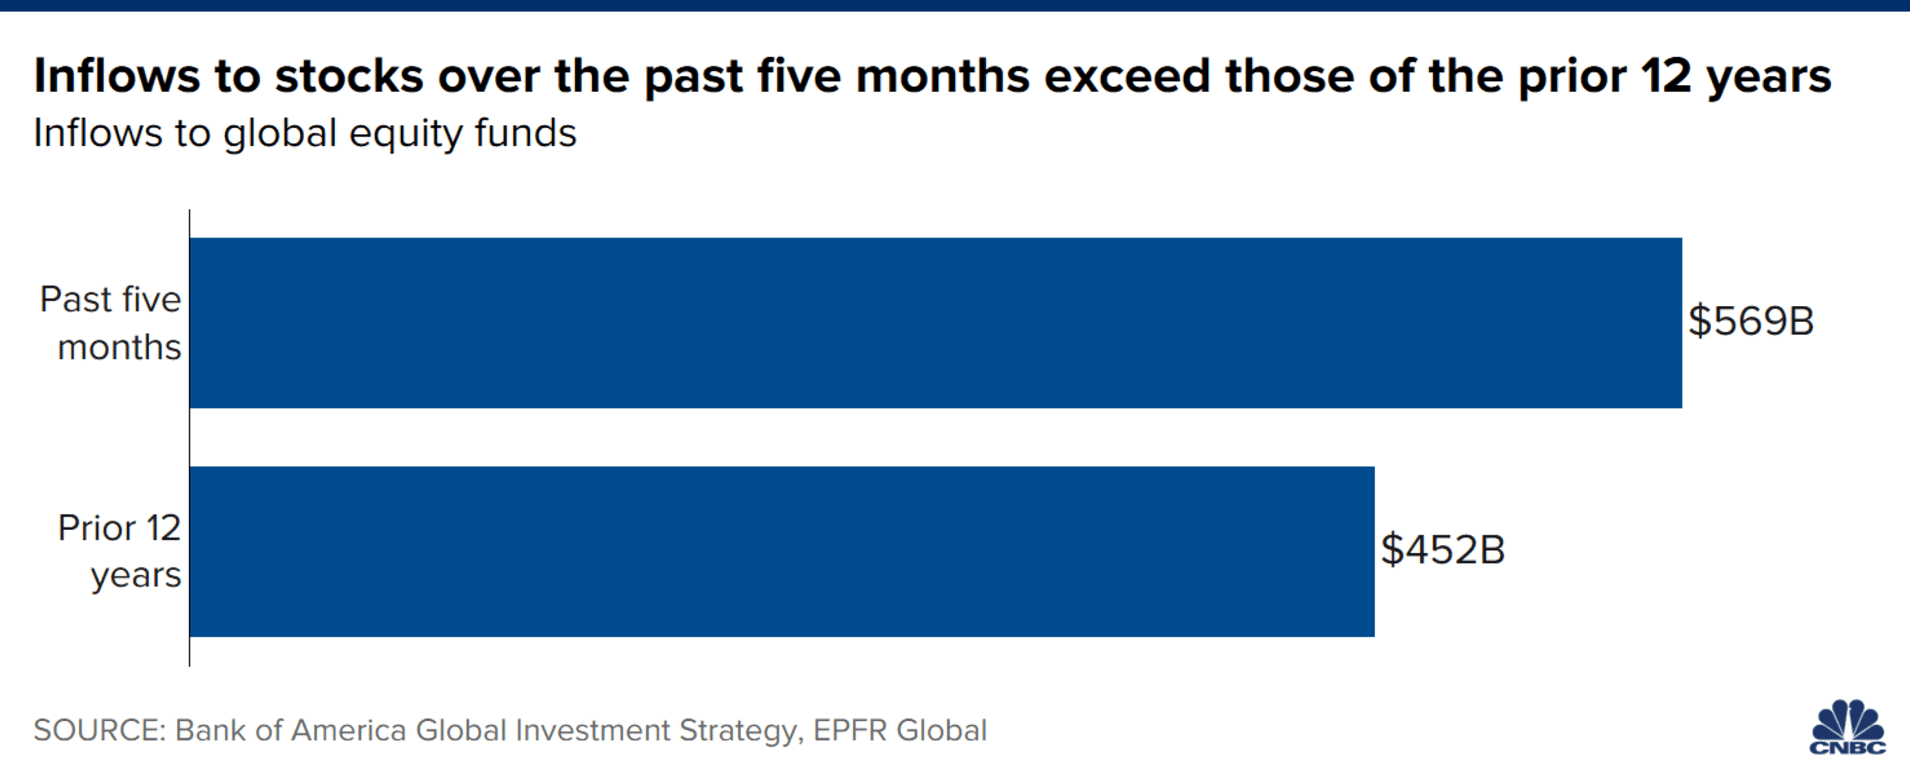
More importantly, over the past 5-MONTHS, more money has poured into the equity markets than in the last 12-YEARS combined.” – There Is No Way This Bull Market Doesn’t End Badly
The eventual reversal was inevitable as expectations far exceeded the realities of what the market, or the economy, could return. Furthermore, no one considered the inflationary impacts that would come from the massive fiscal and monetary interventions.
The debate, however, is whether the correction from the previous market peak has been completed after successfully retesting and holding the bottom of the long-term trend channel. A look at a weekly chart, and the subsequent confirming buy signals, suggests such may be the case. When the market trades above the 40-week moving average, such tends to remain the case for an extended period. Notably, when the market is more than 10% above its 40-week moving average, that denoted market excesses that eventually reverse.
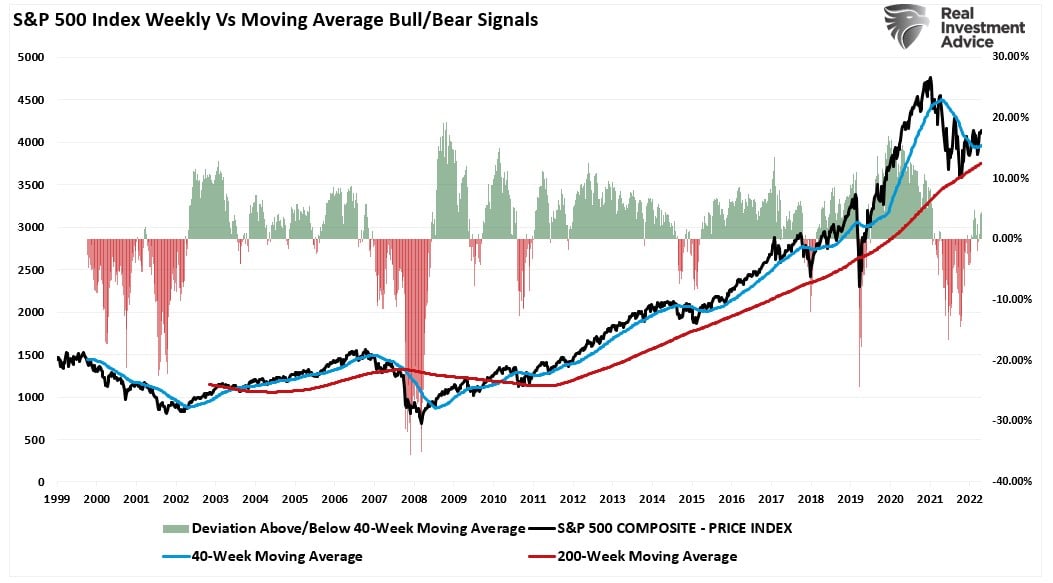
With the market now trading above the 40-week moving average, despite the bearish headlines and concerns of a recession, such generally suggests a more extended period of higher prices. Such gives credence to this notion of a “rolling recession” that allows the market to absorb negative impacts and continue to “climb a wall of worry.”
Still Potential For Another Correction
Before you think I am getting overly “bullish,” there are plenty of causes for concern.
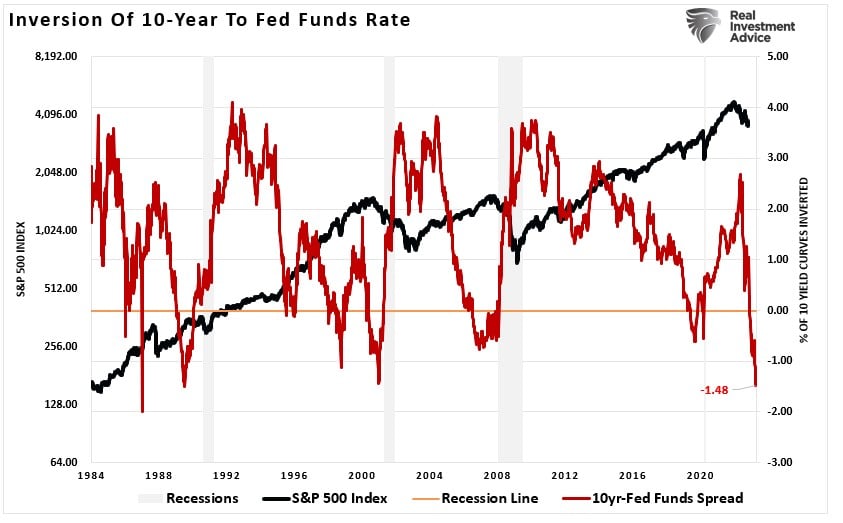
As discussed last week, yield curves and economic indicators are undoubtedly concerning and suggest an “official” economic recession is likely. The inversion of the Fed Funds rate to the 10-year Treasury is the most inverted since 1986 (roughly 10-months before the 1987 market crash.)
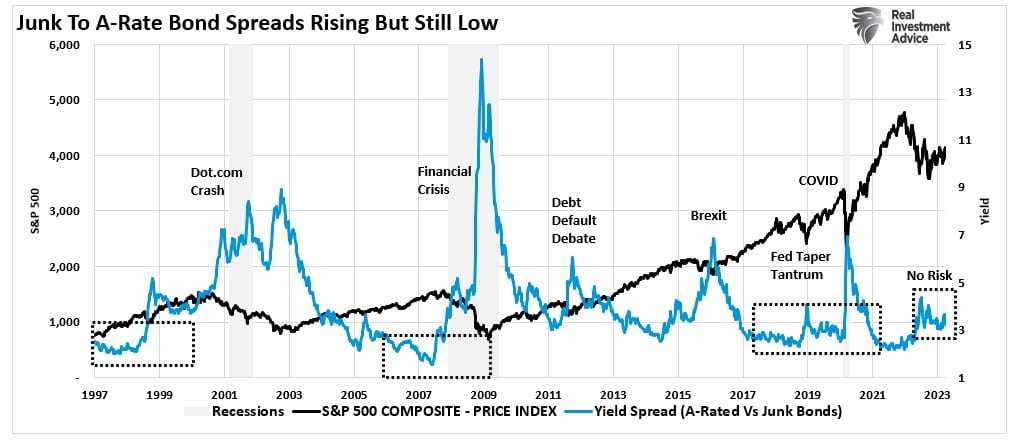
What causes significant market drawdowns, such as we saw in 2008 with the failure of Lehman Brothers, is an exogenous event that unexpectedly impacts the credit markets. So far, credit markets remain exceptionally complacent in terms of risk spreads. While the recent correction from the 2022 peak brought risk spreads up marginally, there is no “concern” of a credit-related event by the markets.
Such gives further credence to the rolling recession scenario, where the economic hits are spread out enough for the credit and financial markets to evaluate, absorb, and “price in” potential event impacts. However, that does not preclude the markets from experiencing recurring 5% to 10% drawdowns as markets continue to adjust for slower economic growth, falling inflation, and weaker earnings.
A correction should be acknowledged and expected. A 10% decline would lead to another retracement to the lows of the bullish trend channel, as noted above. If that support holds, that would be a logical place to add exposure to risk assets from a purely technical perspective.
Whether or not you agree with the idea of a “rolling recession” is up to you. There are certainly plenty of data points that currently argue against such a concept.
As investors, we should consider the possibility that the markets are more resilient to a decline given the massive amount of money supply still sloshing around the financial system.
How will this all work out? I really have no clue.
However, while we remain cautious in our portfolio management process, we need to give the “bullish trend” some acknowledgment considering it continues to hold.
How We Are Trading It
The big challenge for navigating this market is separating the bearish fundamentals from the bullish technicals. As noted, there are plenty of reasons to remain underexposed to equities, given the recession risks, but the bullish technicals suggest otherwise. The only period previously where such an environment existed was during the 1990s, when the markets trended higher during periods of economic weakness, including the 1991 recession and the 1994 bond market crash.

Currently, the bullish technicals suggest higher levels of equity exposure. However, as noted above, the “risk” is an unexpected, exogenous event that causes a sudden shift in sentiment and a spike in the credit markets. Such an event will NOT be the housing market, commercial real estate, or a dollar collapse. These issues are already well recognized by the markets. Even in a rolling recession, the event that creates a downdraft in the market will be something that both financial and credit markets are unaware of. The “surprise” factor always creates a cascade of selling pressure that drops markets sharply.
We must be aware of that potential risk as it most assuredly exists. However, we should be betting that it will occur as it may not. The markets are currently deeply discounting such an event.
Are the markets wrong? Maybe. But they may also be correct. This is the investing challenge that we face in portfolios.
With our buy signals becoming extended, we will likely take profits in our trading positions soon. However, we will continue to maintain exposure to our long-term holdings. We also want to use the recent rise in bond yields to increase our longer-duration bond holdings.
The current market rally has room to move higher. As such, we are looking for opportunities to rebalance exposures and risks accordingly.
- Tighten up stop-loss levels to current support levels for each position.
- Hedge portfolios against significant market declines.
- Take profits in positions that have been big winners.
- Sell laggards and losers.
- Raise cash and rebalance portfolios to target weightings.
Have a great week.
Research Report
Subscribe To “Before The Bell” For Daily Trading Updates (Formerly 3-Minutes)
We have set up a separate channel JUST for our short daily market updates. Please be sure to subscribe to THIS CHANNEL to receive daily notifications before the market opens.
Click Here And Then Click The SUBSCRIBE Button
Subscribe To Our Youtube Channel To Get Notified Of All Our Videos
Stock Of The Week In Review
The likely explanation for emerging markets outperformance is the weaker dollar. Currently, the dollar index sits on critical support while the S&P 500 bumps up against resistance. If the dollar breaks lower, it is likely foreign developed market stocks will continue higher. To help prepare for that potential, we downloaded the 100 largest stocks in EFA and ran their correlation versus the dollar over the last two years.
Here is a link to the full SimpleVisor Article For Step-By-Step Screening Instructions.
Login to Simplevisor.com to read the full 5-For-Friday report.
Daily Commentary Tidbits
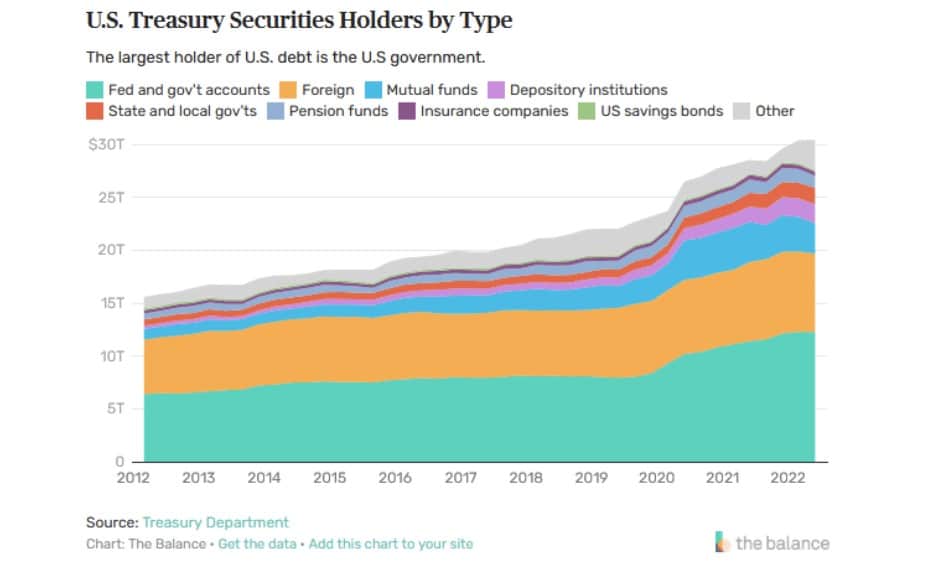
Banks are Selling Treasury Securities, Who is Buying?
“Commercial bank holdings of Treasury securities are down over 10% annually. Such is the largest percentage decline in 50 years. While the figure is daunting, context is important. The second graph charts their holdings in dollar terms. Their holdings are clearly falling, but in the aggregate, they still own over 30% more than they did pre-pandemic. Thus, the data does lead to an interesting question. Who is buying if the banks are net sellers and the Fed is reducing its holding?
The third graph below, courtesy of The Balance, shows that the “other” category is making up for declines by most traditional holders. “Others” include individuals, insurance companies, and private pension funds. While the data lags, we know that money market funds, which hold many Treasury securities, attracted over $300 billion in March. Money market assets are likely charging higher as individuals move money from banks to money market funds to chase higher yields.”
Bull Bear Report Market Statistics & Screens

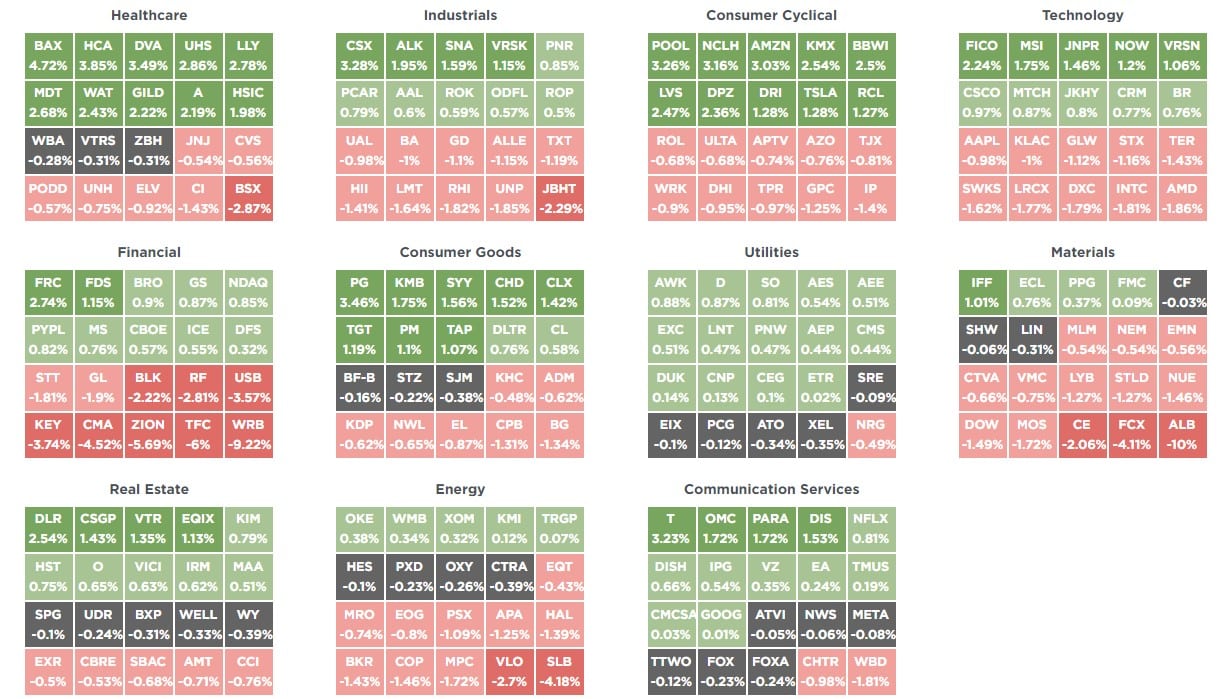
SimpleVisor Top & Bottom Performers By Sector
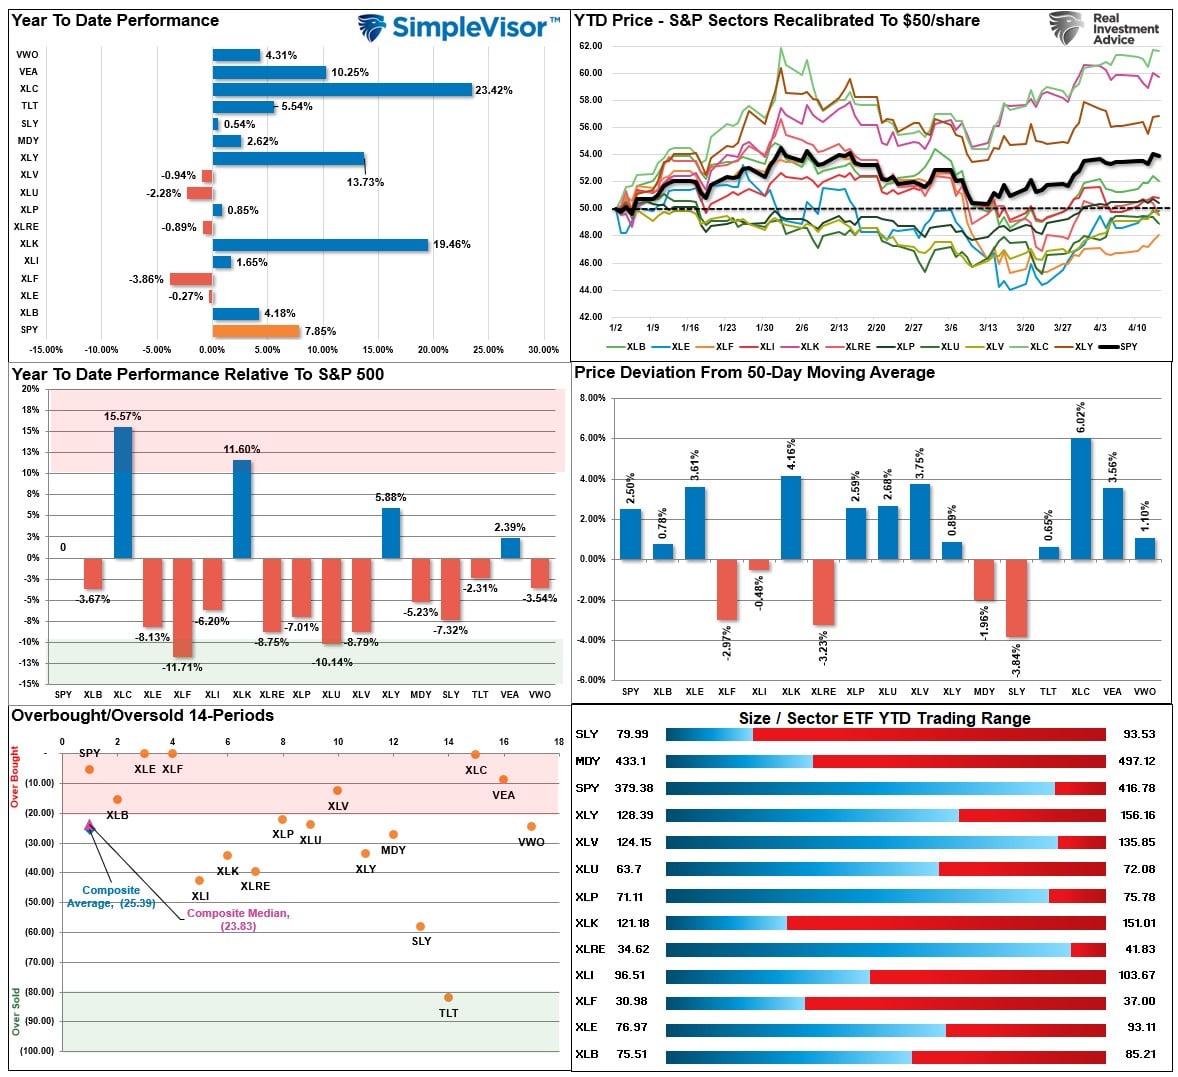
S&P 500 Weekly Tear Sheet

Relative Performance Analysis
As noted last week:
Although some of the short-term overbought conditions got resolved, much of it has not. Therefore, we could see additional sloppy trading next week as a result.
That sloppy market action was the case as the market essentially ended where it began. As such, much of the overbought conditions failed to resolve completely, suggesting we could see some additional weakness next week. With only Technology, Communications, and Discretionary driving the advance this year, those sectors are overbought and ripe for some profiting taking. Rebalancing portfolios heading into the summer months remains prudent.
Technical Composite
The technical overbought/sold gauge comprises several price indicators (RSI, Williams %R, etc.), measured using “weekly” closing price data. Readings above “80” are considered overbought, and below “20” are oversold. Markets peak when those readings are 80 or above, suggesting prudent profit-taking and risk management. The best buying opportunities exist when those readings are 20 or below.
The current reading is 74.60 out of a possible 100.

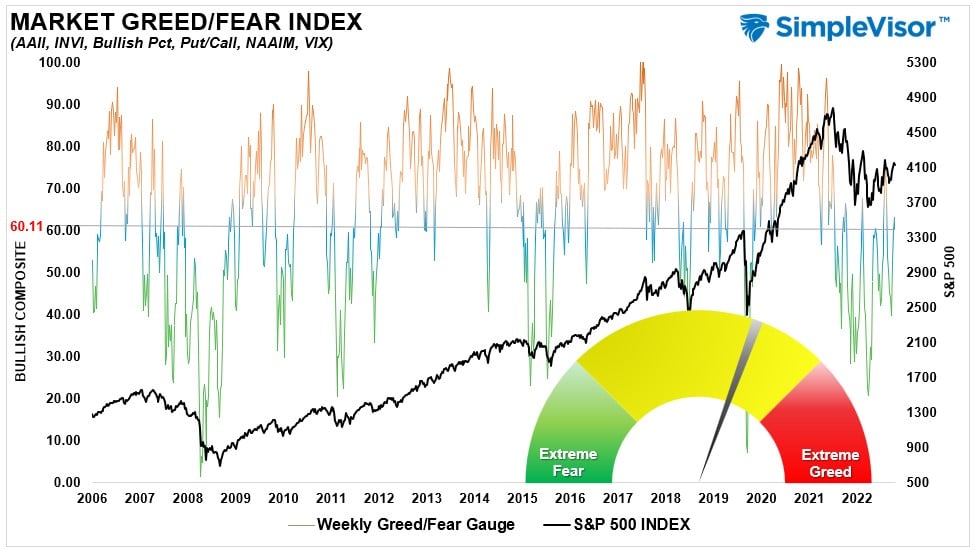
Portfolio Positioning “Fear / Greed” Gauge
The “Fear/Greed” Gauge is how individual and professional investors are “positioning” themselves in the market based on their equity exposure. From a contrarian position, the higher the allocation to equities, the more likely the market is closer to a correction than not. The gauge uses weekly closing data.
NOTE: The Fear/Greed Index measures risk from 0 to 100. It is a rarity that it reaches levels above 90. The current reading is 60.11 out of a possible 100.
Sector Model Analysis & Risk Ranges
How To Read This Table
- The table compares the relative performance of each sector and market to the S&P 500 index.
- “M” XVER” “Moving Average Cross Over) is determined by the short-term weekly moving average crossing positively or negatively with the long-term weekly moving average.
- The risk range is a function of the month-end closing price and the “beta” of the sector or market. (Ranges reset on the 1st of each month)
- The table shows the price deviation above and below the weekly moving averages.
As noted last week, “the rally in “defensive” areas last week, Utilities and Gold Miners, was not surprising as the rotation from Technology and Communications.” Those sectors remain overbought, and last week’s rally pushed Energy and Healthcare above their ranges. With most markets and sectors on bullish moving average crossovers, the most likely path for asset prices is higher over the near term. Maintain equity exposures, but watch for further rotations from grossly overbought areas into oversold.

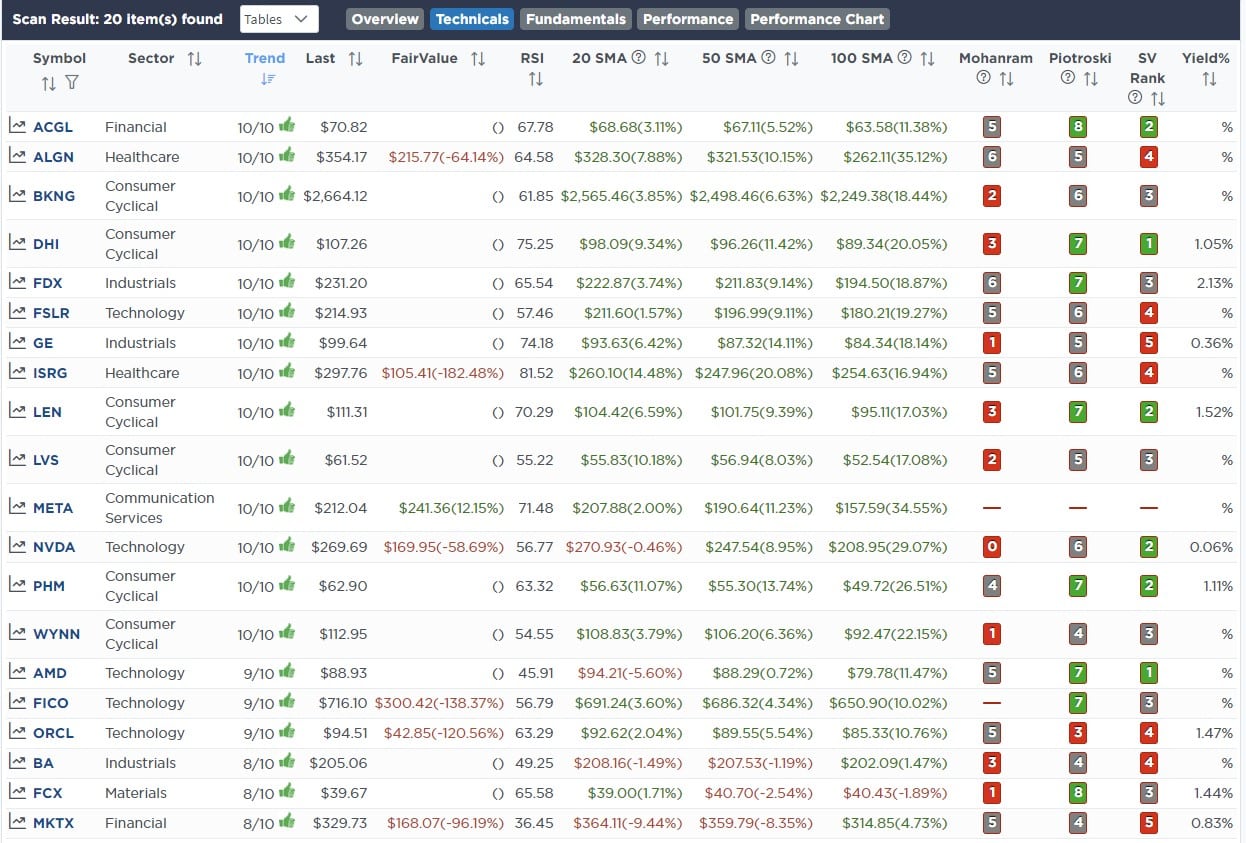
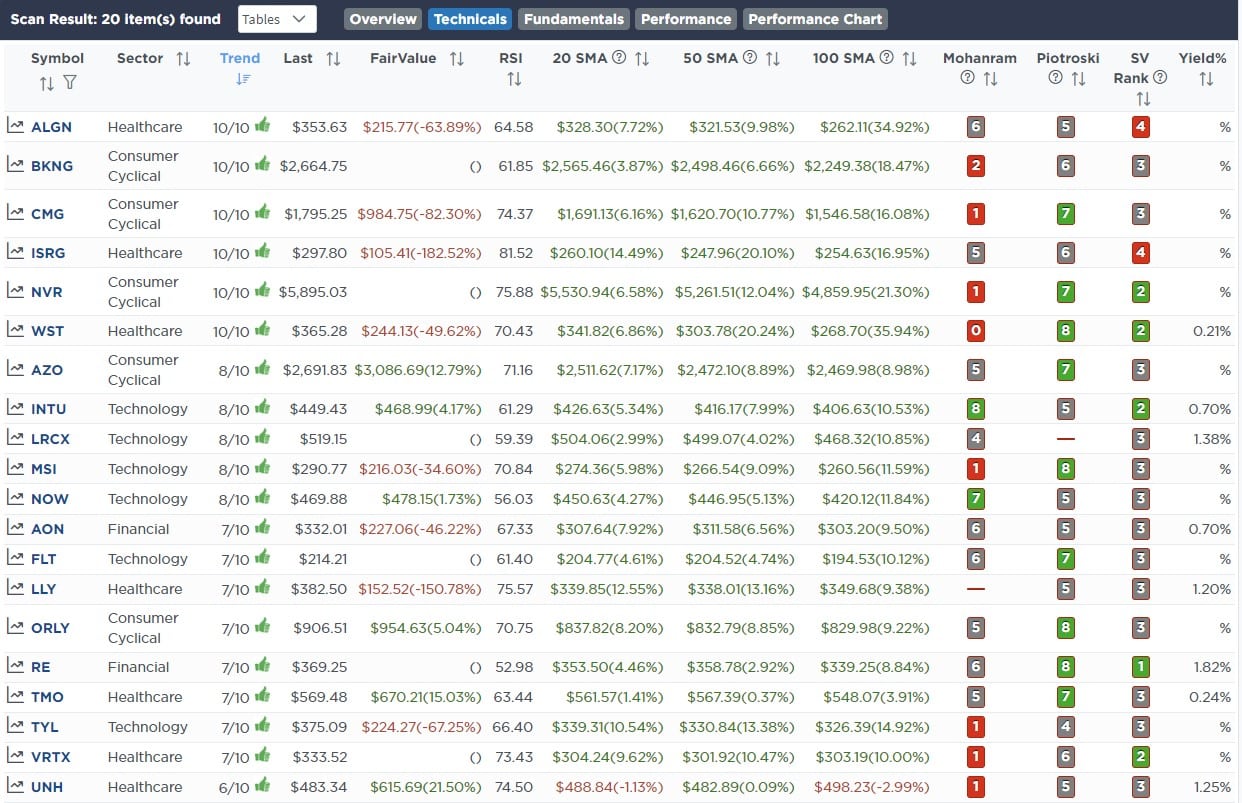
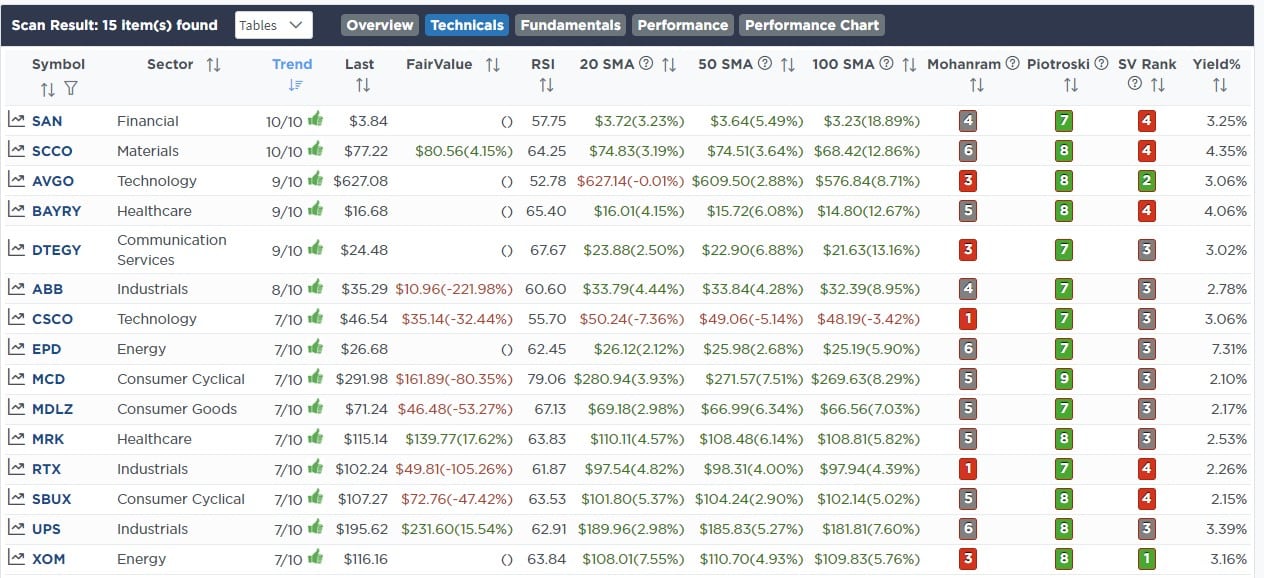
Weekly SimpleVisor Stock Screens
We provide three stock screens each week from SimpleVisor.
This week we are searching for the Top 20:
- Relative Strength Stocks
- Momentum Stocks
- Technically Strong Stocks With Dividends
(Click Images To Enlarge)
RSI Screen
Momentum Screen
Technically Strong With Dividends
SimpleVisor Portfolio Changes
We post all of our portfolio changes as they occur at SimpleVisor:
Apr 20th
In the famous lyrics of the Steve Miller Band:
“Go on, take the money and run.”
After adding some index trading positions to our portfolios previously, with yesterday’s reversal, we are removing those positions to “take the money and run.”
Since the mid-March lows, the markets have had about a 5-week run, which is long and is due for a correction period. Such could entail either a sideways consolidation or a pullback. In either case, we are temporarily reducing our equity exposure and raising cash levels until our next trading opportunity arises.
Both Models
- Sell 100% of the Vanguard S&P 500 Index ETF (VOO)
- Sell 100% of the Invesco Equal-Weight S&P 500 ETF (RSP)

Lance Roberts, CIO
Have a great week!

